How to run an assay
Seahorse XF Assay Learning Center

top
Procedures, techniques & resources for a successful Assay
This learning center is designed to introduce you to the Seahorse XF assay workflow, with a focus on procedures and techniques to ensure optimal XF assay performance and results. As you read through each section, the procedures refer to using the Agilent Seahorse XF Real Time ATP Rate Assay Cell Energy Phenotype Test to perform initial cell characterization. The techniques described apply to all Seahorse XF Assays, such as seeding adherent cells, loading injection ports, etc. Only the required consumables will vary according to your XF Analyzer model and XF Assay Kit. Select your XF Analyzer using the drop-down menu, then click a section below to display the relevant content for that step of the XF assay workflow.
The initial characterization described here is for adherent 2D cell lines using the Seahorse XF Real-Time ATP Rate Assay kit. For 3D models and other assays, reference Beyond the Basics section.
Note: The XF HS Mini Analyzer is compatible with standard XFp miniplates, XFp PDL miniplates, XF HS miniplates, and XF HS PDL miniplates. The purpose of the XF HS miniplate and XF HS PDL miniplate design is to allow performance of XF assays with significantly fewer cells per well, facilitating functional analysis of non-proliferative or limited amounts of cells.
Both XFp miniplates and XF HS miniplates consist of an eight-well cell culture plate, but the XF HS miniplates differ in that they feature a raised “ring” element in the center of each well. This means that the seeding area of the well is 0.031 cm2, approximately 30% of the area of standard XFp cell culture plates. XF HS miniplates are also pre-assembled with a silicone cell-seeding mask and plate lid. Each package of XF HS miniplates includes a mask removal tool.
Note: Optimization of cell density is recommended for both XF HS miniplates and XFp miniplates.
1. Gather Assay Materials
This section lists materials required to set up your XF assay.
This section lists materials required to set up your XF assay.
Note: All XFp assay kits and consumables are compatible with the XF HS Mini Analyzer.
1.1 Required Materials from Agilent
1.2 Other Required Materials Provided by the User
1.1 Required Materials from Agilent
- Agilent Seahorse XF Pro Analyzer with Controller
- Agilent Seahorse Analyzer
- Agilent Seahorse FluxPaks
- Agilent Seahorse FluxPak
- Agilent Seahorse FluxPak
- Agilent Seahorse XFp or XFp PDL FluxPak
- Agilent Seahorse XFp, XFp PDL, XF HS, or XF HS PDL Mini FluxPak
- Appropriate XF Assay Kit
- Appropriate XFp Assay Kit
- Agilent Seahorse XF Flex Analyzer with Controller
- Agilent Seahorse XFe24 FluxPak or Agilent Seahorse XFe24 FluxPak mini
- Seahorse XF Real-Time ATP Rate Assay Kit
- Seahorse XF DMEM assay medium pack or Seahorse XF RPMI assay medium pack
- 37 °C Non-CO2 incubator
- Cell counter/Hemocytometer
- 37 °C water bath
- Inverted Brightfield Microscope
- Touch vortex
- 15 and 50 mL conical tubes
- P200, P1000, 8 and/or 12 multi-channel P200 pipettes
- Reagent Reservoirs
- Agilent BioTek Cytation (recommended for adherent cell normalization)
- Hoechst stain
- Appropriate XF Assay Media
- Seahorse XF DMEM assay medium, pH 7.4 or Seahorse XF RPMI assay medium, pH 7.4
- Seahorse XF Glucose (1.0 M solution)
- Seahorse XF Pyruvate (100 mM solution)
- Seahorse XF Glutamine (200 mM solution)

Determining the optimal miniplate for your XF HS Mini assay
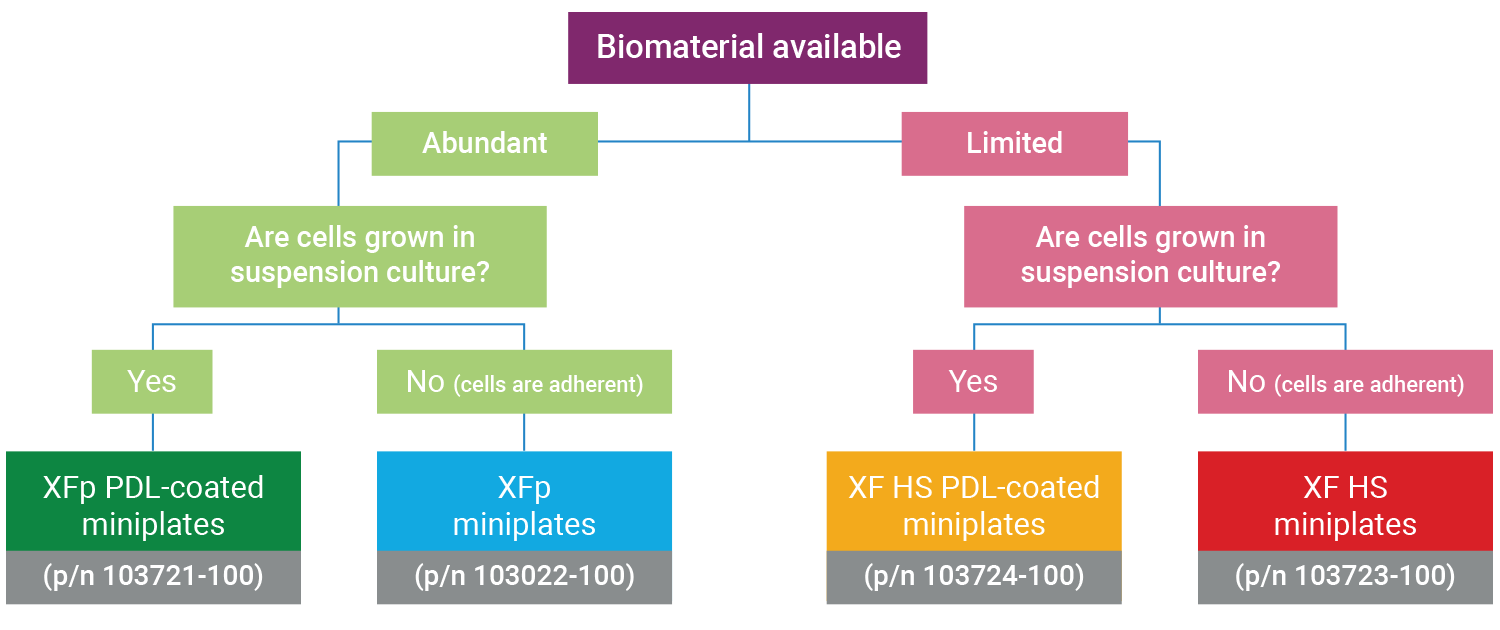
The XF HS Mini Analyzer is compatible with all Seahorse XFp kits, reagents, cell culture plates, and FluxPaks.
Related Support Material
- Training Webinar: Gather Assay Materials
- Agilent Seahorse XF Flex Consumables Guide
- Agilent Seahorse XF Assay Kits and Reagents
- Agilent Seahorse XF Plastic Ware Brochure
- Agilent Seahorse XF Assay Kits and Reagents
- Consumables Guide
- Consumables Guide
- Consumables Guide
- Consumables Guide
- Consumables Guide
- Consumables Guide
- Seahorse XF Media and Buffer Selection Guide
- Preparation of XF Assay Media
- Preparation of XF Assay Media
- Cell Characterization: The XFe96/XF96 Analyzer and the Seahorse XF Real-Time ATP rate assay
- Cell Characterization: The XFe24 Analyzer and the Seahorse XF Real-Time ATP rate assay
- Cell Characterization: The XFp Analyzer and the Seahorse XFp Real-Time ATP rate assay
- Cell Characterization: The XF HS Mini Analyzer and the XF Real‐Time ATP Rate Assay
- Cell Characterization: The XF HS Mini Analyzer with the HS Miniplate and the XF Real-Time ATP Rate Assay
- Agilent Seahorse Assay Guides and Templates
- Agilent Seahorse Assay Guides and Templates
- Agilent Seahorse Assay Guides and Templates
- Agilent Seahorse Assay Guides and Templates
- Agilent Seahorse Templates
- Agilent Cell Analysis Publication Database
Browse the full list of publications using Agilent Cell Analysis data.
1.2 Other Required Materials Provided by the User
Other Required Materials
- 37 °C non-CO2 incubator
- Cell counter/Hemacytometer
- 37 °C water bath
- Distilled or Sterile H2O
- Inverted Brightfield Microscope
- Touch vortex
- 15 and 50 mL conical tubes
- P200, P1000, 8 and/or 12 channel P200 pipettes
- P200, P1000, 8 channel P200 pipettes
- Reagent Reservoirs
Recommended Materials
- Centrifuge with adaptors for cell culture plates (required if using suspension cell types)
- Microcentrifuge
- Calibrated pH meter*
- Stir plate*
- Sterile filter bottles (0.22 μm filter) and cap*
- 1.0 N NaOH solution*
(* these items are required if using assay media other than Seahorse XF DMEM pH 7.4 or Seahorse XF RPMI pH 7.4)
Related Support Material
- Training Webinar: Gather Assay Materials
- Seahorse XF Sensor Cartridges and Tissue Culture Microplates
- Seahorse XF Assay Kits and Reagents
- Consumables Guide
- Consumables Guide
- Consumables Guide
- Seahorse XF HS Mini Consumables Ordering Guide
- Seahorse XF Media and Buffer Selection Guide
- Preparation of XF Assay Media
- Preparation of XF Assay Media
- Cell Characterization: The XFe96/XF96 Analyzer and the Seahorse XF Real-Time ATP rate assay
- Cell Characterization: The XFe24 Analyzer and the Seahorse XF Real-Time ATP rate assay
- Cell Characterization: The XFp Analyzer and the Seahorse XFp Real-Time ATP rate assay
- Cell Characterization: The XF HS Mini Analyzer and the XF Real‐Time ATP Rate Assay
- Cell Characterization: The XF HS Mini Analyzer with the HS Miniplate and the XF Real-Time ATP Rate Assay
Reference Material
- Agilent Seahorse Assay Guides and Templates
- Agilent Seahorse Assay Guides and Templates
- Agilent Seahorse Assay Guides and Templates
- Agilent Seahorse Assay Guides and Templates
- Agilent Seahorse Templates
- Agilent Cell Analysis Publication Database
Browse the full list of publications using Agilent Cell Analysis data.
Showing only information for the Seahorse Seahorse XF Pro
Change instrument type2. Prepare for Your XF Assay
This section focuses on preparation techniques the day before an XF assay, including guidance for choosing cell seeding densities, techniques for seeding adherent cells on XF tissue culture plates and hydrating XF cartridges.
This section focuses on preparation techniques the day before an assay, including guidance for choosing cell seeding densities, techniques for seeding adherent cells on XFp tissue culture plates and hydrating XFp cartridges.
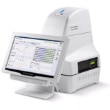
This section focuses on preparation techniques the day before an assay, including guidance for choosing cell seeding densities, techniques for seeding adherent cells on XFp miniplates, XF HS miniplates, or XF HS PDL miniplates and hydrating an 8-well sensor cartridge.
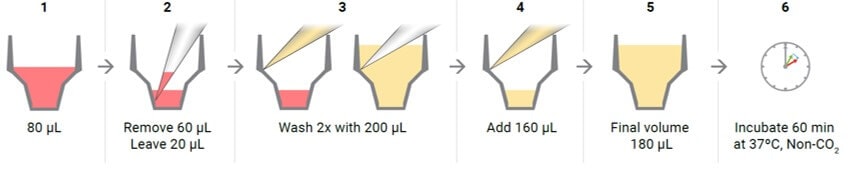
Note: See workflow diagram for an overview of the steps involved in running an XF HS Mini assay.
Select a workflow step to display help content.
2.1 Choose Cell Seeding Densities
2.5 Prepare XFp PDL or XF HS PDL miniplates (suspension cells only)
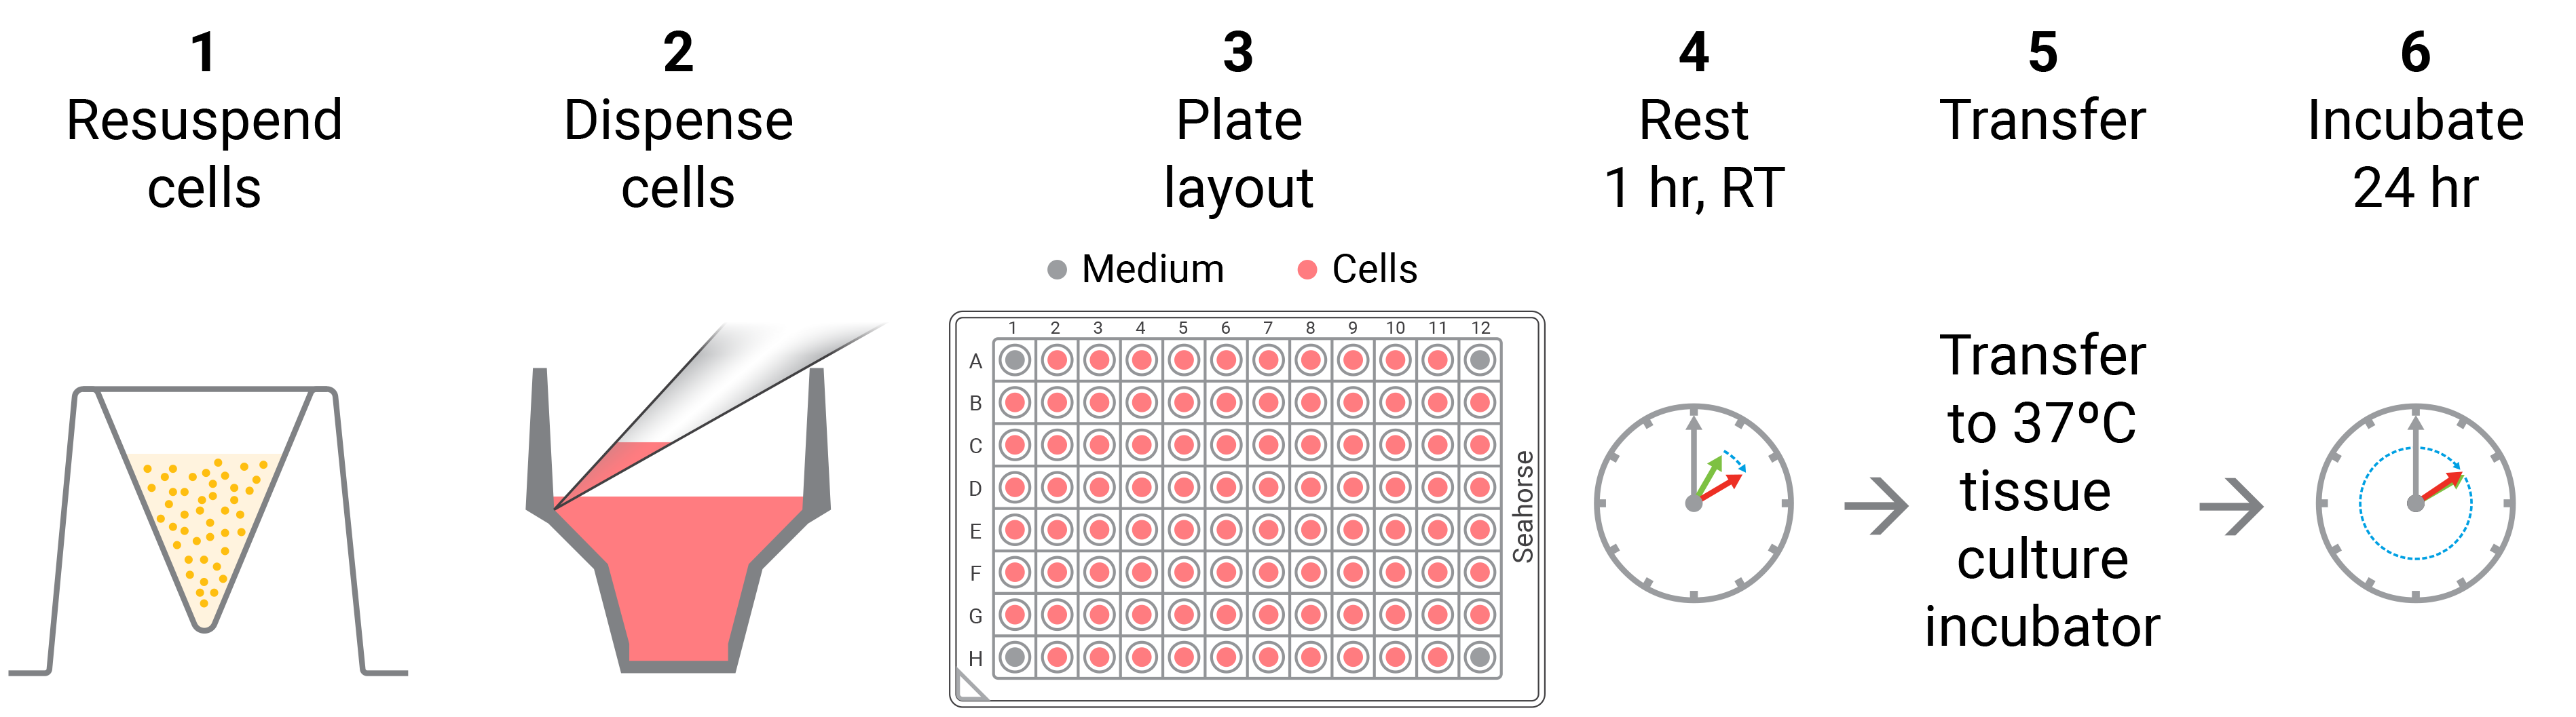
Overview of performing an assay with XFp or XF HS miniplates.
2.1 Choose Cell Seeding Densities
Basic procedures for choosing cell seeding densities
To effectively examine metabolic and bioenergetic function using your Agilent Seahorse Extracellular Flux Analyzer, Analyzer, it is essential to first characterize a specific cell type with respect to its metabolic activity under basal and maximal respiration (OCR) and extracellular acidification (ECAR). The Seahorse XF Real-Time ATP rate assay Test Kit The Seahorse XFp Real-Time ATP rate assay Test Kit can be used to characterize the cell line/type of interest in a single assay. two short assays.
Optimal cell seeding number varies by cell type, but is typically between 5 x 10³ and 4 x 10⁴ cells per well for adherent cells. Suspension cells require higher seeding density from 5 x 10⁴ to 2 x 10⁵ cells per well depending on cell type. 1 x 10⁴ and 8 x 10⁴ cells per well. Generally, densities resulting in 50-90% confluency generate metabolic rates in the desirable/dynamic range of the instrument.
Optimal cell seeding number varies by cell type and plate type. Generally, densities resulting in 50–90% confluency generate metabolic rates in the desirable/dynamic range of the instrument. See table for further details.
For XF HS miniplates and XF HS PDL miniplates, optimal cell seeding number is typically between 1.0 × 10³ and 1.0 × 10⁴ cells per well for adherent cells. Suspension cells require higher seeding density from 2.0 x 10⁴ and 7.0 x 10⁴ cells per well depending on the cell type.
For XFp miniplates and XFp PDL miniplates, optimal cell seeding number is typically between 5 x 10³ and 4 x 10⁴ cells per well for adherent cells. Suspension cells require higher seeding density from 5 x 10⁴ to 2 x 10⁵ cells per well depending on cell type.
Please consult the Agilent Cell Analysis Publication Database to provide an initial starting point for cell density values specific to your needs.
Please consult the Agilent Cell Analysis Publication Database to provide an initial starting point for cell density values specific to your needs.
| Plate type | Optimal cell seeding number (cells/well) | |
|---|---|---|
| adherent cells | suspension cells | |
| XF HS miniplates / XF HS PDL miniplates | 1.0 × 10³ – 1.0 × 10⁴ | 2.0 × 10⁴ – 7.0 × 10⁴ |
| XFp miniplates / XFp PDL miniplates | 5 × 10³ – 4 × 10⁴ | 5 × 10⁴ – 2 × 10⁵ |
Basic procedures for choosing cell seeding densities
To effectively examine metabolic and bioenergetic function using your Agilent Seahorse Extracellular Flux Analyzer, it is essential to first characterize a specific cell type with respect to its metabolic activity under basal and maximal respiration (OCR) and extracellular acidification (ECAR). The Seahorse Cell Energy Phenotype Test Kit can be used to characterize the cell line/type of interest in two short assays
Optimal cell seeding number varies by cell type, but is typically between 1 x 10⁴ and 8 x 10⁴ cells per well. Generally, densities resulting in 50-90% confluency generate metabolic rates in the desirable/dynamic range of the instrument.
Please consult the Agilent Cell Analysis Publication Database to provide an initial starting point for cell density values specific to your needs.
Related Support Material
- Prepare for your XF Assay
- Knowing your cells of Interest: Advice and Suggestions for a Successful XF Experience
- An Introduction to the Cell Energy Phenotype Test
- Cell Characterization: The XFe96/XF96 Analyzer and the Seahorse XF Real-Time ATP rate assay
- Cell Characterization: The XFe24 Analyzer and the Seahorse XF Real-Time ATP rate assay
- Cell Characterization: The XF24 Analyzer and the Cell Energy Phenotype Test
- Cell Characterization: The XFp Analyzer and the Seahorse XF Real-Time ATP rate assay
- Cell Characterization: The XF HS Mini Analyzer and the XF Real‐Time ATP Rate Assay
- Cell Characterization: The XF HS Mini Analyzer with the HS Miniplate and the XF Real-Time ATP Rate Assay
- Seahorse XF Real Time ATP Rate Assay User Guide
- Technical Overview: Characterizing Your Cells - Using OCR Values to Determine Optimal Seeding Density
- Agilent Seahorse Assay Guides and Templates
- Agilent Seahorse Assay Guides and Templates
- Agilent Seahorse Assay Guides and Templates
- Agilent Seahorse Assay Guides and Templates
- Agilent Seahorse Templates
- Agilent Cell Analysis Publication Database
Browse the full list of publications using Agilent Cell Analysis data.
2.2 Hydrate Cartridge
Basic procedures for hydrating the 8-well sensor cartridge
Note: XFp sensor cartridges are compatible with the XF HS Mini analyzer
An important component of the XFp HS Mini assay platform is the sensor cartridge. Each probe tip of the sensor cartridge is spotted with a solid-state sensor material that detects changes in both pH and O2 concentration over time to calculate rates. In order for the sensors to function correctly, they must be thoroughly hydrated.
The Day Prior to the XFp HS Mini assay:
- Aliquot at least 20 mL of XF Calibrant into a 50 mL conical tube. Place this in a non-CO2 37° C incubator overnight.
- Aliquot at least 5 mL of XF Calibrant into a 15 mL conical tube. Place this in a non-CO2 37° C incubator overnight.
- Open the Extracellular Flux Assay Kit, and remove the contents.
- Obtain a three-pack of cartridges from the green box. Remove the foil seal from the tub(s) that will be used.
- Place the sensor cartridge upside down next to the utility plate.
- Separate the utility plate and sensor cartridge, and place the sensor cartridge upside down next to the utility plate.
- Fill each well of the utility plate with 200 μL of sterile, tissue culture grade water.
- Fill the moats around the outside of the wells with 400 µL per chamber.
- Lower the sensor cartridge onto the utility plate, submerging the sensors in the water.
- Verify the water level is high enough to keep the sensors submerged.
- Place in a non-CO2 37 °C incubator overnight. To prevent evaporation of the water, verify that the incubator is properly humidified.
- The sensor cartridge hydration protocol continues in section 3.1 of the Learning Center, please continue reading
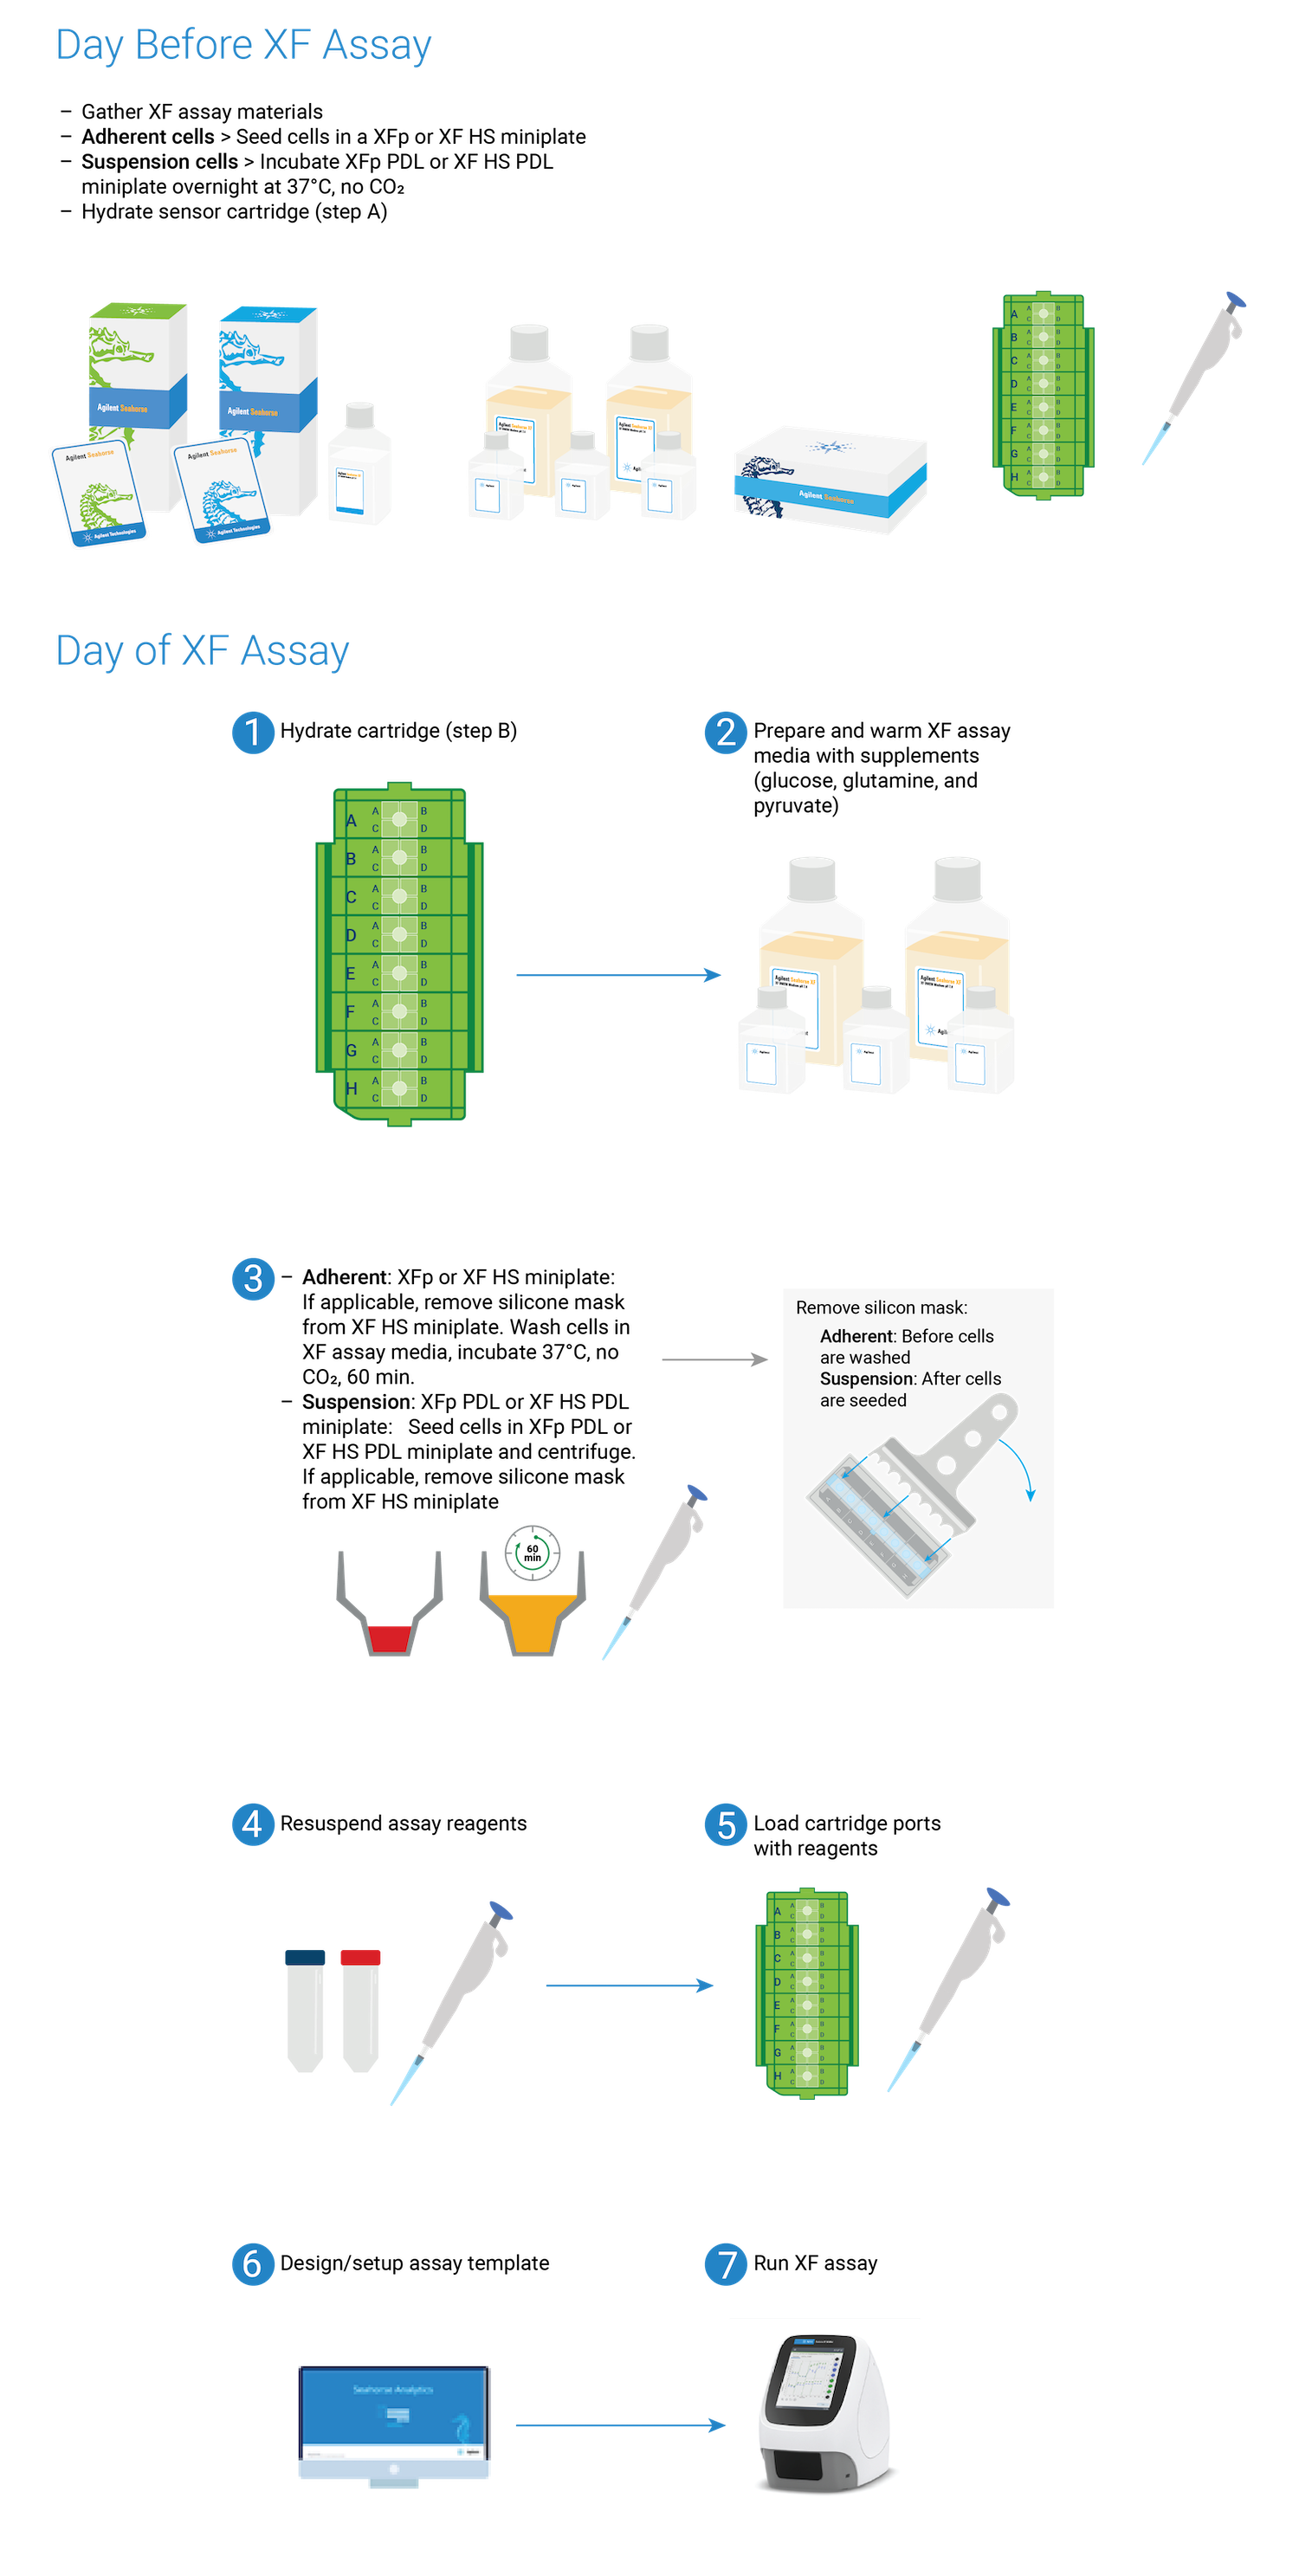
- Open the Seahorse XFe96/XF Pro Extracellular Flux assay kit and remove the contents.
- Place the sensor cartridge, upside down, next to the utility plate.
- Fill each well of the utility plate with 200 μL of XF calibrant.
- Place the XF Hydrobooster on top of the utility plate, and push the XF Hydrobooster downward to make sure it has tightly assembled with the utility plate.
- Lower the sensor cartridge through the openings on the XF Hydrobooster plate into the utility plate, submerging the sensors in XF calibrant.
- Verify that the XF calibrant level is high enough to keep the sensors submerged.
- Place in a nonCO2 incubator at 37 °C and leave overnight. To prevent evaporation of the XF calibrant, the incubator should be humidified.
- The sensor cartridge hydration protocol continues in section 3.1 of the Learning Center, please continue reading
- Open the Agilent Seahorse Flux Assay Kit and remove the contents.
- Place the Sensor Cartridge upside down next to the Utility Plate.
- Fill each well of the Utility Plate with 1 mL of XF Calibrant.
- Place the Hydro Booster on top of the Utility Plate.
- Lower the Sensor Cartridge through the openings on the Hydro Booster plate, into the Utility Plate submerging the sensors in XF Calibrant.
- Lower the sensor cartridge onto the utility plate, submerging the sensors in the water.
- Verify the XF Calibrant level is high enough to keep the sensors submerged.
- Place in a non-CO2 37°C incubator overnight. To prevent evaporation of the XF Calibrant, the incubator should be humidified.
- IMPORTANT NOTE: The Hydro Booster must be removed prior to placing the Sensor Cartridge into the Agilent Seahorse Analyzer. Failure to do so may result in damage to both the Sensor Cartridge and the Analyzer. See Section 3 for further instructions.
Related Support Material
- How to Hydrate an Agilent Seahorse XFe96 Sensor Cartridge
- How to Use the Agilent Seahorse XF Hydrobooster to Hydrate an XF Sensor Cartridge
- How to Hydrate an Agilent Seahorse XFe24 Sensor Cartridge
- How to Hydrate an Agilent Seahorse XF24 Sensor Cartridge
- How to Hydrate an Agilent Seahorse XFp Sensor Cartridge
- Cell Characterization: The XFe96/XF96 Analyzer and the Seahorse XF Real-Time ATP rate assay
- Cell Characterization: The XF24 Analyzer and the Cell Energy Phenotype Test
- Cell Characterization: The XFe24 Analyzer and the Seahorse XF Real-Time ATP rate assay
- Cell Characterization: The XFp Analyzer and the Seahorse XF Real-Time ATP rate assay
- Agilent Seahorse Assay Guides and Templates
- Agilent Seahorse Assay Guides and Templates
- Agilent Seahorse Assay Guides and Templates
- Agilent Seahorse Assay Guides and Templates
- Agilent Seahorse Templates
- Agilent Cell Analysis Publication Database
Browse the full list of publications using Agilent Cell Analysis data.
2.3 Design Experiment
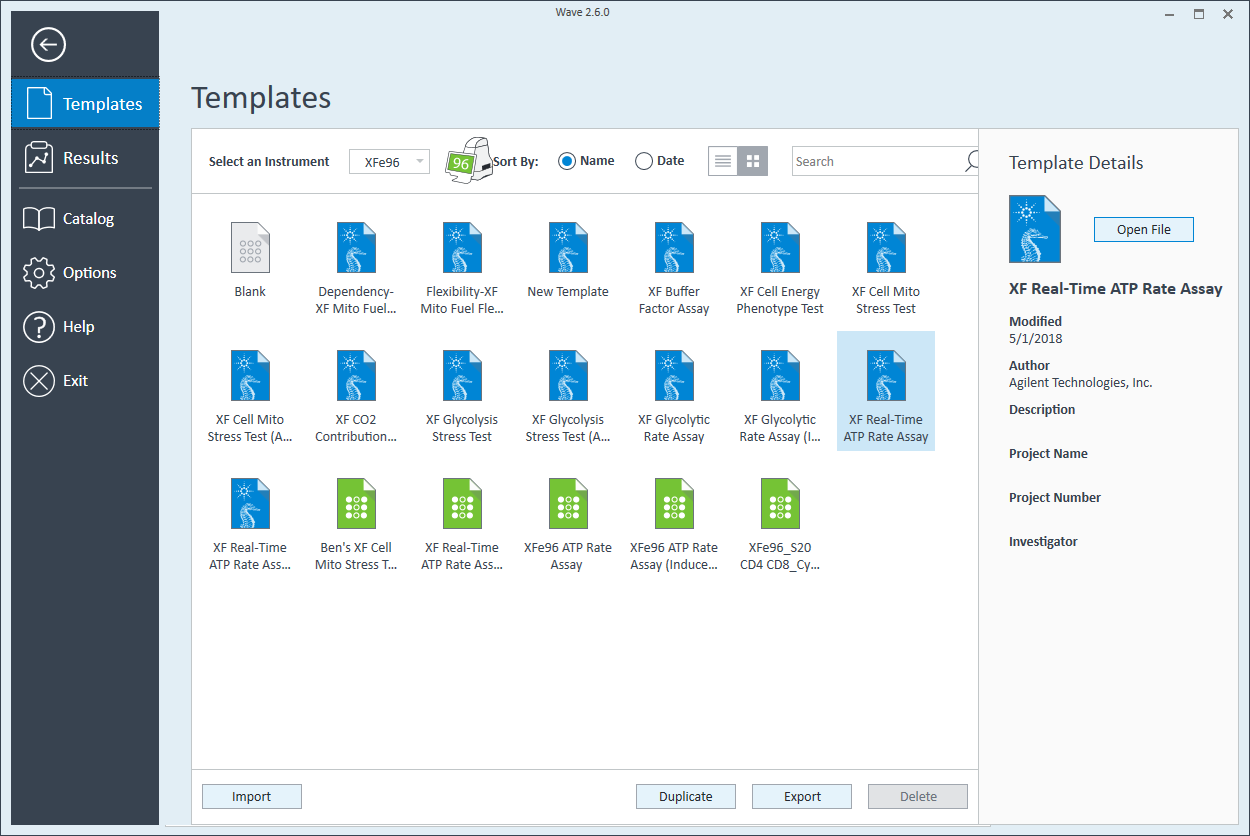
Wave Pro, XF Pro Controller, and Seahorse Analytics softwares all allow for easy creation and customization of assay template files to run on the Seahorse XF Pro analyzer. Directions for using the XF Pro Controller are provided below.
An Assay Template File is required to run assays on all Seahorse Analyzers and must be created before you can run an assay. Think of assay template file as an electronic copy of the experiment you designed in your lab notebook. A template can be reused as many times as necessary, shared with other users, duplicated or customized as a new assay template for a different XF assay.
The 3 elements of an assay template file are:
- Group Definitions
- Plate Map
- Instrument Protocol
Group Definitions
- Open software
- Click Templates
- Open the assay template called XF Real-Time ATP Rate Assay
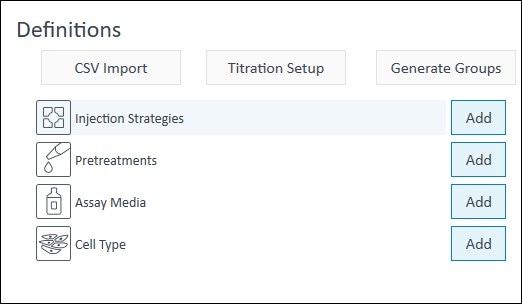
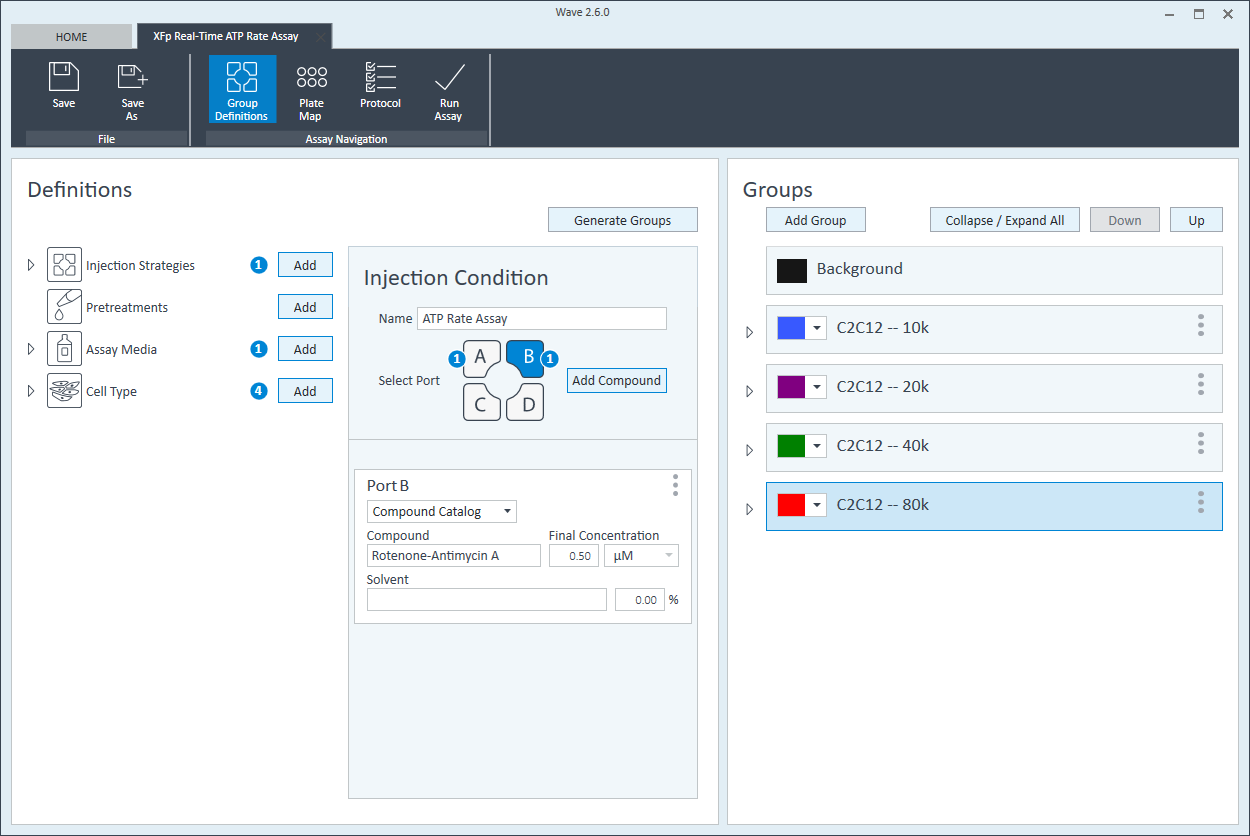
- On the Group Definitions view, you will see prepopulated information for the injection strategy, pretreatments, assay media and cell type.
- Double-click Pretreatments and delete the Control & Experimental entries.
- Double-click Cell Type and delete the default entry called Cells.
- Within the Cell Type group definition, click Cell Type and Add to add a new cell type entry and enter the name of cell type you intend to analyze in your assay. It is recommended to add the seeding density to group name. For example, the C2C12 Cell Type with a seeding density of 20,000 cells per well would be named: 20k C2C12
Repeat 3 times for each Cell Type definition.
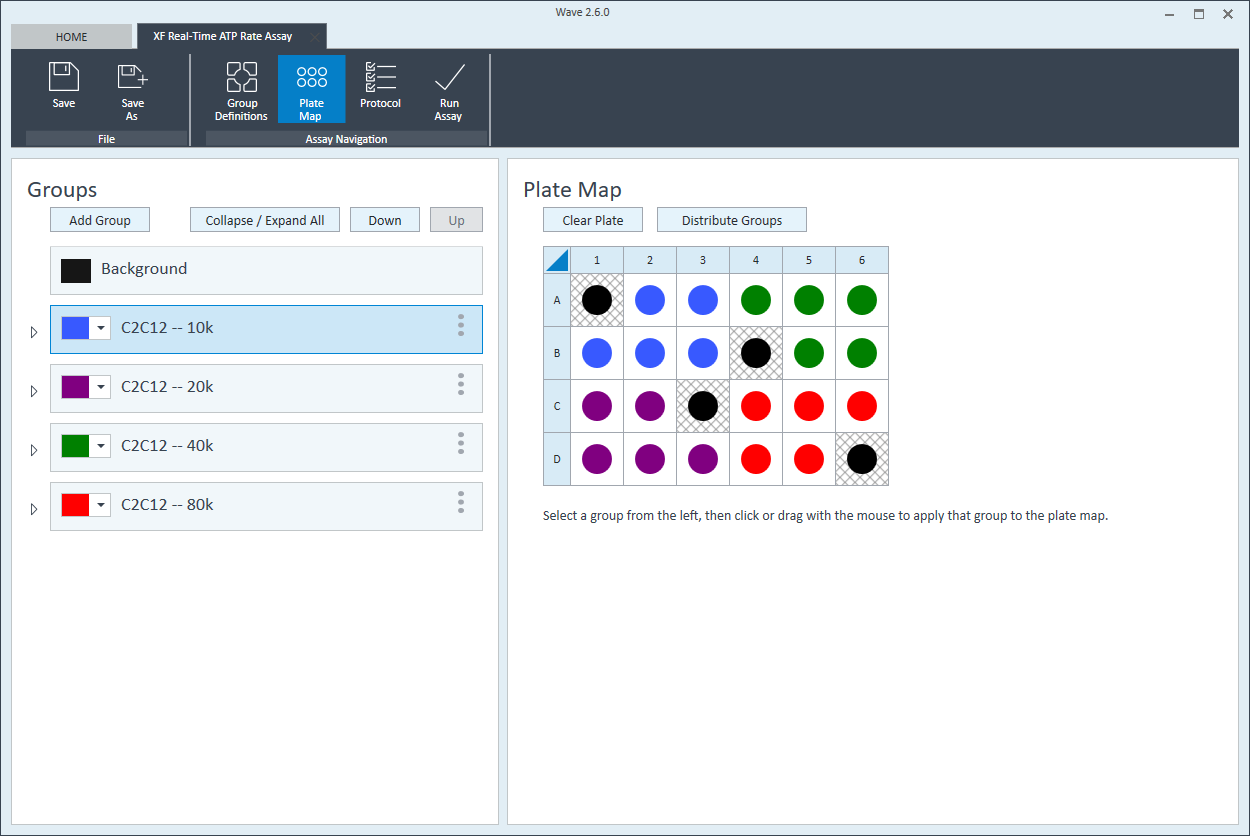
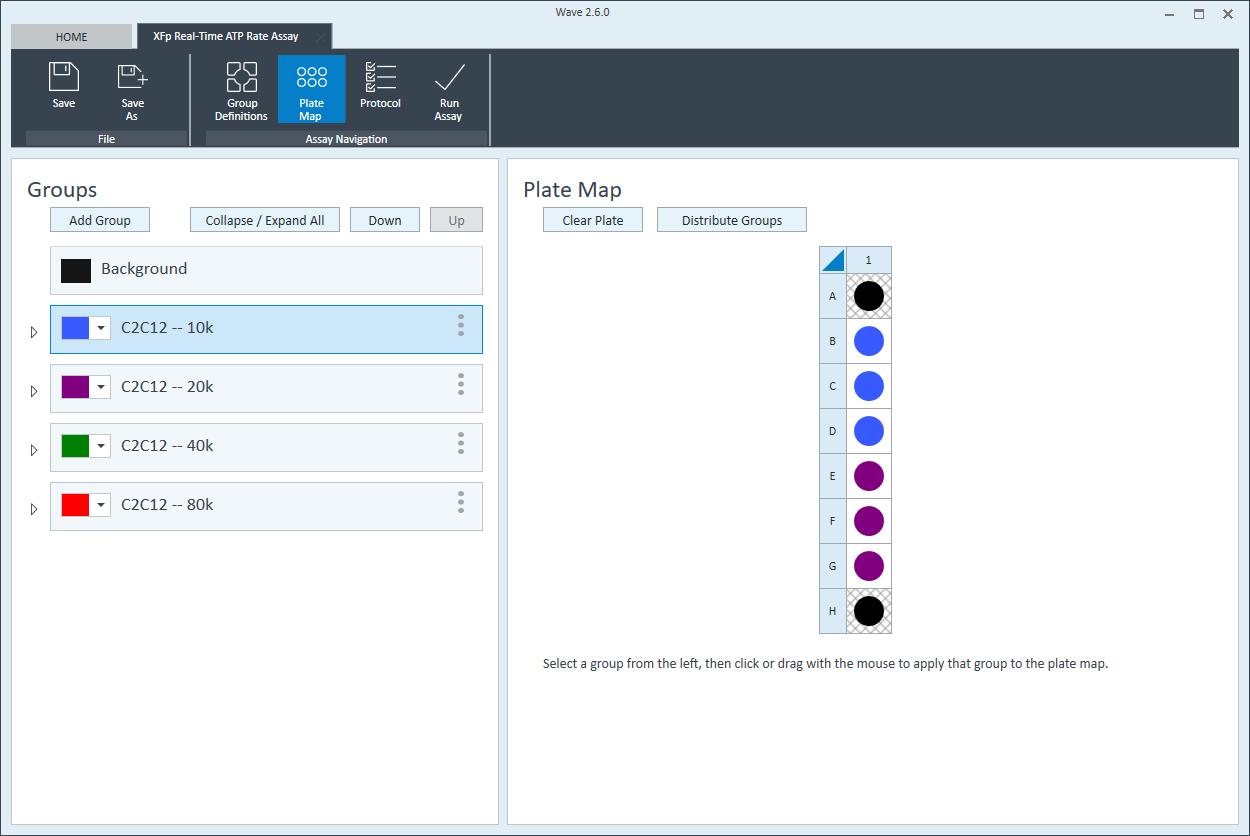
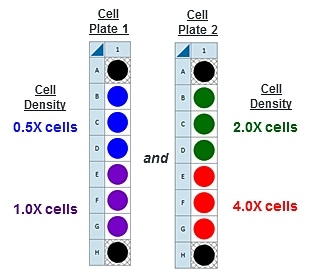
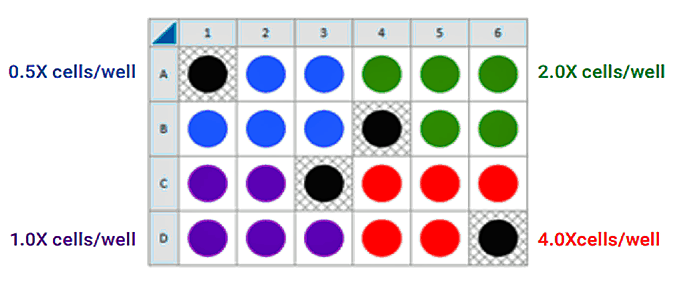
Note: Due to the XFe24 Analyzer's 24-well microplate format, this cell seeding density optimization protocol can be performed using 1 cell plate with 4 cell seeding densities (n=5 per group). Due to the Analyzer’s 96-well microplate format, this cell seeding density optimization protocol can be performed using 1 cell plate with 4 cell seeding densities (n=22-24 per group). Due to the Analyzer’s 8-well miniplate format, this cell seeding density optimization protocol must be performed using two cell plates with 2 cell seeding densities per plate (n=3 per group). When designing your assay template, you can:- Create a new assay template for the 3rd and 4th cell seeding density groups.
- Add 4 cell seeding density groups to one assay template and reassign the 3rd and 4th cell group to the plate map after performing the first assay with cell seeding density groups 1 and 2.
- Rename groups in this template after performing the first assay with cell seeding density groups 1 and 2.
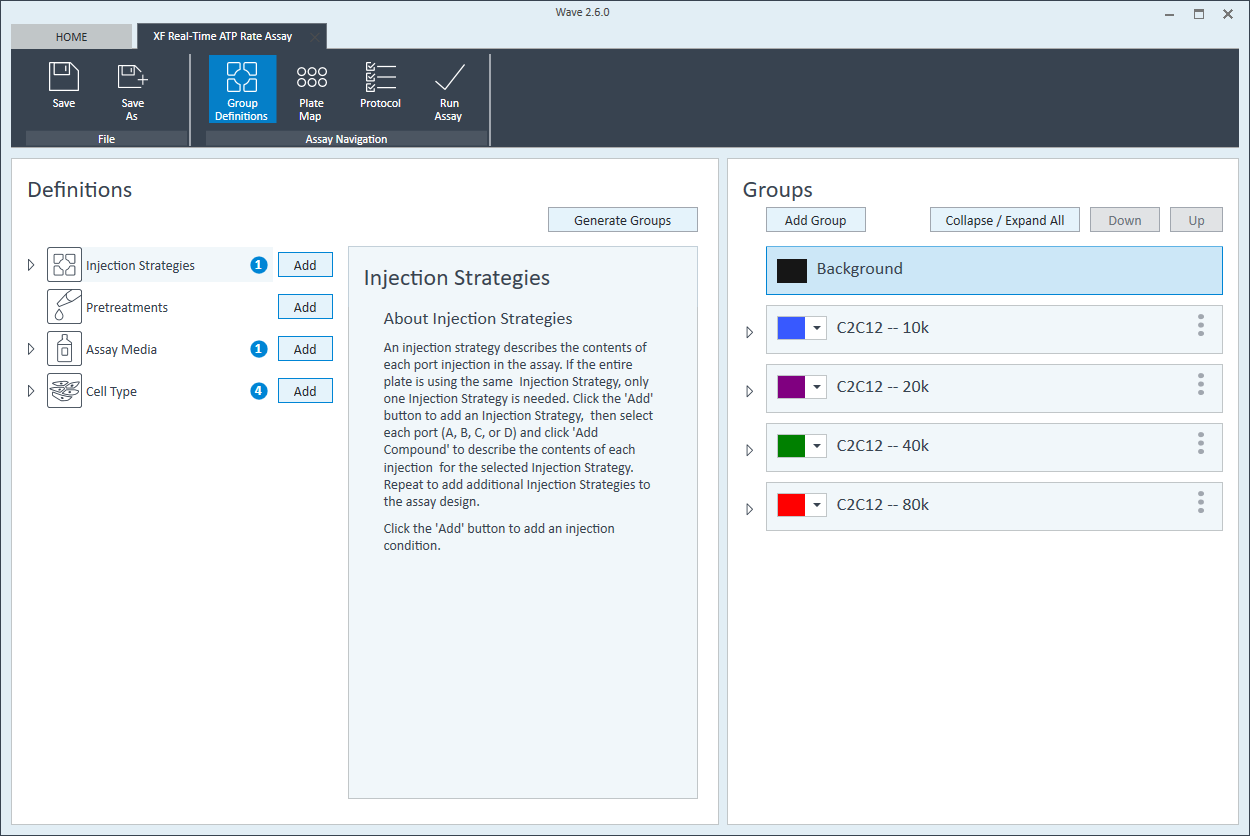
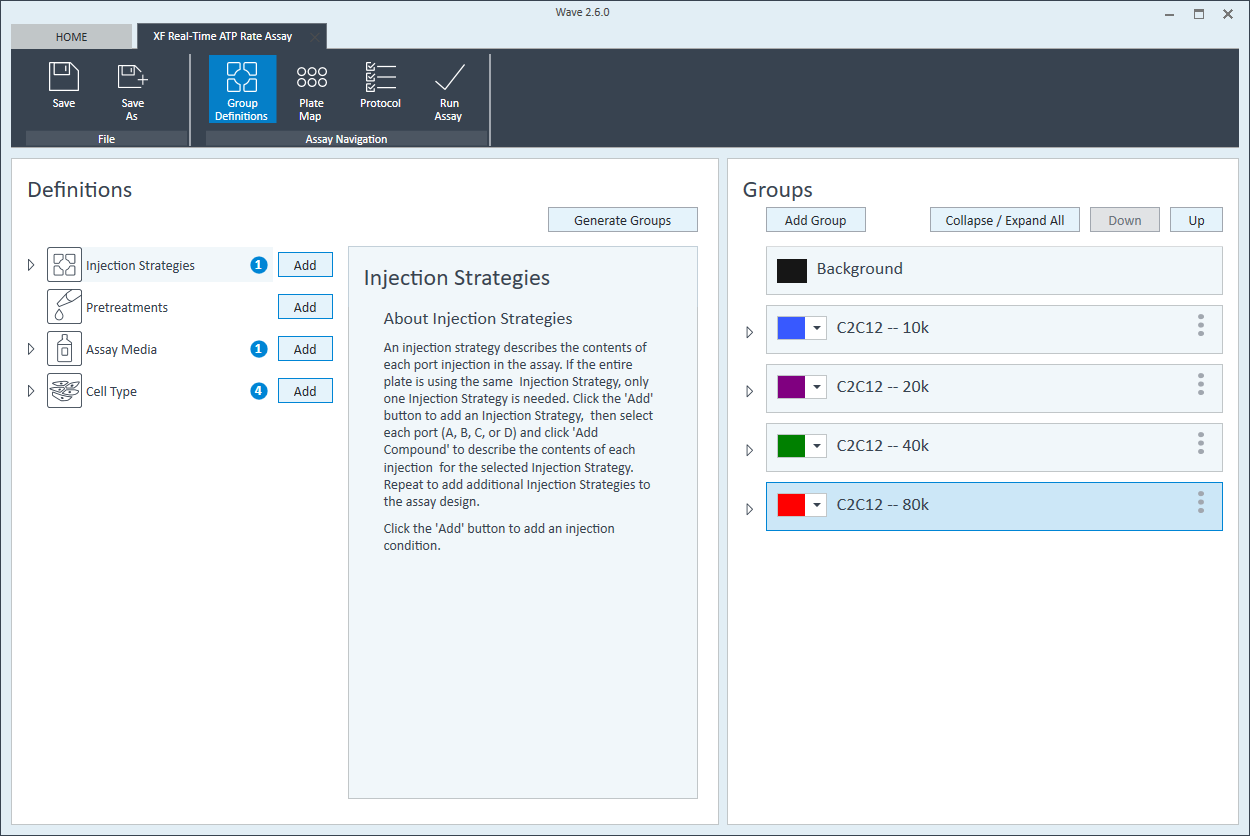
- Once finished naming your groups, click Generate Groups to automatically create your 4 unique assay groups. Notice the group name includes the cell type and seeding density for simplified plate map assignment.
The next step is to assign groups to the plate map.
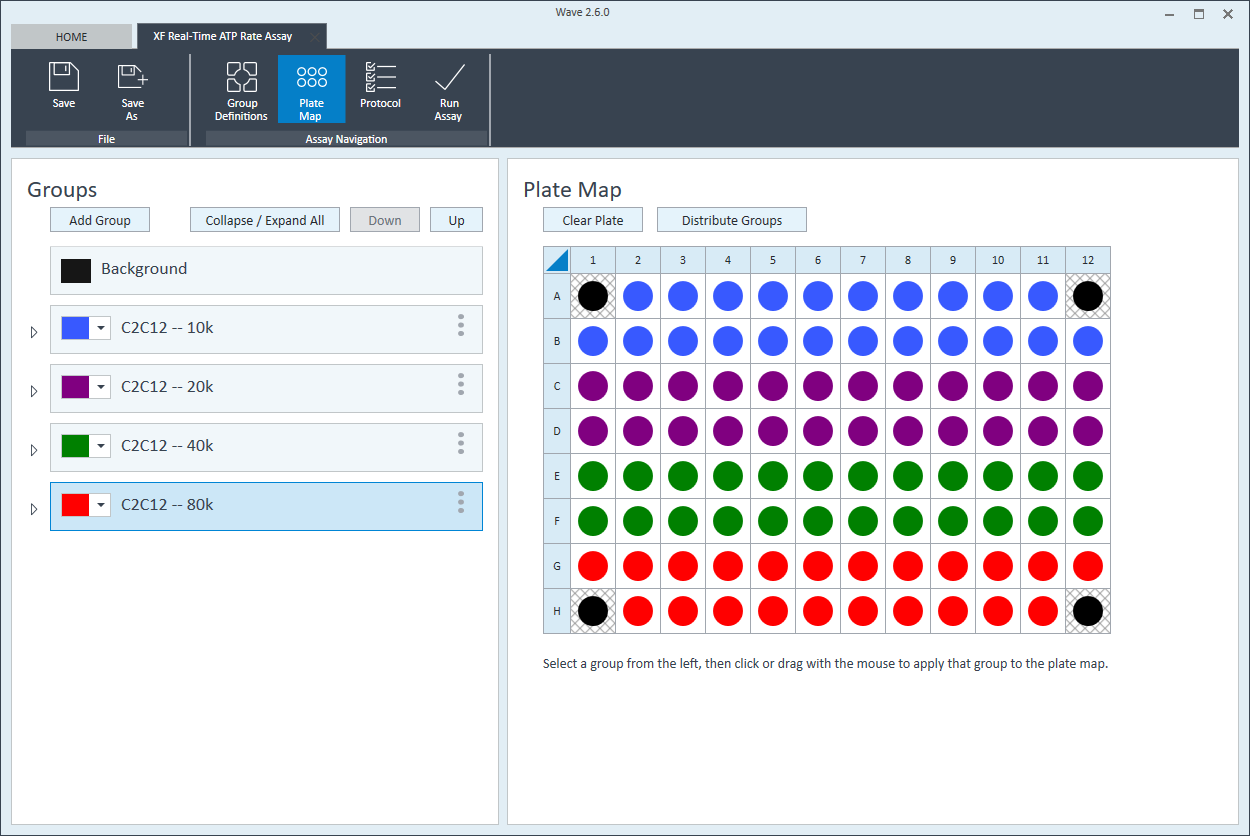
Plate Map
- Click Plate Map in the functions ribbon (under "Assay Navigation").
- Groups can be assigned to the plate map automatically or manually. For automatic selection, click Distribute Groups. For manual selection, click the group name in the group list, then:
- Click the column header (i.e. 1, 2, 3, etc.) or the row header (i.e. A, B, C, etc.)
- Drag & drop an area of wells on the plate map using your mouse left-click.
- Click individual wells on the plate map.
- Repeat for the next cell seeding density group. The suggested plate map layout is pictured.
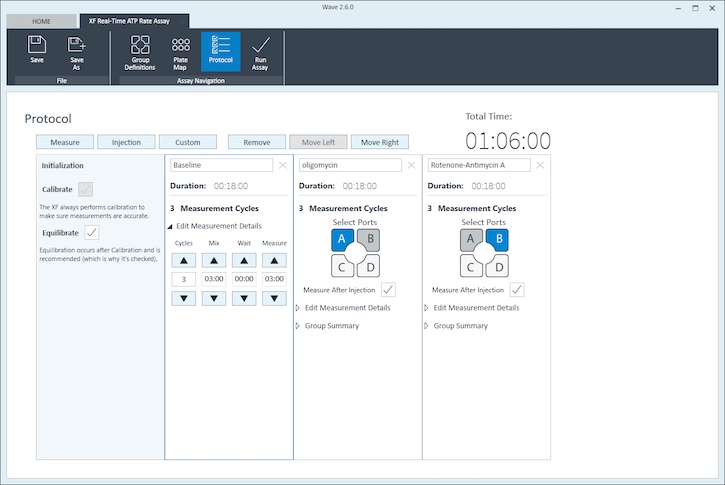
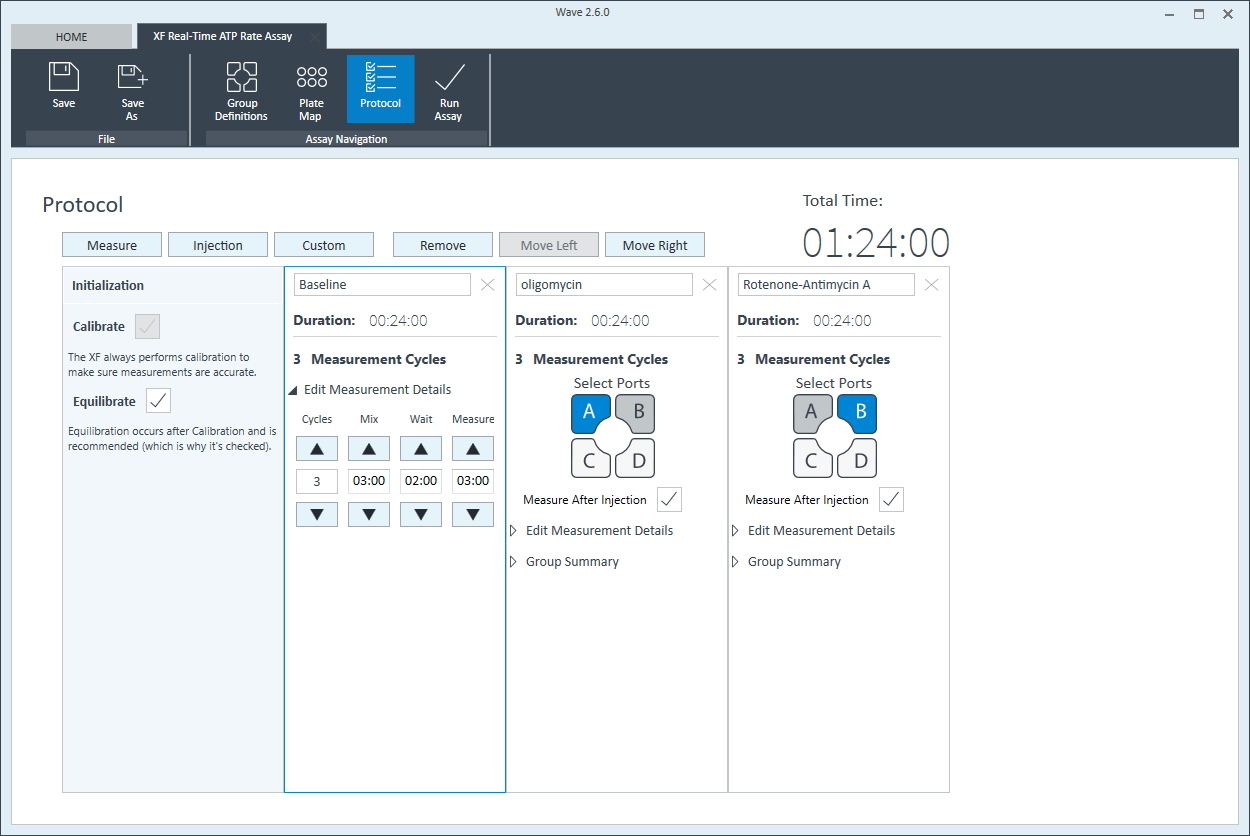
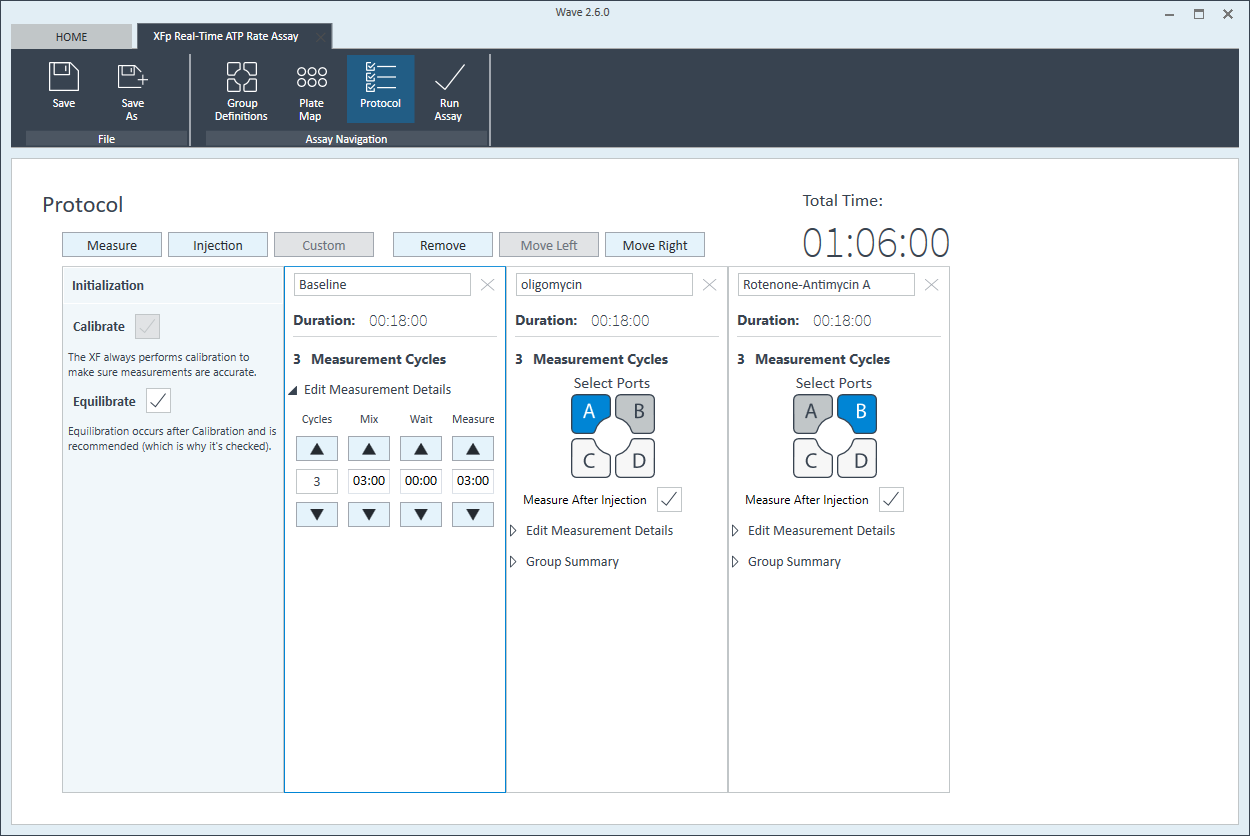
Instrument Protocol
- Click Instrument Protocol in the functions ribbon (under “Assay Navigation”) to view or edit the instrument protocol.
Note:The default instrument protocol does not require modifications, however you can change the name of a protocol command, the number of measurements, or the length of time each measurement is performed. Modifying the protocol settings directly affects how data is acquired during your assay and is not recommended.
- Last, click Run Assay in the functions ribbon (under "Assay Navigation") to add additional experimental details, save the template file, and start the cell seeding density optimization assay.
- Click Run Assay in the functions ribbon (under "Assay Navigation") to add additional experimental details and save the template file.
- Transfer the assay template file to the XFp Analyzer following steps outlined in the XFp Extracellular Flux User Guide to perform the first cell seeding density optimization assay.
- Transfer the assay template file to the XF HS Mini Analyzer following steps outlined in the XF HS Mini Extracellular Flux User Guide to perform the first cell seeding density optimization assay.


Related Support Material
- >Wave User Guide
- Wave Read Me
- Wave Release Notes
- XF Software & Computer Specifications
- XF Software & Computer Specifications
- Agilent Seahorse XF Real Time ATP Rate Assay Templates
- Agilent Seahorse Wave Pro and XF Pro Controller Software User Manual
- How to analyze Agilent XF Real-Time ATP Rate Assay result data
- Agilent Seahorse XF HS Mini Templates
- Seahorse XF HS Mini Software Update (February 2021)
2.4 Seeding Cells
2.3 Seeding Cells
Basic procedures for seeding adherent cells (typically performed the day before the XFp HS Mini assay)
For each density to be tested, seed as directed for adherent cells. View instructions for seeding suspension cells.
Agilent Seahorse XFp HS Mini Assays are performed in an Agilent Seahorse 96-well 24-well 8-well XFp Cell Culture Microplate Cell Culture Miniplatep, XF HS, XFp PDL, or XF HS PDL miniplates in conjunction with an Sensor Cartridge. XFe96 Sensor Cartridge. 8-well sensor cartridge. This procedure describes recommendations for seeding adherent cell types for use with the Agilent Seahorse Analyzer. View instructions for seeding suspension cells.
A method for four different cell densities using an XF96 cell culture plate, XFe96 cartridge and the Seahorse XF Real-Time ATP rate assay kit with an instrument is recommended for an initial assay.
A method for testing four different cell densities and four different FCCP concentrations using two cell culture plates, two cartridges and the XF Cell Energy Phenotype Test Kit with an instrument is recommended for initial assays.
A method for testing four different cell densities using an XF24 Cell Culture Microplate, XFe24 sensor cartridge and the Seahorse XF Real-Time ATP rate assay kit with an instrument is recommended for initial assays.
A method for testing 2-4 different cell densities using an XFp Cell Culture Miniplate, XFp8-well sensor cartridge and the Seahorse XF Real-Time ATP rate assay kit with an XFp instrumentXF HS Mini Analyzer are recommended for initial assays.
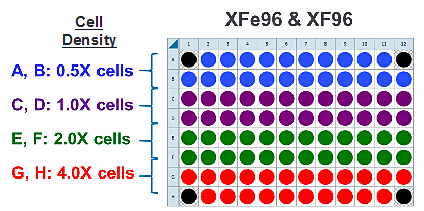
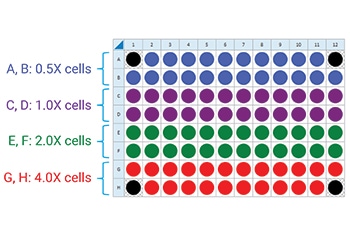
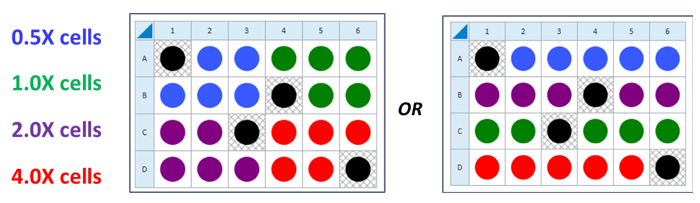
This is a suggested assay plate map for seeding four cell densities:
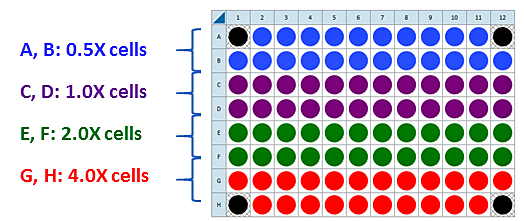
Seeding for Cell Density Titration Assay
This is a suggested assay plate map for seeding four cell densities:
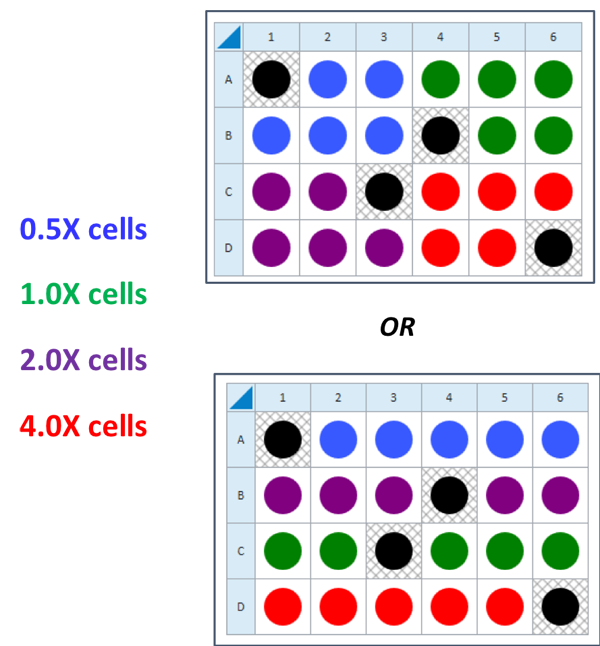
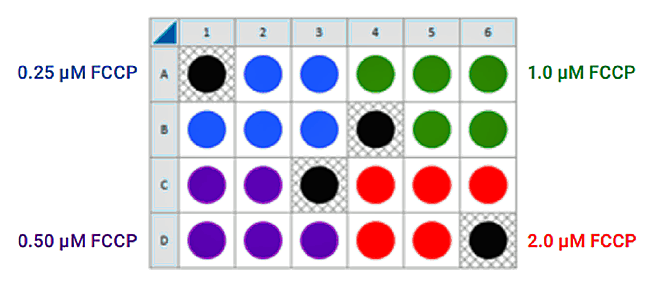
Seeding for FCCP Concentration Titration Assay
If you have already performed the cell seeding density assay and/or know the optimal number of cells per well, the FCCP titration assay may be performed using the optimal cell number (1.0 X cells/well) seeded in all wells except Background Correction wells. Otherwise, follow the same instructions for cell seeding and cartridge hydration/preparation as shown below, and use the following suggested plate layout for testing four concentrations of FCCP:
There are two workflow options: (1) For cells that are NOT limited in number, multiple XFp cell culture miniplates can be seeded at different densities to reduce the time between experiments and complete the characterization workflow more quickly (Accelerated Workflow). (2) For cells limited in number, additional cells are prepared after the results of the first experiment are determined (Standard Workflow). Depending on observed cell density and calculated basal rates more or fewer cells will be required for the next cell number optimization assay.
| Experiment | Rationale | Accelerated Workflow | Standard Workflow |
|---|---|---|---|
| Seed cells at single or different densities and visually assess degree of cell confluence; choose a miniplate for the next step. | To generate metabolic rates within the dynamic range of the instrument, cells should be 50-90% confluent. Visual assessment is a good first approximation of optimal cell density and will be verified in each assay. | Seed 1-2 miniplates at 2-4 different densities according to the diagram below. | Seed 1 miniplate at a single cell density; hydrate 1 XFp cartridge. |
2.4.1 XFp miniplates
- Choose 2-4 cell densities to test, based on standard or accelerated workflow described above. Either cover the range found in the references above, or seed the recommended cells/well value (1X) plus 0.5X, 2X and 4X cells per well.
- Remove a three-pack of miniplates from the blue box.
- Remove the foil seal from the tub(s) that will be used.
- Add sterile water or PBS to the moat around the cell culture wells. Use an 8-channel pipettor set to 200 μL, and fill both sides of the moat (two tips will fit into each chamber). If no multi-channel pipette is available, fill each chamber of the moat with 400 μL of sterile water or PBS (total 3200 μL).
- Add 80 μL of growth medium only (no cells) to wells A and H. These are background correction wells.
- Add 80 μL of growth medium only (no cells) to wells A and H for XFp miniplates. These are background correction wells.
- Harvest and re-suspend the cells to desired final concentration to seed in 80 μL of growth medium. Optimal cell seeding numbers vary widely, though are typically between 5×10³ – 4×10⁴ cells per well and must be determined empirically. (For example, for 1 x 10⁴ cells per well, resuspend cells 1 x 10⁴ per 80 μL = 1.25 x 10⁵ cells per mL)
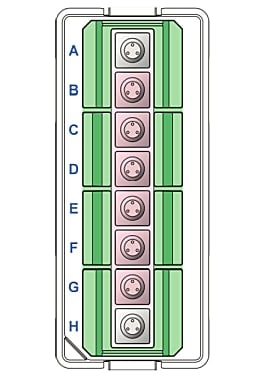
Seahorse XFp miniplate Featuring eight wells and a moat (green) to reduce evaporation
- For cell seeding density optimization experiments, choose 2-4 cell densities to test, based on standard or accelerated workflow described above. Either cover the range found in the references above, or seed the recommended cells/well value (1X) plus 0.5X, 2X and 4X cells per well.
- Remove a three-pack of miniplates from the blue box.
- Remove the foil seal from the tub(s) that will be used.
- Add sterile water or PBS to the moat around the cell culture wells. Use an 8-channel pipettor set to 200 μL, and fill both sides of the moat (two tips will fit into each chamber). If no multi-channel pipette is available, fill each chamber of the moat with 400 μL of sterile water or PBS (total 3200 μL).
- Add 80 μL of growth medium only (no cells) to wells A and H for XFp miniplates. These are background correction wells.
- Harvest and resuspend cells in warm growth medium to the desired concentration. See table for example, if 1 x 10⁴ cells per well is desired for a XFp miniplate, resuspend cells in a volume that results in 1 x 10⁴ cells /80 µL per well or 1.25 x 10⁵ cells/mL.
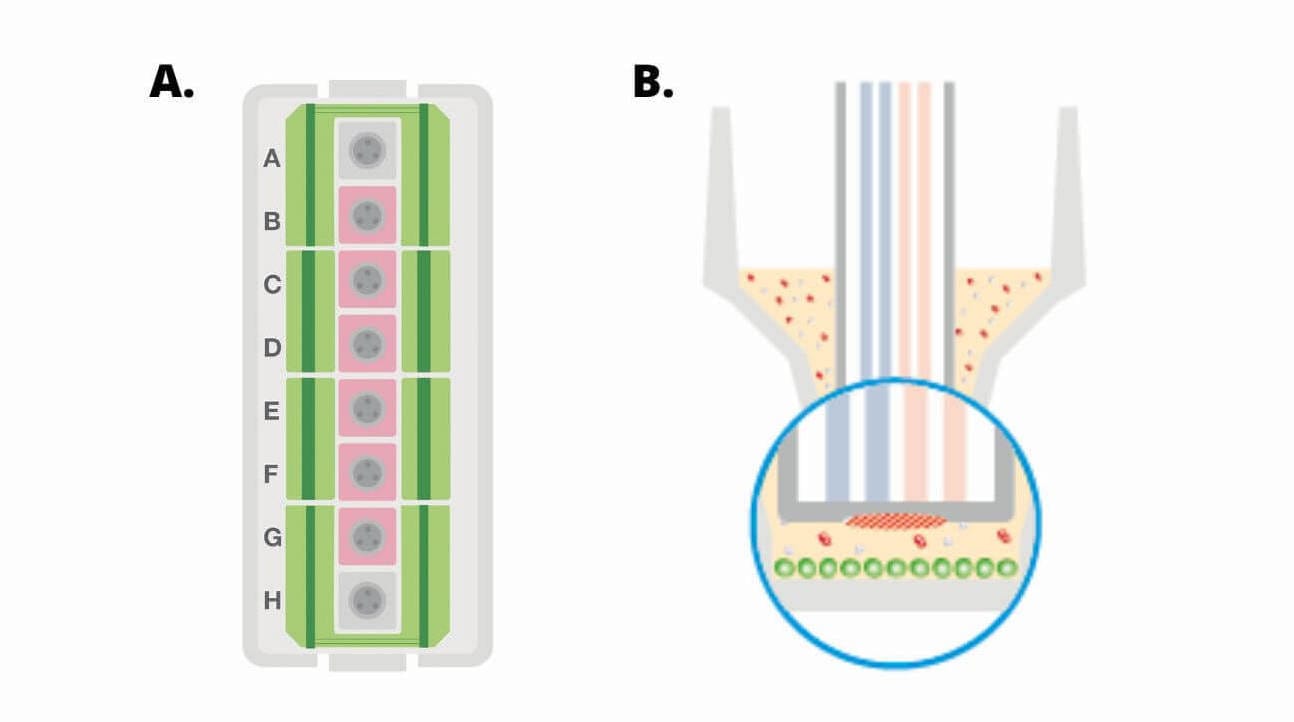
(A) Diagram of a Seahorse XFp miniplate illustrating moat with 8 chambers (green), 6 sample wells (B-G, pink) and background wells (A, H, grey). (B) Cross-section view of XFp miniplate well showing area of cell seeding (green circles).
| Plate type | Final adherent cell seeding volume | Final seeding density (Example only) | Converted to mL |
|---|---|---|---|
| XFp miniplates / XFp PDL miniplates |
80 μL | 1.0 × 10⁴ cells / 80 µL | 1.25 × 10⁵ cells/mL |
Basic procedures for seeding adherent cells (typically performed the day before the XF assay)
- A two-step seeding process is recommended when seeding Agilent Seahorse XF24 Cell Culture Microplates. The two-step process produces a consistent and even monolayer of cells.
- Harvest and re-suspend the cells to desired final concentration to seed in 80 μL of growth medium. Optimal cell seeding numbers vary widely, though are typically between 5 × 10³ – 4 × 10⁴ cells per well and must be determined empirically. (For example, for 1 x 10⁴ cells per well, resuspend cells 1 x 10⁴ per 80 μL = 1.25 x 10⁵ cells per mL)
- Harvest and re-suspend the cells to desired final concentration to seed in 100 μL of growth medium. Optimal cell seeding numbers vary widely, though are typically between 1×10⁴ – 8×10⁴ cells per well and must be determined empirically. (For example, for 2 x 10⁴ cells per well, resuspend cells 2 x 10⁴ per 100 μL = 2.0 x 10⁵ cells per mL)
- Seed 80 μL of cell suspension per well; do not seed cells in background correction wells (A1, A12, H1, H12). Be sure to put medium only (no cells) in the background correction wells.
- Seed 80 μL of cell suspension per well in wells B - G, do not seed cells in background correction wells (A and H). Be sure to put medium only (no cells) in the background correction wells.
- Seed 80 µL of cell suspension per well. Do not add cells to background wells A and H. If bubbles are observed at the bottom of the well, the plates may be centrifuged 1 to 2 minutes at 200 × g to remove them.
- Seed 100 μL of cell suspension per well; do not seed cells in background correction wells (A1, B4, C3, D6). Be sure to put medium only (no cells) in the background correction wells.
- IMPORTANT: Allow plate to rest at room temperature in the tissue culture hood for one hour.1 This can promote even cell distribution and reduce edge effects for some cell types. Monitor adherence using a microscope.
- Place the plate in a standard cell culture incubator to allow cells to adhere. This generally takes approximately 1 hour for strongly adherent cells, but may take 5-6 hours for less adherent cell types. Monitor adherence using a microscope.
- After the one hour rest step, check cells for adherence.
- If cells are well-adhered, dispense an additional 150 μL of cell growth media to each well (250 µL total), then transfer plate to a standard cell culture incubator.
- If cells are not well-adhered to the plate, allow an additional 1-5 hours for the cells to firmly attach (in the biosafety cabinet), then add an additional 150 µL of growth media to each well (250 µL total) and transfer plate to a standard cell culture incubator.
- After cells have adhered, add 150 μl of growth medium to each well, bringing the total volume of medium in the well to 250 μl. When adding medium to the wells, add it slowly to the sides as not to disturb the newly attached cells.
- Allow the cells to grow overnight in a cell culture incubator. Monitor growth and health of cells using a microscope.
2.4.2 XF HS miniplates
- For cell seeding density optimization experiments, choose 2-4 cell densities to test, based on standard or accelerated workflow described above. Either cover the range found in the references above, or seed the recommended cells/well value (1X) plus 0.5X, 2X and 4X cells per well.
- Remove a three-pack of miniplates from the blue box.
- Remove the foil seal from the tub(s) that will be used.
- Add sterile water or PBS to the moat around the cell culture wells. Use an 8-channel pipettor set to 200 μL, and fill both sides of the moat (two tips will fit into each chamber). If no multi-channel pipette is available, fill each chamber of the moat with 400 μL of sterile water or PBS (total 3200 μL).
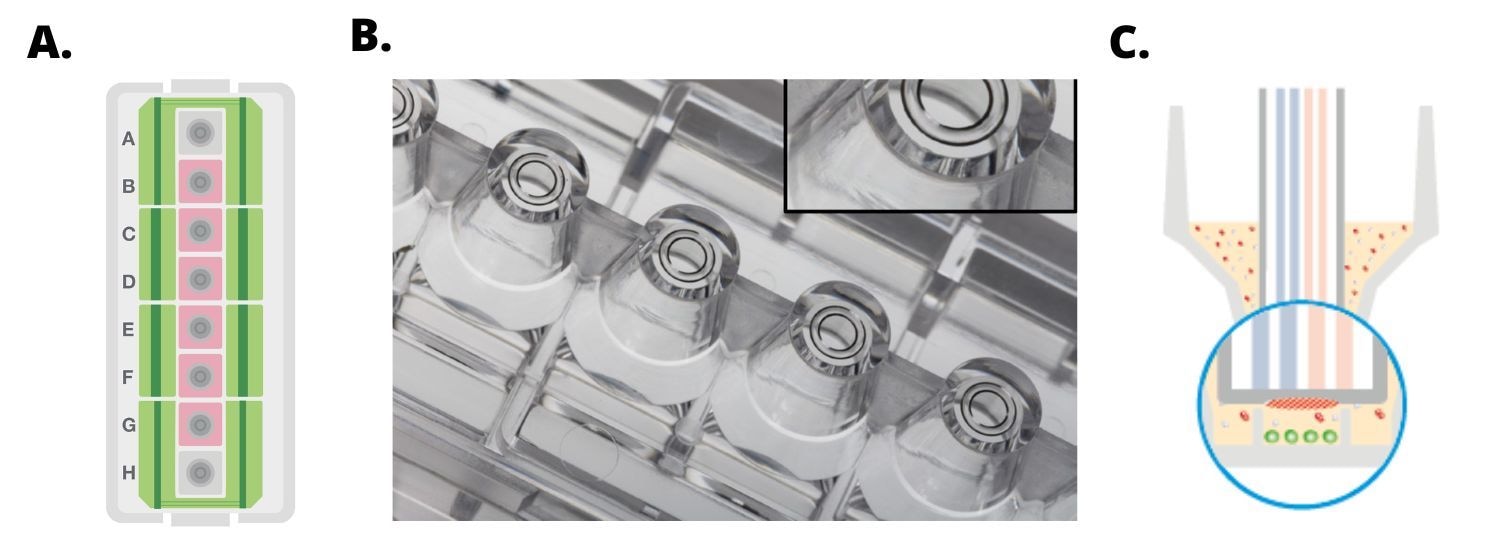
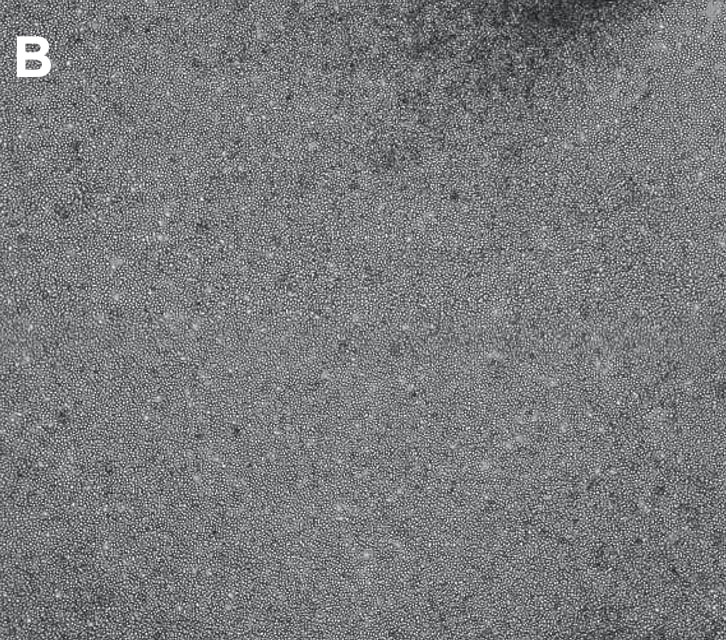
(A) Diagram of a Seahorse XF HS miniplate illustrating moat with 8 chambers (green), 6 sample wells (B-G, pink) and background wells (A, H, grey). (B) The Seahorse XF HS miniplate plates features a “ring” structure at the base of each well, which confines the cells to a smaller surface area, thereby forming a smaller microchamber volume and thus the ability to use fewer cells per well. (C) Cross-section view of HS miniplate well showing ring structure and area of cell seeding (green circles).
- Add 30 μL growth media (no cells) to wells A and H. These are background correction wells.
- Harvest and resuspend cells in warm growth medium to the desired concentration. See table for example, if 3.0 x 10³ cells per well is desired for an XF HS miniplate, resuspend cells in a volume that results in 3.0 x 10³ cells/30 µL per well or 1.0 x 10⁵ cells/mL.
| Plate type | Final adherent cell seeding volume | Final seeding density (Example only) | Converted to mL |
|---|---|---|---|
| XF HS miniplates / XF HS PDL miniplates |
30 μL | 3.0 × 10³ cells / 30 µL | 1.0 × 10⁵ cells/mL |
- Seed 30 µL of cell suspension to the inner ring element of each well. It is recommended to seed cells one well at a time in XF HS miniplates (the pipette tip must be placed at the bottom of the well and the plunger depressed firmly but consistently to dispense the cell suspension properly). Do not add cells to background wells A and H. If bubbles are observed at the bottom of the well, the plates may be centrifuged 1 to 2 minutes at 200 × g to remove them.
- IMPORTANT: Allow plate to rest at room temperature in the tissue culture hood for one hour.1 This can promote even cell distribution and reduce edge effects for some cell types. Monitor adherence using a microscope.
- Allow the cells to grow overnight in a cell culture incubator. Monitor growth and health of cells using a microscope.
2.5 Prepare XFp PDL or XF HS PDL miniplates (suspension cells only)
Analyzing non-adherent cells (e.g. T cells, leukemia cell line, etc.) using XF technology requires immobilizing cells to the bottom of the wells. This is enabled by coating the bottom of each well with poly D-lysine (PDL). Agilent provides ready-to-use PDL-coated XFp and XF HS miniplates. They are validated and recommended for use with T cells. Prewarm the ready-to-use PDL plates in a 37°C non-CO2 incubator overnight prior to use for seeding cells (minimally 6 hours).
Day prior to XF assay
Prepare XFp PDL or HS PDL Miniplates
- Obtain the XFp PDL or XF HS PDL Miniplates and Remove the foil seal(s) from the plate(s) that will be used.
- Place the plates in a non-humidified, non-CO2 37 °C incubator overnight.
Note: The XFp PDL and XF PDL HS Miniplates are compatible with Agilent XFp Miniplate Carrier Trays (part number 103057-100).
Seeding suspension cells is typically performed on the day of your XF assay, view instructions for seeding suspension cells in section 3.2.
Related Support Material
- Seeding Adherent Cells in Agilent Seahorse XF96 Cell Culture Microplates
- Seeding Adherent Cells in Agilent Seahorse XF Pro M Cell Culture Microplates
- Seeding Adherent Cells in Agilent Seahorse XF24 Cell Culture Microplates
- Seeding Adherent Cells in Agilent Seahorse XFp Cell Culture Miniplates
- Seeding Adherent Cells in Agilent Seahorse XF HS Miniplates
- Methods for Reducing Cell Growth Edge Effects in Agilent Seahorse XF Cell Culture Microplates
- Immobilization of Non-Adherent Cells with Cell-Tak for Assay on the Agilent Seahorse XFe/XF96 or XFp Analyzer
- Evaluation of Edge Effects and Evaporation from Agilent Seahorse XF Pro M Cell Culture Plates
- Seeding Suspension Cells in Agilent Seahorse XF HS Miniplates
- Immobilization of Non-Adherent Cells with Cell-Tak for Assay on the Agilent Seahorse XFe/XF24 Analyzer
- Cell Characterization: The XFe96/XF96 Analyzer and the Seahorse XF Real-Time ATP rate assay
- Cell Characterization: The XF24 Analyzer and the Cell Energy Phenotype Test
- Cell Characterization: The XFp Analyzer and the Seahorse XFp Real-Time ATP rate assay
- Cell Characterization: The XF HS Mini Analyzer and the XF Real‐Time ATP Rate Assay
- Cell Characterization: The XF HS Mini Analyzer with the HS Miniplate and the XF Real-Time ATP Rate Assay
Reference Material
- Agilent Seahorse Assay Guides and Templates
- Agilent Seahorse Assay Guides and Templates
- Agilent Seahorse Assay Guides and Templates
- Agilent Seahorse Assay Guides and Templates
- Agilent Seahorse Templates
- Agilent Cell Analysis Publication Database
Browse the full list of publications using Agilent Cell Analysis data.
Showing only information for the Seahorse Seahorse XF Pro
Change instrument type3. Set up your XF Assay
This section focuses on techniques performed the day of your XFp assay, including assay media preparation. Seeding non-adherent cells, and loading XFp Sensor Cartridge ports with solutions for injection.
Select a workflow step to display help content.
3.1 Prepare Cartridge and Assay Medium
3.4 Prepare Cartridge and Load Injection Solutions
3.1 Prepare Assay Medium
3.1 Prepare Cartridge and Assay Medium
Prepare the Cartridge
- Remove the conical tube of calibrant and assembled sensor cartridge with utility plate from the incubator.
- Place the sensor cartridge upside down next to the utility plate.
- Remove and discard the water from the utility plate.
- Fill each well of the utility plate with 200 μL of the pre-warmed XF Calibrant.
- Fill the moats around the outside of the wells with 400 μL of XF Calibrant per chamber.
- Lower the sensor cartridge onto the utility plate, submerging the sensors in calibrant.
- Place assembled sensor cartridge with utility plate in a non-CO2 37° C incubator for 45 – 60 minutes prior to loading the injection ports of the sensor cartridge.
- Remove the assembled sensor cartridge with Hydro Booster and Utility plate from the incubator.
- Place the sensor cartridge upside down next to the utility plate.
- Remove and discard the Hydro Booster.
- Lower the sensor cartridge onto the utility plate, submerging the sensors in calibrant.
- Return the assembled sensor cartridge with utility plate to the non-CO2 37° C incubator until needed for loading the injection ports of the sensor cartridge.
Allow the assembled sensor cartridge with utility plate to incubate in the non-CO2 37° C incubator until needed for loading the injection ports of the sensor cartridge.
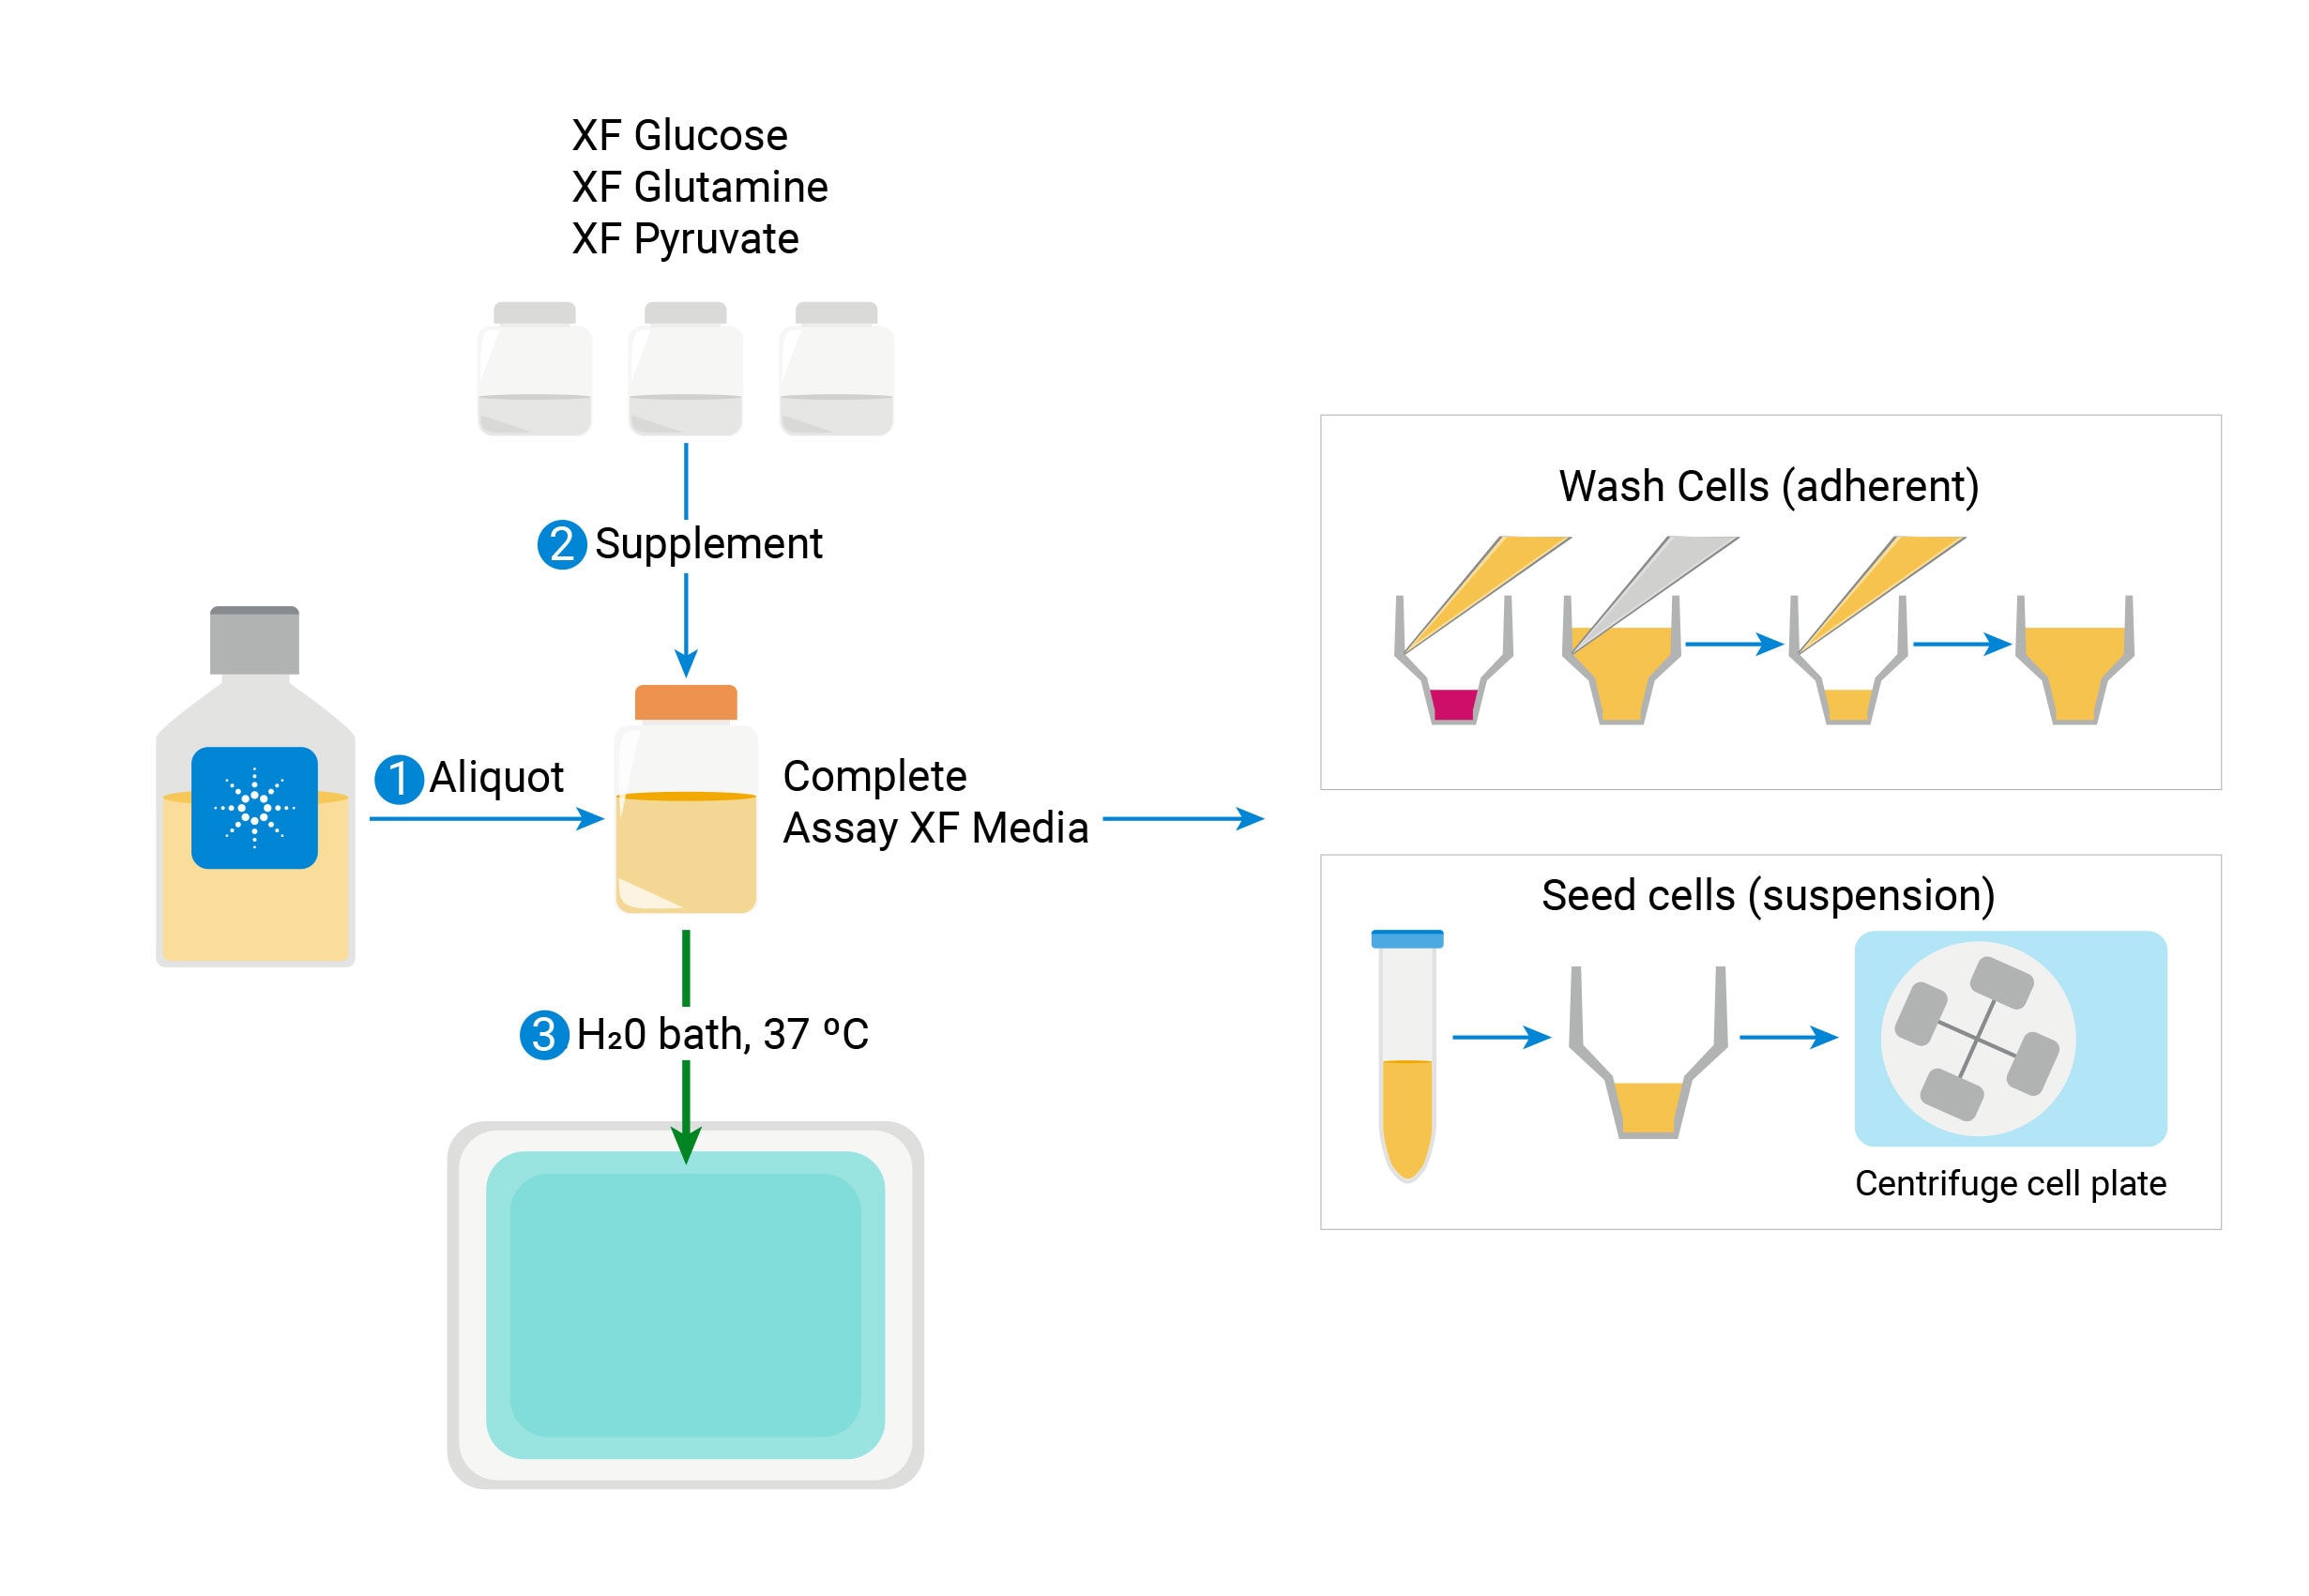
Prepare the XF Assay Medium
Seahorse assays require specific media for accurate, consistent functional measurement of metabolic activity.
Agilent provides ready-to-use, low buffered media, pre-adjusted to pH 7.4, that with compatible supplements, can streamline assay preparation and provide consistent assay conditions. View ordering information on this ready-to-use XF assay Media System or download the media selection guide.
Alternatively, researchers can formulate media with a composition that matches the assay kit being used. All compositions can be prepared using one of the Agilent Seahorse XF Media and adding different substrates/buffer as determined by the specific assay design, the example below is the Seahorse XF Real-Time ATP rate assay Cell Energy Phenotype Test.
Prepare the following XF Assay Medium to use with the Seahorse XF Real-Time ATP rate assay kit.
Prepare the following XF Assay Medium.
Researchers should formulate XF assay media with a composition that matches the assay kit being used. All compositions can be prepared using one of the Agilent Seahorse XF Media and adding different substrates/buffer as determined by the specific assay design, the example below is the Seahorse XF Real-Time ATP rate assay kit Cell Energy Phenotype Test.
Prepare the following XF Assay Medium to use with the Cell Energy Phenotype Test.
| Agilent Reagent / Agilent Part Number | Final Concentration | Volume | |||
|---|---|---|---|---|---|
| Seahorse XF DMEM Medium, pH 7.4a, b / 103575-100 or Seahorse XF RPMI Medium, pH 7.4a, b / 103576-100 |
XF Base Medium (w/out Phenol Red)a, b / 103335-100 or XF RPMI (w/out Phenol Red)a, b / 103336-100 |
Seahorse XF DMEM mediuma,b / 103575-100 or Seahorse XF RPMI mediuma,b / 103576-100 | - | 97.0 mL | 9.70 mL |
| Seahorse XF Glucose (1.0 M solution) / 103577-100 | 10 mM | 10 μL | 10 mM | 1.0 mL | 100 μL |
| Seahorse XF Pyruvate (100 mM solution) / 103578-100 | 1 mM | 1.0 mL | 100 μL | ||
| Seahorse XF L-Glutamine (200 mM solution) / 103579-100 | 2 mM | 1.0 mL | 100 μL | ||
| a XF DMEM and RPMI Medium, pH 7.4 have a pre-adjusted pH value and do not require adjustment of pH upon addition of XF supplements. See method below for preparation.Seahorse XF DMEM Medium pH 7.4 and RPMI Medium, pH 7.4 are not compatible with XF24 Analyzers. b Preparation using alternative types of XF media Preparation using alternative types of XF media Preparation using alternative types of XF media Preparation using alternative types of XF media Preparation using alternative types of XF media. |
|||||
Basic procedures for preparing XF DMEM Medium pH 7.4 or XF RPMI Medium pH 7.4
Basic procedures for preparing XF Base Medium (w/o Phenol Red) or XF RPMI (w/o Phenol Red)
Equipment Required:
- 37°C water bath
- Calibrated pH meter
- Stir plate
- Sterile filter bottles (0.22 μm filter) and cap
- 1.0 N NaOH solution
Agilent Seahorse XF DMEM Medium pH 7.4 and XF RPMI Medium pH 7.4 are designed to provide:
- Convenience: No adjustment of final pH is required when used as recommended with Agilent Seahorse XF Supplements.
- Consistency: Low concentrations of HEPES buffer (5 mM in DMEM; 1 mM in RPMI) provide more consistent XF data.
- Quantitation: Using assay medium with a fixed buffer capacity allows for quantitative measurement of proton efflux rate (PER).
- Warm appropriate volume of XF DMEM Medium pH7.4 or XF RPMI Medium pH 7.4 to 37°C in a sterile bottle. In general, 100 mL is sufficient for one plate.
- Warm an aliquot of XF DMEM Medium pH7.4 or XF RPMI Medium pH 7.4 to 37°C in a sterile bottle. In general, 100 mL is sufficient for one plate.
- Warm appropriate volume of XF Base Medium (w/o Phenol Red) or XF RPMI (w/o Phenol red) to 37°C in a sterile bottle. In general, 100 mL is sufficient for one XF24 plate.
- Add appropriate volumes of Seahorse XF supplements (XF Glucose solution, XF Pyruvate solution and XF L-Glutamine solution) indicated in the table above.
- Add appropriate volumes of Seahorse XF supplements (XF Glucose solution, XF Pyruvate solution and XF L-Glutamine solution) recommended in the table above. If different supplement concentrations are preferred, confirm final pH is 7.4 before proceeding.
- Add appropriate volumes of Seahorse XF supplements (XF Glucose solution, XF Pyruvate solution and XF L-Glutamine solution) recommended in the table above. If different supplement concentrations are preferred, confirm final pH is 7.4 before proceeding.”
- Adjust pH value of the medium to 7.4 using 1 N NaOH. Note: pH value will change quickly upon addition of NaOH, use small volumes and add slowly to adjust pH value.
- Sterilize assay medium with a 0.2 μm filter.
- Incubate the final XF Assay Medium at 37 °C until ready for use
Related Support Material
- Training Webinar: Set up and run your XF Assay
- How to Hydrate an Agilent Seahorse XFe96 Sensor Cartridge
- How to Hydrate an Agilent Seahorse XFe24 Sensor Cartridge
- How to Hydrate an Agilent Seahorse XF24 Sensor Cartridge
- How to Hydrate an Agilent Seahorse XFp Sensor Cartridge
- Preparation of XF Assay Media
- Preparation of XF Assay Media
- Cell Characterization: The XFe96/XF96 Analyzer and the Seahorse XF Real-Time ATP rate assay
- Cell Characterization: The XFp Analyzer and the Seahorse XFp Real-Time ATP rate assay
- Cell Characterization: The XF HS Mini Analyzer and the XF Real‐Time ATP Rate Assay
- Cell Characterization: The XF HS Mini Analyzer with the HS Miniplate and the XF Real-Time ATP Rate Assay
- Cell Characterization: The XF24 Analyzer and the Seahorse XF Real-Time ATP rate assay
- Cell Characterization: The XFe24 Analyzer and the Seahorse XF Real-Time ATP rate assay
Reference Material
- Agilent Seahorse Assay Guides and Templates
- Agilent Seahorse Assay Guides and Templates
- Agilent Seahorse Assay Guides and Templates
- Agilent Seahorse Assay Guides and Templates
- Agilent Seahorse Templates
- Agilent Cell Analysis Publication Database
Browse the full list of publications using Agilent Cell Analysis data.
3.2 Wash Cells
Basic procedure for washing adherent cells seeded on XFp miniplates
Note: For washing adherent cells in XF HS miniplates or XF HS PDL miniplates, please follow the instructions found in the Related Support Material below.
For adherent cells seeded at least one day prior to the XFp HS Mini assay:
- Retrieve the cell culture miniplate from the CO2 incubator.
- View the cells under the microscope to:
- Confirm cell health, morphology, seeding uniformity and purity (no contamination).
- Ensure cells are adhered, with a consistent monolayer.
- Make sure there are no cells in the background correction wells.
- Wash adherent cells with complete assay medium: one time with XF Real-Time ATP Rate Assay Media:
- Remove all but 20 μL of the culture medium from each well. The small amount of medium is left to keep the cells from drying out.
- Gently add 200 μL of assay medium.
- Place the plate in a 37 °C incubator without CO2 for one hour prior to the assay.
- Remove all but 50 μL of the culture medium from each well. The small amount of medium is left to keep the cells from drying out.
- Gently add 1mL of assay medium.
- Place the plate in a 37°C incubator without CO2 for one hour prior to the assay.
- Repeat step b, removing all but 50 μL (as in step a).
- Add 450 μL assay medium (to a total volume of 500 μL) for a 24 well platform instrument.
- Just prior to starting the assay, wash the cells again with XF Real-Time ATP Rate Assay Media: remove all media but 50 μL and add fresh media to a final volume 500 μL. Inspect the cells under the microscope to ensure that cells were not disturbed or washed away.
- Just prior to starting the assay, wash the cells again with XF Real-Time ATP Rate Assay Media: remove all media but 20 μL and add fresh media to a final volume 180 μL. Inspect the cells under the microscope to ensure that cells were not disturbed or washed away.
- Observe the assay wells under the microscope to ensure that cells were not washed away.
- Place the plate in a 37° C incubator without CO2 for one hour prior to the assay.
3.2 Seeding Suspension Cells
Basic procedures for seeding suspension cells on XF HS PDL miniplates and XFp PDL miniplates
Note: For additional information on seeding suspension cells in XF HS PDL miniplates, please follow the instructions found in the Related Support Material below.
The optimal cell density for suspension cells varies depending on the cell size. In general, optimal cell seeding density should result in cell distribution in the well as a monolayer at 70-90% confluency. It is strongly encouraged to examine cell distribution under a microscope to look for (1) adequate space between cells to ensure all cells contact the coated surface evenly and (2) ensure minimal cell clusters. Seeding an excess number of cells above the optimal density or if the cells cluster together can result in poor cell adhesion and cause inaccurate rate measurements.
- Cell Culture Microplate, transfer an appropriate volume of cell suspension from the growth vessel to a conical tube.
- For one XFp Miniplate, XF HS Miniplate or XF HS PDL Miniplate, transfer an appropriate volume of cell suspension from the growth vessel to a conical tube.
- To calculate the total number of cells needed, multiply the desired number of cells per well times 100 wells for the Seahorse XFe96. (For example, 150,000 cells per well × 100 wells = 1.5 × 10⁷ cells).
- To calculate the total number of cells needed, multiply the desired number of cells per well times 10 wells for the Seahorse . (For example, 150,000 cells per well × 10 wells = 1.5 × 10⁶ cells).
- Centrifuge cells at room temperature at 200 × g for 5 minutes.
- While cells are being centrifuged, pipette 50 μL assay medium into background/control wells of the prewarmed PDL-coated Seahorse XF96 Cell Culture Microplates or Cell-Tak-coated Seahorse XF96 Cell Culture Plate.
- While cells are being centrifuged, pipette 50 μL assay medium into background/correction wells (A and H) of the prewarmed PDL-coated Seahorse XFp Cell Culture Microplates or Cell-Tak-coated Seahorse XFp Cell Culture Plate.
- Remove supernatant from the centrifuged conical tube.
- Resuspend cells in warmed assay medium to the desired concentration of cells per well in 50 μL of assay medium. (For example, 1.5 × 10⁵ cells per well is desired, resuspend cells in a volume that results in 1.5 × 10⁵ cell/50 μL or 3.0 × 10⁶ cells/mL).
- Change centrifuge settings to zero braking.
- Transfer the cell suspension to a sterile tissue culture reservoir, or pipette from the conical tube.
- Pipette 50 μL of the cell suspension along the side of each well, except for background/control wells. It is recommended to use a multichannel pipette.
- Place the miniplate(s) in an XFp carrier tray and centrifuge at 300 x g for 1 min with no brake. The carriers are designed to hold up to 3 miniplates, and fit standard centrifuge microplate adapters. Ensure that the centrifuge rotor is balanced appropriately.
- After centrifugation, visually confirm adherence of the cells to the well bottom.
- Centrifuge the cells at 200 × g (zero braking) for 1 minute. Ensure that the centrifuge is properly balanced.
- Taking care not to disturb the cells on the bottom, gently add 130 μL assay medium to each well to the desired initial assay volume (for 180 μL starting assay volume).
- Add sterile water or PBS to the moat around the cell culture wells, 100 μL per chamber. Using an 8-channel pipettor (if available) set to 50 μL, fill both sides of the moat using two tips per chamber. If no multi-channel pipette is available, individually fill each chamber of the moat with 100 μL of sterile water or PBS (total 800 μL).
- Transfer plates to a 37° C incubator not supplemented with CO2 for 25–30 minutes to ensure that the cells have completely attached. Visually confirm that most of the cells are stably adhered to the culture surface.
- Slowly and gently, add 130 μL warm assay medium along the side of each well. Take care to avoid disturbing the cells.
- Observe the cells under the microscope to check that cells are not detached.
- Return the cell plate to the incubator for 15–25 minutes.
- After 15–25 minutes, the cell plates are ready for your assay. Total time following centrifugation should be no greater than 1 hour for best results.
- Calculate the total number of cells needed to run the XF assay (desired number of cells per well multiplied by the number of wells to be seeded). For example, 100,000 cells per well × 6 wells = 6.0 × 10⁵cells.
- Note: It is recommended to allow at least 50% extra cells to account for the potential loss of cells during centrifugation and other steps.
- Transfer the appropriate volume of cell suspension from the culture vessel to a conical tube.
- Centrifuge cells at room temperature at 200 × g for 10 minutes.
- Calculate the volume required to resuspend the cell pellet. Using a volume 20% smaller than the calculated volume to avoid overdiluting the sample is recommended.
- Remove the supernatant from the centrifuged conical tube.
- Resuspend cells in the calculated volume of warm assay medium.
- Perform cell counting again to confirm cell density is in the desired range. Adjust the volume to achieve the desired cell density if needed.
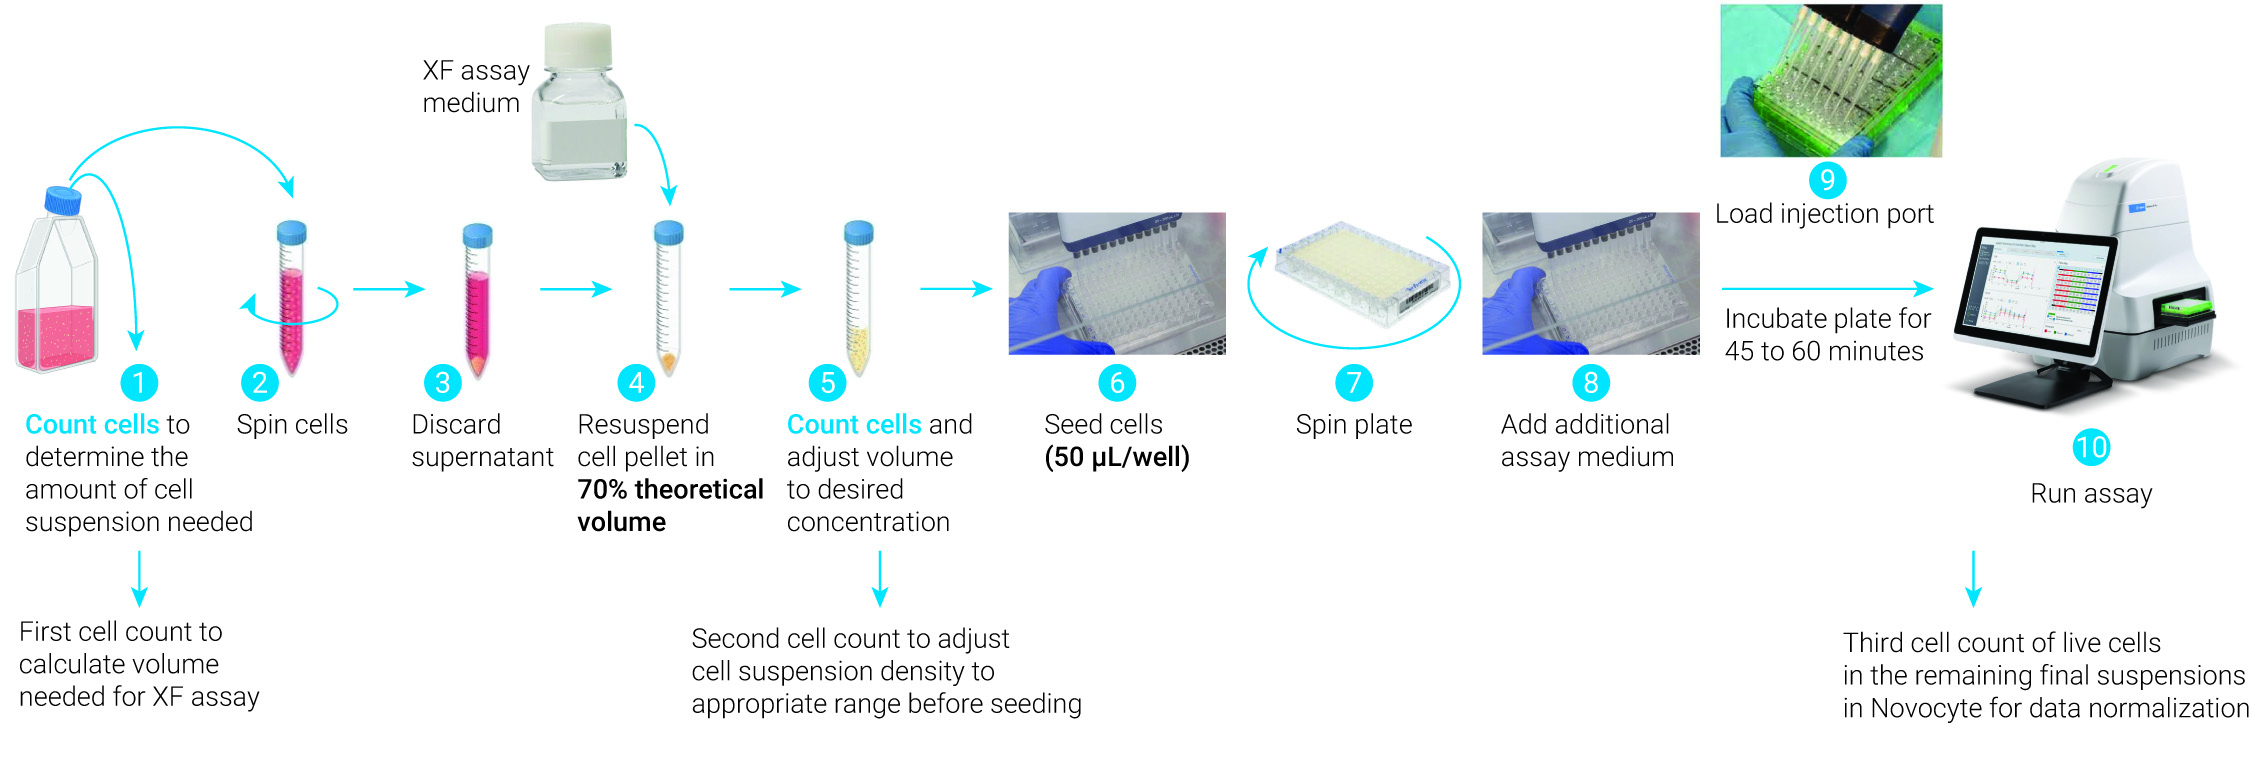
- Pipette 50 µL/well of the final cell suspension in pre-warmed XF 96-well PDL cell culture plate.
- Centrifuge the PDL microplate gently (e.g., 200 × g for 1 to 2 minutes) to allow cells to attach to the bottom of the wells.
- Gently add warm XF assay medium to achieve the optimal total starting volume, which varies for different assay types (typically 175 to 200 µL).
- Incubate the microplate at 37 °C in a non-CO2 incubator for 45 minutes before the assay.
- For one Seahorse XF24 Cell Culture Microplate, transfer an appropriate volume of cell suspension from the growth vessel to a conical tube.
- To calculate the total number of cells needed, multiply the desired number of cells per well times 25 wells for the Seahorse XF24. (For example, 150,000 cells per well × 25 wells = 3.75 × 10⁶ cells).
- Centrifuge cells at room temperature at 200 × g for 5 minutes.
- While cells are being centrifuged, pipette 100 μL assay medium into background/control wells of the room-temperature Cell-Tak-coated Seahorse XF24 Cell Culture Plate.
- Remove supernatant from the centrifuged conical tube.
- Resuspend cells in warmed assay medium to the desired concentration of cells per well in 100 uL of assay medium. (For example, 1.5 × 10⁵ cells per well is desired, resuspend cells in a volume that results in 1.5 × 10⁵ cell/100 μL or 1.5 × 10⁶ cells/mL).
- Change centrifuge settings to zero braking.
- Transfer the cell suspension to a sterile tissue culture reservoir, or pipette from the conical tube.
- Pipette 100 μL of the cell suspension along the side of each well, except for background/control wells. Agilent recommends using a multichannel pipette.
- Centrifuge the cells at 200 × g (zero braking) for 1 minute. Ensure that the centrifuge is properly balanced. For XFp Analyzer users, Agilent recommends using the Agilent Seahorse XFp Carrier Tray to centrifuge the Seahorse XFp Cell Culture Miniplates. For more details, refer to the Basic Procedure: Seeding Suspension Cells in XFp Cell Culture Miniplates.
- Transfer plates to a 37° C incubator not supplemented with CO2 for 25–30 minutes to ensure that the cells have completely attached. Visually confirm that most of the cells are stably adhered to the culture surface.
- Slowly and gently, add 400 μL warm assay medium along the side of each well. Take care to avoid disturbing the cells.
- Observe the cells under the microscope to check that cells are not detached.
- Return the cell plate to the incubator for 15–25 minutes.
- After 15–25 minutes, the cell plates are ready for your assay. Total time following centrifugation should be no greater than 1 hour for best results.
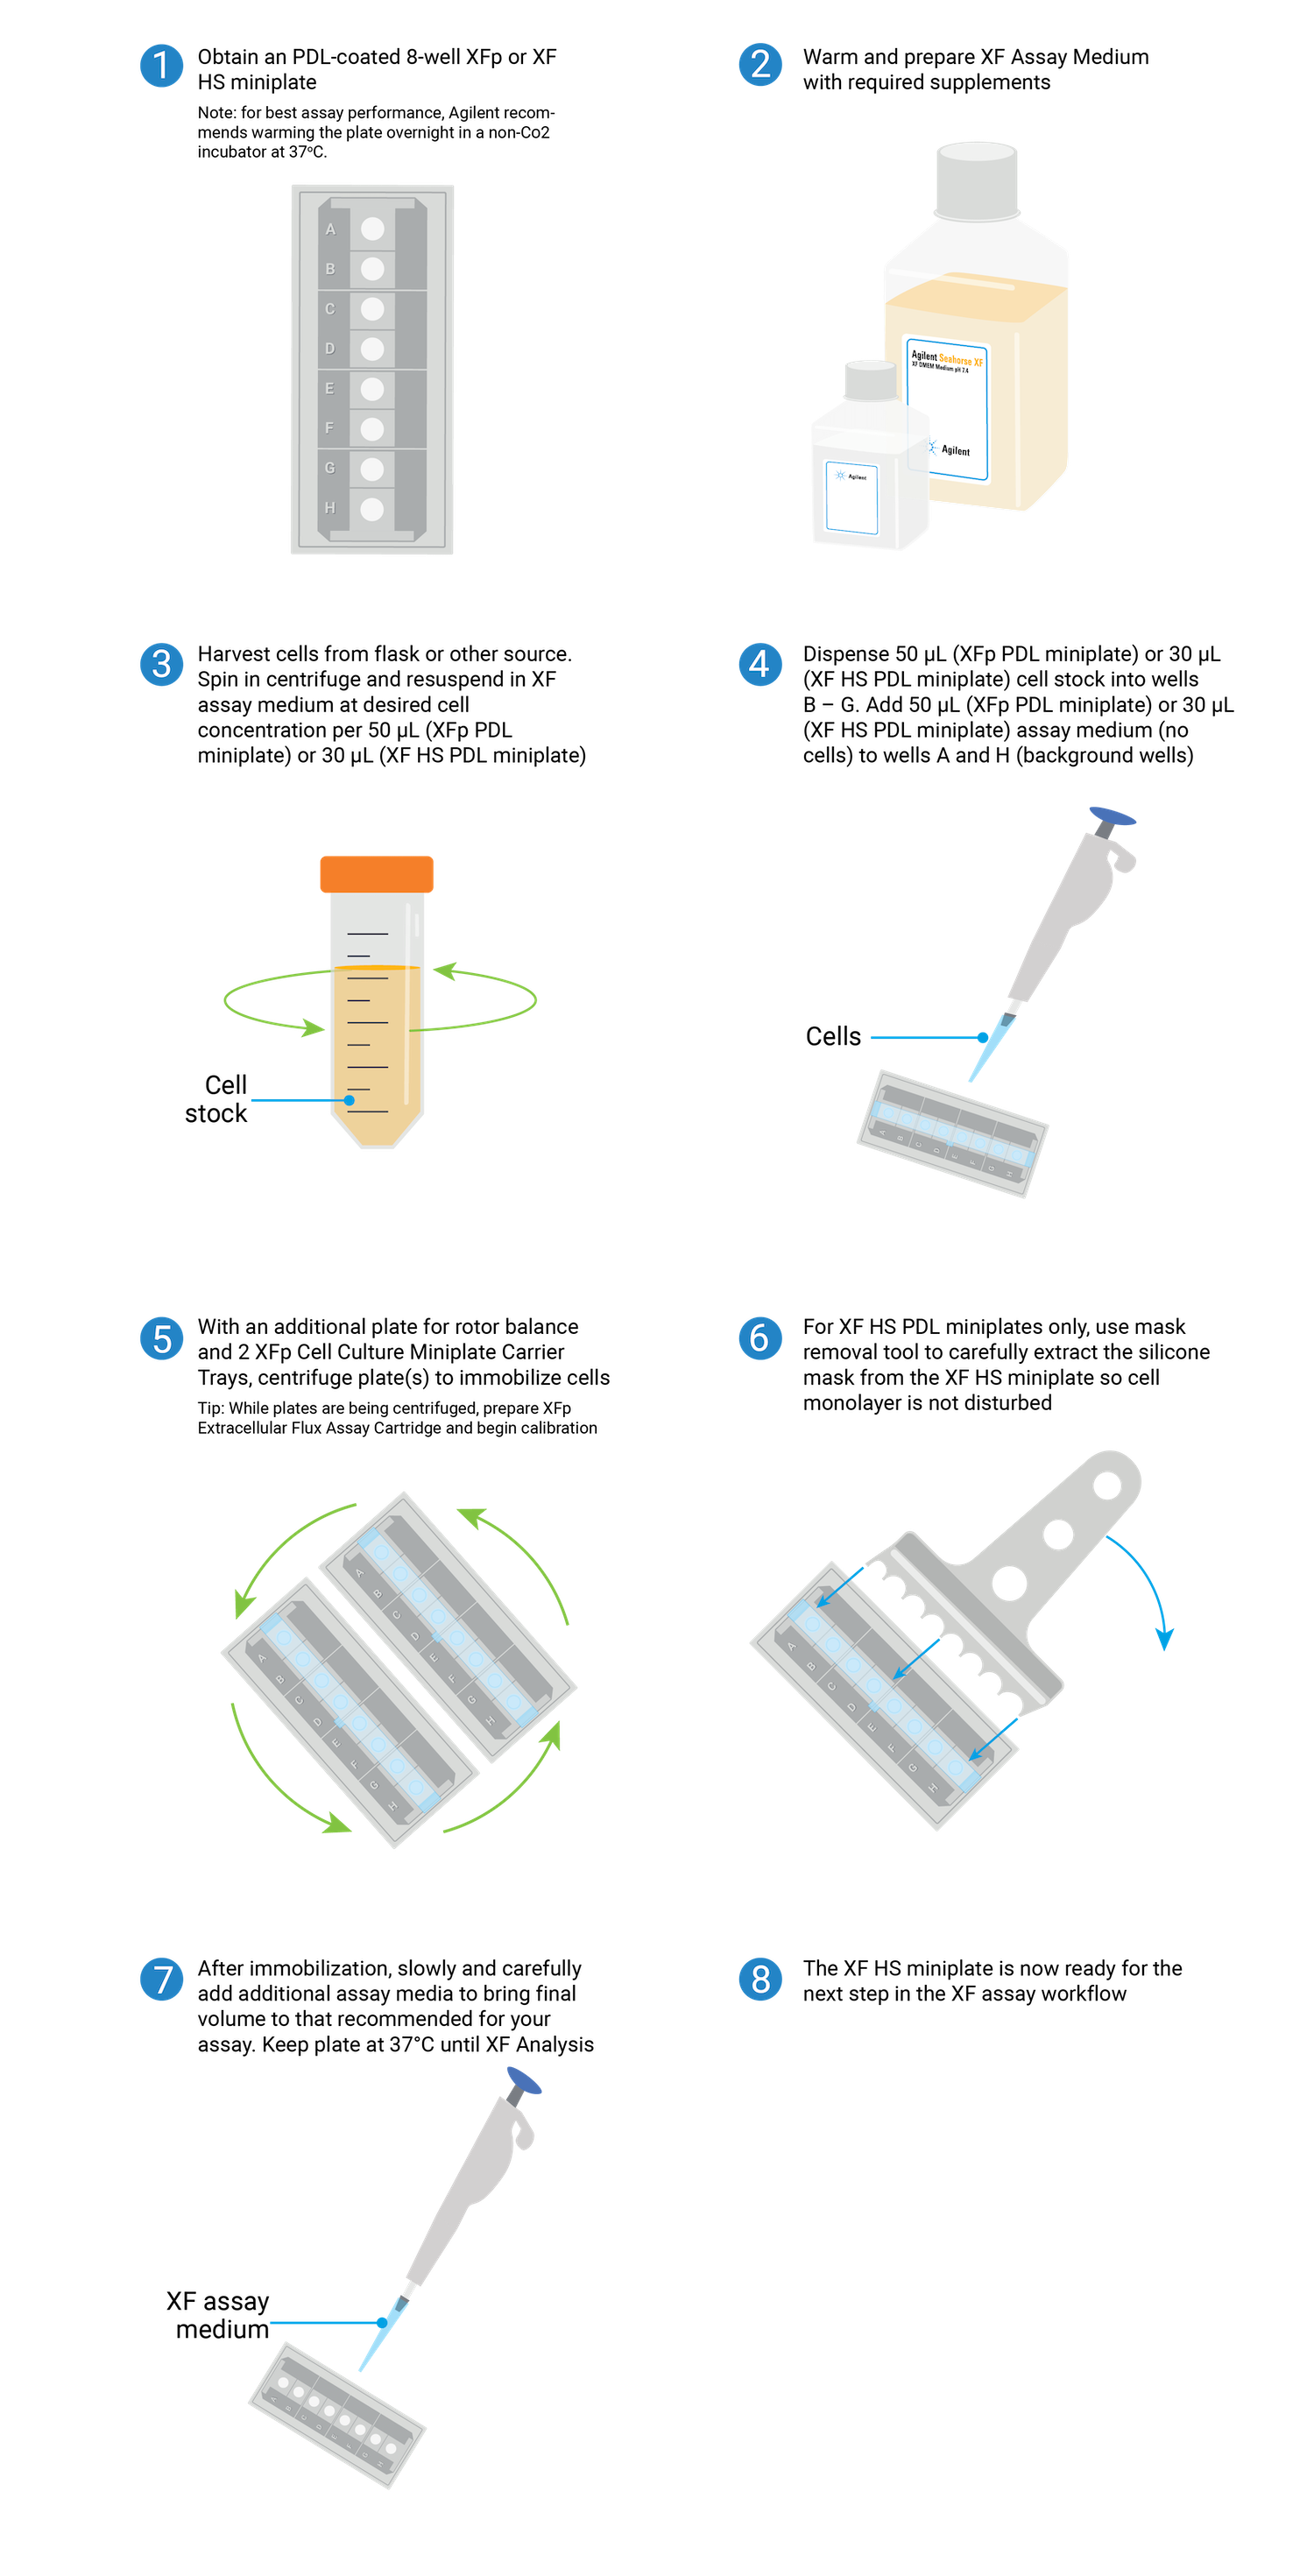
Overview of the steps required for seeding suspension cells on XFp PDL or XF HS PDL miniplates.
Related Support Material
- Washing Adherent Cells in Agilent Seahorse XFp Cell Culture Miniplates
- Washing Adherent Cells in Agilent Seahorse XF96 Cell Culture Microplates
- Washing Adherent Cells in Agilent Seahorse XF24 Cell Culture Microplates
- Washing Adherent Cells in Agilent Seahorse XF96 Cell Culture Microplates
- Using the Agilent NovoCyte Flow Cytometer for Immune Suspension Cell Normalization in Agilent Seahorse XF Assays
- Washing Adherent Cells in Agilent Seahorse XF24 Cell Culture Microplates
- Immobilization of Non-Adherent Cells with Cell-Tak for Assay on the Agilent Seahorse XFe96/XF96 or XFp Analyzer
- Immobilization of Non-Adherent Cells with Cell-Tak for Assay on the Agilent Seahorse XFe24/XF24 Analyzer
- Seeding Suspension Cells in Agilent Seahorse XF HS Miniplates
- Seeding Suspension Cells in Agilent Seahorse XFp Cell Culture Miniplates
- Cell Characterization: The XFe96/XF96 Analyzer and the Seahorse XF Real-Time ATP rate assay
- Cell Characterization: The XF24 Analyzer and the Cell Energy Phenotype Test
- Cell Characterization: The XFe24 Analyzer and the Seahorse XF Real-Time ATP rate assay
- Cell Characterization: The XFp Analyzer and the Seahorse XF Real-Time ATP rate assay
- Cell Characterization: The XF HS Mini Analyzer and the XF Real‐Time ATP Rate Assay
- Cell Characterization: The XF HS Mini Analyzer with the HS Miniplate and the XF Real-Time ATP Rate Assay
Reference Material
- Agilent Seahorse Assay Guides and Templates
- Agilent Seahorse Assay Guides and Templates
- Agilent Seahorse Assay Guides and Templates
- Agilent Seahorse Assay Guides and Templates
- Agilent Seahorse Templates
- Agilent Cell Analysis Publication Database
Browse the full list of publications using Agilent Cell Analysis data.
3.2.1 XFp PDL miniplates
- Obtain XFp PDL miniplate from the nonhumidified, non-CO2 37 °C incubator.
- Add sterile water or PBS to the moat around the cell culture wells, 400 μL per chamber. Using an eight-channel pipettor (if available) set to 200 μL, fill both sides of the moat using two tips per chamber. If no multichannel pipette is available, individually fill each chamber of the moat with 400 μL of sterile water or PBS (total 3200 μL).
- Determine the desired seeding concentration. Optimal cell density for suspension cells varies depending on the cell size. For XFp PDL miniplates seeding numbers are typically between 5 × 10⁴ and 2 × 10⁵ cells/well.
- Calculate the total number of cells needed by multiplying the desired number of cells per well by 10 wells for each miniplate. (For example, 150,000 cells per well × 10 wells = 1.5 × 10⁶ cells). Then transfer an appropriate volume of cell suspension from the growth vessel to a conical tube.
- Centrifuge cells at room temperature at 200 × g for 5 minutes. Then remove supernatant from the centrifuged conical tube and resuspend cells in warm assay medium to the desired concentration. For example, if 1.5 x 10⁵ cells per well is desired, resuspend cells in a volume that results in 1.5 x 10⁵ cells /50 µL per well or 1.0 x 10⁶ cells/mL.
- Pipette 50 µL assay medium to background wells (A and H).
- Change centrifuge settings to zero braking.
- Transfer the cell suspension to a sterile tissue culture reservoir, or pipette from the conical tube.
- Pipette 50 μL of the cell suspension along the side of each well, except for background/control wells (A and H). It is recommended to use a multichannel pipette.
- Upon adding cells or media to the plate, it is possible that bubbles may form at the bottom of the well. These bubbles will likely be removed upon centrifugation.
- Place the miniplate(s) in an XFp carrier tray and centrifuge at 200 x g for 1 min to allow cells to attach to the bottom of the wells. The carriers are designed to hold up to three miniplates and fit standard centrifuge microplate adapters. Ensure that the centrifuge rotor is balanced appropriately.
- After centrifugation, visually confirm adherence of the cells to the well bottom.
- Gently add 130 µL assay medium to each well to the desired initial assay volume (for 180 μL starting assay volume).
- Transfer plates to a 37 °C, non-CO2 incubator for 45–60 minutes before use. Visually confirm that most of the cells are stably adhered to the culture surface.
- The total time following centrifugation should be no greater than 1 hour for best results.
- Go to section 3.4
3.2.2 XF HS PDL miniplates
- Obtain XF HS PDL miniplate from the nonhumidified, non-CO2 37 °C incubator.
- Add sterile water or PBS to the moat around the cell culture wells, 400 μL per chamber. Using an eight-channel pipettor (if available) set to 200 μL, fill both sides of the moat using two tips per chamber. If no multichannel pipette is available, individually fill each chamber of the moat with 400 μL of sterile water or PBS (total 3200 μL).
- Determine the desired seeding concentration. Optimal cell density for suspension cells varies depending on the cell size. For XF HS PDL miniplates, seeding numbers are typically between 2.0 × 10⁴ and 7.0 × 10⁴ cells per well.
- Calculate the total number of cells needed by multiplying the desired number of cells per well by 10 wells for each miniplate. (For example, 150,000 cells per well × 10 wells = 1.5 × 10⁶ cells). Then transfer an appropriate volume of cell suspension from the growth vessel to a conical tube.
- Centrifuge cells at room temperature at 200 × g for 5 minutes. Then remove supernatant from the centrifuged conical tube and resuspend cells in warm assay medium to the desired concentration. For example, if 3 x 10⁴ cells/well is desired, resuspend cells in a volume that results in 3 x 10⁴ cells /30 µL per well or 1.0 x 10⁶ cells/mL.
- Pipette 30 µL assay medium to background wells (A and H).
- Change centrifuge settings to zero braking.
- Transfer the cell suspension to a sterile tissue culture reservoir, or pipette from the conical tube.
- Pipet 30 µL of cell suspension to the inner ring element of each well. It is recommended to seed cells one well at a time using 200 μL (or smaller) pipette tips. The pipette tip must be placed at the bottom of the well to dispense properly. Do not add cells to background wells A and H.
- Upon adding cells or media to the plate, it is possible that bubbles may form at the bottom of the well. These bubbles will likely be removed upon centrifugation.
- Place the miniplate(s) in an XFp carrier tray and centrifuge at 200 x g for 1 min to allow cells to attach to the bottom of the wells. The carriers are designed to hold up to three miniplates and fit standard centrifuge microplate adapters. Ensure that the centrifuge rotor is balanced appropriately.
- After centrifugation, visually confirm adherence of the cells to the well bottom.
- Carefully remove the silicon mask using the mask removal tool, as follows:
- With one hand, hold the plate flat on the bench or working surface. With the other hand, insert the tool between the top of the plate and the mask.
- The prongs of the removal tool should remain parallel to the top surface of the plate while they’re being inserted.
- Do not lever them back and forth to insert the tool further – this will create suction and potentially disturb the cell layer.
- The goal is to remove the mask in one motion from all wells at the same time.
- Once the tool has been inserted completely, use it as a lever to remove the mask.
- The mask will not stay on the prongs – once the mask begins to separate from the plate, use a finger to hold it onto the tool so it does not fall onto the plate.
- Once removed, dispose of the plate mask.
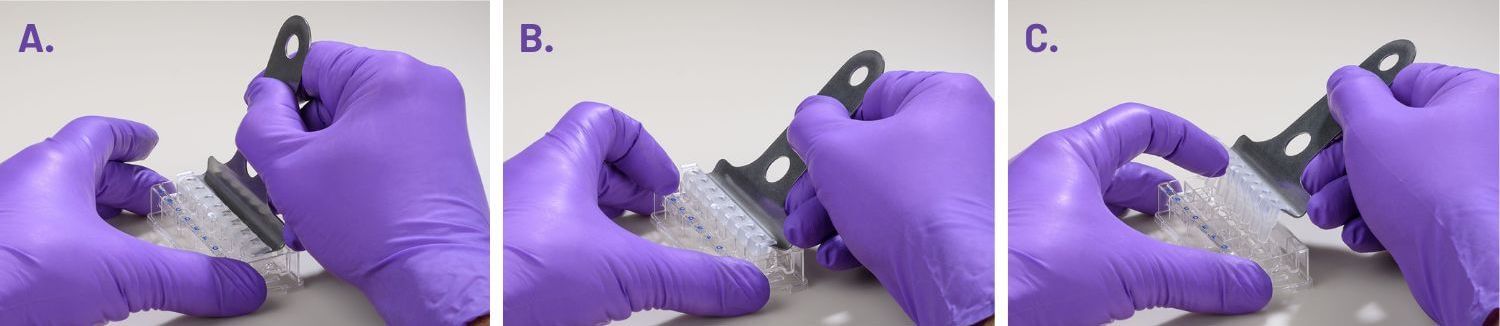
(A) insert the prongs of the removal tool between each well, keeping the bottom of the tool parallel to the top of the plate.
(B) once the prongs are inserted, lever the mask from the wells of the plate.
(C) Hold the mask onto the removal tool with one finger as its being lifted from the plate to prevent it from falling.
Note: Media may be removed with the removal of the silicone mask. Approximately 20 μL of medium will be left in each well. If inconsistent volumes remain, carefully remove media only from the outer-ring area of the well, taking care not to touch the cells within the ring. Always leave some media to cover the cells. Small differences in the overall volume of each well will not impact OCR or ECAR, however the final concentration of injected reagents may be affected.
- Gently add 160 μL assay medium to each well to the desired initial assay volume (for 180 μL starting assay volume).
- Transfer plates to a 37 °C non-CO2 incubator for 45–60 minutes before use. Visually confirm that most of the cells are stably adhered to the culture surface.
- The total time following centrifugation should be no greater than 1 hour for best results.
- Go to section 3.4
3.3 Basic procedure for washing adherent cells
3.3.1 Washing adherent cells on XFp miniplates
For adherent cells seeded at least one day before the XF HS Mini assay:
- Retrieve the cell culture miniplate from the CO2 incubator.
- View the cells under the microscope to:
- Confirm cell health, morphology, seeding uniformity, and purity (no contamination).
- Ensure that cells are adhered, with a consistent monolayer.
- Make sure that there are no cells in the background correction wells.
- Wash cells with XF assay medium:
- Remove all but 20 μL of the culture medium from each well. The small amount of medium is left to keep the cells from drying out.
- Gently add 200 μL of assay medium.
- Place the plate in a 37 °C incubator without CO2 for one hour prior to the assay.
- Just prior to starting the assay, wash the cells again with XF Real-Time ATP Rate Assay Media: remove all media but 20 μL and add fresh media to a final volume 180 μL. Inspect the cells under the microscope to ensure that cells were not disturbed or washed away.
3.3.2 Washing adherent cells on XF HS miniplates
For adherent cells seeded at least one day before the XF HS Mini assay:
- Retrieve the cell culture miniplate from the CO2 incubator.
- View the cells under the microscope to:
- Confirm cell health, morphology, seeding uniformity, and purity (no contamination).
- Ensure that cells are adhered, with a consistent monolayer
- Make sure that there are no cells in the background correction wells
- Remove the silicone mask using the mask removal tool prior to XF analysis:
- With one hand, hold the plate flat on the bench or working surface. Then, with the other hand, insert the tool between the top of the plate and the mask.
- The prongs of the removal tool should remain parallel to the top surface of the plate while they’re being inserted.
- Do not lever them back and forth to insert the tool further – this will create suction and potentially disturb the cell layer.
- The goal is to remove the mask in one motion from all wells at the same time.
- Once the tool has been inserted completely, use it as a lever to remove the mask.
- The mask will not stay on the prongs – once the mask begins to separate from the plate, use a finger to hold it onto the tool so it does not fall onto the plate.
- Once removed, dispose of the plate mask.
(A) insert the prongs of the removal tool between each well, keeping the bottom of the tool parallel to the top of the plate.
(B) once the prongs are inserted, lever the mask from the wells of the plate.
(C) Hold the mask onto the removal tool with one finger as its being lifted from the plate to prevent it from falling.
Note: Media may be removed with the removal of the silicone mask. Approximately 20 μL of medium will be left in each well. If inconsistent volumes remain, carefully remove media only from the outer-ring area of the well, taking care not to touch the cells within the ring. Always leave some media to cover the cells. Small differences in the overall volume of each well will not impact OCR or ECAR, however the final concentration of injected reagents may be affected.
- Wash cells with XF assay medium:
- Gently add 200 μL of assay medium, then remove all but 20 μL of the assay medium from each well, before repeating the wash process.
- Finally, add assay medium (~160 μL) to reach a starting volume of 180 μL.
- Observe the cell layer after washing to ensure that cells were not disturbed or washed away. Place the washed cell plate in a 37 °C non-CO2 incubator for 60 minutes before performing the assay.
Schematic illustration displaying the steps required for removing the silicone mask step 2 and washing samples in XF HS miniplates with XF assay medium
3.3 Assemble Solutions
3.4 Assemble Solutions
A key feature of the Agilent Seahorse Analyzer is its ability to inject reagents during the assay and see results in real time. This is accomplished by dispensing solutions that have been loaded into injector ports within the cartridge prior to placement in the instrument.
If performing initial cell characterization of cell density and/or FCCP titrations using the Cell Energy Phenotype Assay, prepare injection solution as described in the tables below.
If performing initial cell characterization of cell density using the Seahorse XFp Real-Time ATP rate assay, prepare injection solution as described in the tables below.
If performing initial cell characterization of cell density using the Seahorse XF Real-Time ATP rate assay, prepare injection solution as described in the tables below.
Cell Density Titration Assay Solution Assembly
FCCP Concentration Titration Assay Solution Assembly
- Remove one pouch from the Seahorse Seahorse XF Real-Time ATP rate assay Kit box, and remove both tubes (Oligo and Rotenone + Antimycin A).
- Remove one pouch from the Seahorse XF Cell Energy Phenotype Test Kit box, and remove both tubes (Oligo and FCCP).
- Using a pipette, resuspend the contents of each tube with prepared assay medium using the volumes described in the table below. Place a cap on the tube, and vortex for 1 minute to solubilize the compounds.
| Resuspension volumes for the Seahorse XF Real-Time ATP rate assay Kit | ||||
|---|---|---|---|---|
| Compound | Volume of XF Assay Media | Resulting Stock Concentration | ||
| Oligomycin | 420 µl | 168 µl | 150 µM | 75 µM |
| Rotenone + Antimycin A | 540 µl | 216 µl | 50 µM | 25 µM |
| Resuspension volumes for the XF Cell Energy Phenotype Test Kit | ||
|---|---|---|
| XF Cell Energy Phenotype Test Component | Volume of XF assay media (μL) | Resulting Stock Concentration (μM) |
| Oligomycin | 630 | 100 |
| FCCP | 720 | 100 |
- Prepare 3.0 mL of each injection solution by combining the appropriate volumes of XF Assay Media and stock oligomycin and stock rotenone/antimycin A as described in the table below.
- Using a 15 mL conical tube, prepare 3.0mL of the injection solution by combining the appropriate volumes of XF Assay Media, stock oligomycin and stock FCCP as described in the table below.
- Prepare 300 µL of each injection solution by combining the appropriate volumes of XF Assay Media and stock oligomycin and stock rotenone/antimycin A as described in the table below.
| Dilution volumes for XF Real Time ATP Rate Assay Kit - Cell Characterization | ||||||
|---|---|---|---|---|---|---|
| Port & Compound | Stock Volume | XF Assay Media Volume | 10X [Port] | [Final Well] | ||
| Port A Oligomycin | 300 µl | 60 µl | 2700 µl | 240 µl | 15 µM | 1.5 µM |
| Port B Rotenone + Antimycin A | 300 µl | 60 µl | 2700 µl | 240 µl | 5 µM | 0.5 µM |
| Dilution volumes for the XF Cell Energy Phenotype Test Kit - Cell Seeding Density Titration with XFe24/XF24 | |||||
|---|---|---|---|---|---|
| Final FCCP concentration in well | Volume of assay media (μL) | Volume of Stock Oligomycin (μM) | Volume of Stock FCCP (μL) | 10X Final Oligo (Port) Concentration (μM) | 10X Final FCCP (Port) Concentration (μM) |
| 0.25 | 875 | 100 | 25 | 10 | 2.5 |
| 0.5 | 850 | 100 | 50 | 10 | 5.0 |
| 1.0 | 800 | 100 | 100 | 10 | 10 |
| 2.0 | 700 | 100 | 200 | 10 | 20 |
If performing a different type of XFp HS Mini assay, consult the appropriate XFp HS MiniKit User Guide for appropriate injection solution preparation instructions.
Related Support Material
- Loading the Agilent Seahorse Sensor Cartridge Injection Ports
- Loading the Agilent Seahorse XFe24 Sensor Cartridge Injection Ports
- Loading the Agilent Seahorse XF24 Sensor Cartridge Injection Ports
- Loading the Agilent Seahorse XFp Sensor Cartridge Injection Ports
- Cell Characterization: The XFe96/XF96 Analyzer and the Seahorse XF Real-Time ATP rate assay
- Cell Characterization: The XF24 Analyzer and the Cell Energy Phenotype Test
- Cell Characterization: The XFe24 Analyzer and the Seahorse XF Real-Time ATP rate assay
- Cell Characterization: The XFp Analyzer and the Seahorse XF Real-Time ATP rate assay
- Cell Characterization: The XF HS Mini Analyzer and the XF Real‐Time ATP Rate Assay
- Cell Characterization: The XF HS Mini Analyzer with the HS Miniplate and the XF Real-Time ATP Rate Assay
Reference Material
- Agilent Seahorse Assay Guides and Templates
- Agilent Seahorse Assay Guides and Templates
- Agilent Seahorse Assay Guides and Templates
- Agilent Seahorse Assay Guides and Templates
- Agilent Seahorse Templates
- Agilent Cell Analysis Publication Database
Browse the full list of publications using Agilent Cell Analysis data.
3.4 Load Injection Solutions
3.5 Load Injection Solutions
3.4 Prepare Cartridge and Load Injection Solutions
If performing initial cell characterization (Cell Density Assay) using the Seahorse XF Real-Time ATP rate assay, follow the instructions and table below to load the cartridge injection ports.
If performing initial cell characterization (Cell Density and FCCP Concentration Titration Assay) using the Cell Energy Phenotype Assay, follow the instructions and table below to load the cartridge injection ports.
Note that for these assay designs, only the A and B injection ports will be used.
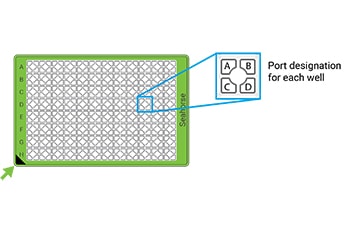
Sensor Cartridge Injection Port Layout
- Remove the hydrated cartridge from the non-CO2 incubator.
- Remove the assembled sensor cartridge with the XF Hydrobooster and utility plate from the incubator.
- Place the sensor cartridge, upside down, next to the utility plate.
- Hold the utility plate steadily with one hand, and use the other hand to remove the XF Hydrobooster by lifting it from one corner.
- Place the sensor cartridge back onto the utility plate. Leave the cartridge lid off.
- Orient the Agilent Seahorse XF Assay Cartridge. Place row labels (lettered A-H) to the left. The triangular notch will be in the bottom left-hand corner.
- Orient the Agilent Seahorse XF Assay Cartridge. Place row labels (lettered A-D) to the left. The triangular notch will be in the bottom left-hand corner.
- Orient the Agilent Seahorse XFp Assay Cartridge. Place well labels (lettered A-H) to the left. The triangular notch will be in the bottom left-hand corner.
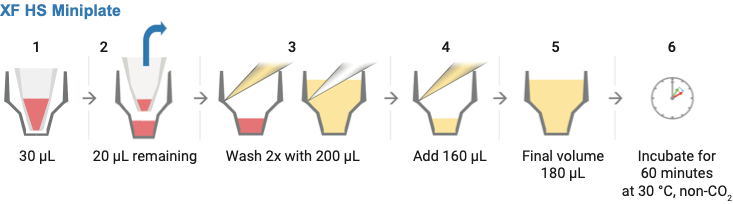
- Using a 100 or 200 μL (multichannel) pipette, make sure the tip(s) are securely fitted onto the pipette. Position the pipette tip(s) (filled with your compounds for injection) into the desired port, and orient the tips at a very slight angle (<5°). Do not force the tips completely into the holes.
- Place the A/D loading guide flat on top of the assay cartridge. Orient the loading guide so the letter 'A' is located in the upper left-hand corner. Use your fingertips to hold the outside edges of the loading guide to stabilize during loading so pipette tips do not dislodge the loading guide.
- Using a 10-100 μL multichannel pipette, make sure the tips are securely fitted onto the pipette. Position the pipette tips (filled with your compounds for injection) into the desired column in the loading guide, and orient the tips at a very slight angle. Insert the tips as far as they will go without resistance into the holes and dispense the compound. Do not force the tips completely into the holes.
- Gently dispense 20 μL of the appropriate injection solution into the ports according to plate/group layouts shown below. Withdraw the tips from the ports carefully stabilizing the loading guide throughout the procedure. Avoid creating air bubbles. Do not tap any portion of the cartridge in an attempt to alleviate air bubbles. This may cause solutions to leak from the injection port.
- Remove the A/D port loading guide, and replace with the B/C port loading guide, with the ‘B’ in the upper left corner. Repeat steps above to load port B, using 22 µl of injection solution.
- Visually inspect the injection ports for even loading. The liquid should be in the port, make sure there are no residual drops on top of the cartridge.

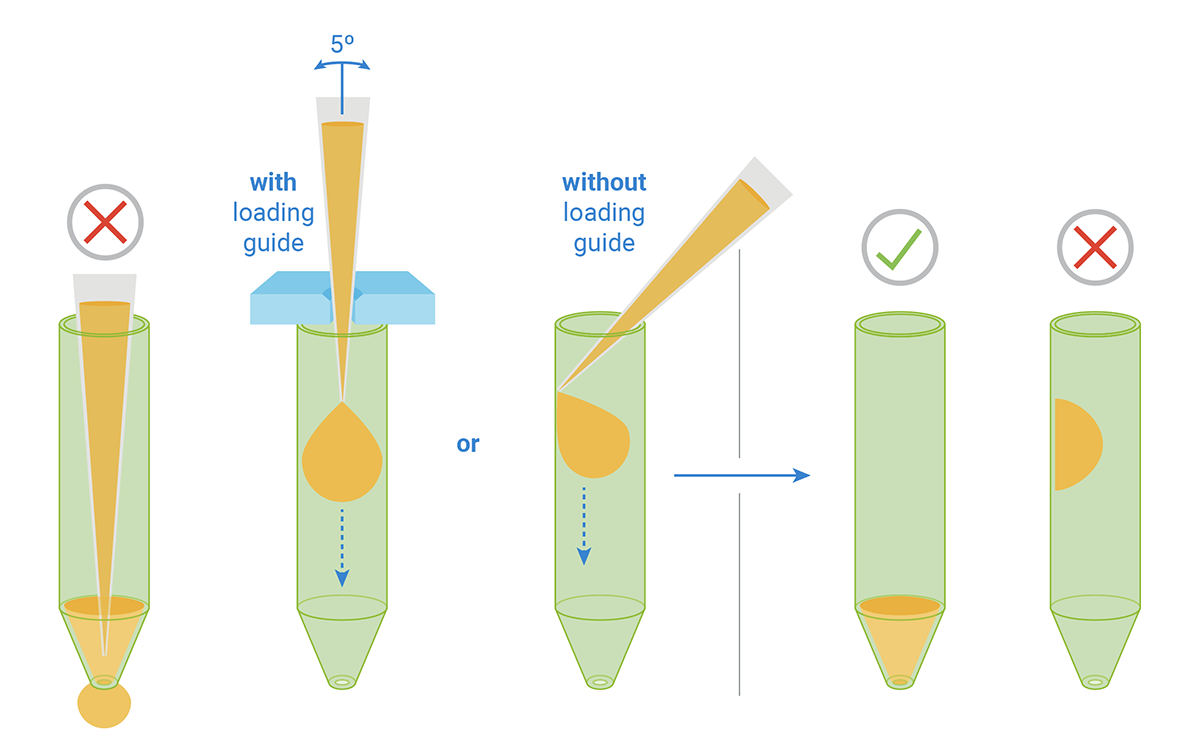

- Place the A/D loading guide flat on top of the assay cartridge. Orient the loading guide so the letter 'A' is located in the upper left-hand corner. Use your fingertips to hold the outside edges of the loading guide to stabilize during loading so pipette tips do not dislodge the loading guide.
- Using a 10-100 μL multichannel pipette, make sure the tips are securely fitted onto the pipette. Position the pipette tips (filled with your compounds for injection) into the desired column in the loading guide, and orient the tips at a very slight angle. Insert the tips as far as they will go without resistance into the holes and dispense the compound. Do not force the tips completely into the holes.
- Hold the tips at a 45° angle. Place the tips halfway into the injection ports with the bevel of the tip against the opposite wall of the injection port.
- Do NOT insert the tips completely to the bottom of the injection ports as this may cause compound leakage through the port.
- Gently dispense 20 μL of the appropriate injection solution into the ports according to plate/group layouts shown below. Withdraw the tips from the ports carefully stabilizing the loading guide throughout the procedure. Avoid creating air bubbles. Do not tap any portion of the cartridge in an attempt to alleviate air bubbles. This may cause solutions to leak from the injection port.
- Gently dispense 55 μL of the appropriate injection solution into the ports according to plate/group layouts shown below, depending on which assay is being performed. Withdraw the tips from the ports carefully. Avoid creating air bubbles, but do not tap any portion of the cartridge in an attempt to alleviate air bubbles. This may cause solutions to leak from the injection port.
- Gently dispense 20 μL of the appropriate injection solution into the ports according to plate/group layout shown below. Withdraw the tip(s) from the ports carefully, stabilizing the cartridge throughout the procedure. Avoid creating air bubbles. Do not tap any portion of the cartridge in an attempt to alleviate air bubbles. This may cause solutions to leak from the injection port.
- Remove the A/D port loading guide, and replace with the B/C port loading guide, with the ‘B’ in the upper left corner. Repeat steps above to load port B, using 22 µl of injection solution.
- Repeat steps above to load port B, using 62 µl of injection solution.
- Repeat steps above to load port B, using 22 µl of injection solution.
- Visually inspect the injection ports for even loading. The liquid should be in the port, make sure there are no residual drops on top of the cartridge.
Injection Port Loading for Cell Density Titration Assay
| Injection Ports and volumes for XF Real Time ATP Rate Assay Kit - Cell Characterization | ||||
|---|---|---|---|---|
| Port & Compound | Volume | 10X [Port] | [Final Well] | |
| Port A Oligomycin | 20 µl | 55 µl | 15 µM | 1.5 µM |
| Port B Rotenone + Antimycin A | 22 µl | 62 µl | 5 µM | 0.5 µM |
| Final concentration in well (μM) | FCCP Group | Wells | Port/Volume (μL) |
|---|---|---|---|
| Oligo / FCCP 1.0 / 1.0 | 1.0 μM | A1-D6 (all) | A / 55 |
Injection Port Loading for FCCP Concentration Titration Assay
If performing a different type of XF assay, consult the appropriate XF Kit User Guide and the instructions below for appropriate loading methods for more than one injection solution.
- Orient the Agilent Seahorse XF Assay Cartridge. Place row labels (lettered A-H) to the left. The triangular notch will be in the bottom left-hand corner.
- Orient the Agilent Seahorse XF Assay Cartridge. Place row labels (lettered A-D) to the left. The triangular notch will be in the bottom left-hand corner.
- Orient the Agilent Seahorse XF Assay Cartridge. Place row labels (lettered A-D) to the left. The triangular notch will be in the bottom left-hand corner.
- Place the A/D loading guide flat on top of the assay cartridge. Orient the loading guide so the letter 'A' is located in the upper left-hand corner. Use your fingertips to hold the outside edges of the loading guide to stabilize during loading so pipette tips do not dislodge the loading guide.
- Using a 10-100μl multichannel pipette, make sure the tips are securely fitted onto the pipette. Position the pipette tips (filled with your compounds for injection) into the desired column in the loading guide, and orient the tips at a very slight angle. Insert the tips as far as they will go without resistance into the holes and dispense the compound. Do not force the tips completely into the holes.
- Using a multichannel pipette, make sure the tips are securely fitted onto the pipette. Position the pipette tips (filled with your compounds for injection) at a 45° angle. Place the tips halfway into the injection ports with the bevel of the tip against the opposite wall of the injection port.
- Do NOT insert the tips completely to the bottom of the injection ports as this may cause compound leakage through the port.
- Dispense the compounds into the ports gently. Withdraw the tips from the ports carefully, stabilizing the loading guide throughout the procedure.
- Dispense the compounds into the ports gently. Withdraw the tips from the ports carefully, stabilizing the loading guide throughout the procedure.
- Avoid creating air bubbles, but do not tap any portion of the cartridge in an attempt to alleviate air bubbles. This may cause compound leakage from the injection port.
- Switch to the B/C loading guide. Orient with the letter 'B' in the upper left-hand corner. Repeat loading procedure outlined in steps 3-5 for 'B', 'C' and 'D' injection ports, using the appropriate loading guides. Remove and discard loading guide(s).
- Repeat loading procedure outlined in steps above for 'B', 'C' and 'D' injection ports.
- Visually inspect the injection ports for even loading. The liquid should be in the port, make sure there are no residual drops on top of the cartridge.
General Information and Guidelines for Injections
- The recommended injection volume is 20-30 μL.
- The recommended injection volume is 50-100 μL.
- Recommended Injection Solution Volumes for 10X dilution upon injection, starting with a microplate well volume of 180 μL assay medium:
- Port A: 20 μL
- Port B: 22 μL
- Port C: 25 μL
- Port D: 28 μL
- Recommended Injection Solution Volumes for 10X dilution upon injection, starting with a microplate well volume of 500 μL assay medium:
- Port A: 55 μL
- Port B: 62 μL
- Port C: 69 μL
- Port D: 75 μL
- The composition, sequence and number of ports utilized will depend on your assay design.
- Automated pipettes are not recommended for cartridge loading, as they may lead to injection solutions leaking through the port orifice.
- If performing a different type of XF assay, consult the appropriate XF Kit User Guide.
- Automated pipettes or gel loading tips are not recommended for cartridge loading.
Related Support Material
- Loading the Agilent Seahorse XFe96 Sensor Cartridge Injection Ports
- Loading the Agilent Seahorse XFe24 Sensor Cartridge Injection Ports
- Loading the Agilent Seahorse XF24 Sensor Cartridge Injection Ports
- Loading the Agilent Seahorse XFp Sensor Cartridge Injection Ports
- Cell Characterization: The XFe96/XF96 Analyzer and the Seahorse XF Real-Time ATP rate assay
- Cell Characterization: The XFe24 Analyzer and the Seahorse XF Real-Time ATP rate assay
- XF24 Cell Characterization: The XF24 Analyzer and the Cell Energy Phenotype Test
- Cell Characterization: The XFp Analyzer and the Seahorse XFp Real-Time ATP rate assay
- Cell Characterization: The XF HS Mini Analyzer and the XF Real‐Time ATP Rate Assay
- Cell Characterization: The XF HS Mini Analyzer with the HS Miniplate and the XF Real-Time ATP Rate Assay
Reference Material
- Agilent Seahorse Assay Guides and Templates
- Agilent Seahorse Assay Guides and Templates
- Agilent Seahorse Assay Guides and Templates
- Agilent Seahorse Assay Guides and Templates
- Agilent Seahorse Templates
- Agilent Cell Analysis Publication Database
Browse the full list of publications using Agilent Cell Analysis data.
Showing only information for the Seahorse Seahorse XF Pro
Change instrument type3. Set up your XF Assay (Day of XF Assay)
This section focuses on techniques performed the day of your XF assay, including assay media preparation and loading XF sensor cartridge ports with solutions for injection.
3.1 Prepare Assay Medium
Prepare the XF Assay Medium
Seahorse XF assays require specific media for accurate, consistent functional measurement of metabolic activity.
Prepare the following XF Assay Medium.
| Agilent Reagent / Agilent Part Number | Final Concentration | Volume |
|---|---|---|
| Seahorse XF DMEM Medium, pH 7.4 / 103575-100 or Seahorse XF RPMI Medium, pH 7.4 / 103576-100 |
- | 97.0mL |
| Seahorse XF Glucose (1.0 M solution) / 103577-100 | 10 mM | 1.0 mL |
| Seahorse XF Pyruvate (100 mM solution) / 103578-100 | 1 mM | 1.0 mL |
| Seahorse XF L-Glutamine (200 mM solution) / 103579-100 | 2 mM | 1.0 mL |
Basic procedures for preparing XF DMEM Medium pH 7.4 or XF RPMI Medium pH 7.4
Agilent Seahorse XF DMEM Medium pH 7.4 and XF RPMI Medium pH 7.4 are designed to provide
- Convenience: No adjustment of final pH is required when used as recommended with Seahorse XF supplements.
- Consistency: Low concentrations of HEPES buffer (5 mM in DMEM; 1 mM in RPMI) provide more consistent XF data.
- Quantitation: Using assay medium with a fixed buffer capacity allows for quantitative measurement of proton efflux rate (PER).
- Warm an aliquot of XF DMEM Medium pH7.4 or XF RPMI Medium pH 7.4 to 37°C in a sterile bottle. In general, 100 mL is sufficient for one plate.
- Add appropriate volumes of Seahorse XF supplements (XF Glucose solution, XF Pyruvate solution, and XF L-Glutamine solution) recommended in the table above. If different supplement concentrations are preferred, confirm final pH is 7.4 before proceeding.
- Incubate the final XF assay medium at 37 °C until ready for use
Related Support Material
Preparation of XF Assay Media3.2 Wash Cells
For adherent cells seeded at least one day prior to the XF assay:
- Retrieve the cell culture plate from the CO2 incubator.
- View the cells under the microscope to:
- Confirm cell health, morphology, seeding uniformity, and purity (no contamination).
- Ensure cells are adhered, with a consistent monolayer.
- Make sure there are no cells in the background correction wells.
- Wash adherent cells with Seahorse XF assay media as follows:
- Remove 200 μL of the culture medium from each well, leaving 50 µL/well. The small amount of medium is left to keep the cells from drying out.
- Gently add and remove 1000 µL of assay medium. Add 1000 µL of assay medium.
- Place the plate in a 37 °C incubator without CO2 for one hour prior to the assay.
- Just before starting the assay, remove 1000 µL assay medium and add 450 µL of fresh media for a final volume of 500 µL. Inspect the cells under the microscope to ensure that cells were not disturbed or washed away.
3.3 Assemble Solutions
A key feature of the Agilent Seahorse XF Analyzer is its ability to inject reagents during the assay and see results in real time. This is accomplished by dispensing solutions that have been loaded into injector ports within the cartridge prior to placement in the instrument.
Preparation of Injection Solutions
| Resuspension volumes for the Seahorse XF Real-Time ATP rate assay Kit | ||||
|---|---|---|---|---|
| Compound | Volume of XF Assay Media | Resulting Stock Concentration | ||
| Oligomycin | 420 µL | 168 µL | 150 µM | 75 µM |
| Rotenone + Antimycin A | 540 µL | 216 µL | 50 µM | 25 µM |
| Dilution volumes for XF Real Time ATP Rate Assay Kit - Cell Characterization | ||||
|---|---|---|---|---|
| Port & Compound | Stock Volume | XF Assay Media Volume | 10X [Port] | [Final Well] |
| Port A Oligomycin | 300 µL | 2700 µL | 15 µM | 1.5 µM |
| Port B Rotenone + Antimycin A | 300 µL | 2700 µL | 5 µM | 0.5 µM |
- Remove one pouch from the Seahorse XF Real-Time ATP Rate Assay kit and remove both tubes (Oligomycin and Rotenone + Antimycin A).
- Using a pipette, resuspend the contents of the Oligomycin tube with 420 µL of XF assay medium. Resuspend the contents of the Rotenone+Antimycin A tube with 540 µL XF assay medium. Place a cap on the tube, and vortex for 1 minute to solubilize the compounds.
- Prepare 3.0 mL of each injection solution by diluting each stock with XF assay media.
3.4 Load Injection Solutions
Here are the general guidelines for proper port loading.
- The recommended injection volume for a 24-well cartridge is between 50 to 100 μL.
- Each series of ports must contain the same volume. For example, all A ports must be filled with the same volume; all B ports must be filled with the same volume, etc.
- All ports with the same label (e.g., A, or B, or C, or D), including background correction or blank wells, must be loaded with injection solution, to ensure proper injection in all wells, even if not all the wells are used in the assay.
- All compounds should be diluted with the appropriate assay medium before being loaded into the sensor cartridge. For further details, consult the appropriate Agilent Seahorse XF Kit/Reagent user guides. NOTE: Serum or BSA containing solutions should not be loaded into the ports.
- The hydrated cartridge must remain in the utility plate and be placed flat on the work surface throughout the loading procedure. Do not lift or angle the plate/cartridge away from the work surface while loading.
- Handle the Agilent Seahorse XFe24/XF Flex cartridge carefully. Hold the base of the utility plate when transporting a cartridge. To minimize the accidental discharge of compounds prior to starting the assay, the best practice is to hydrate the cartridge and load the injection ports adjacent to the Agilent Seahorse XF Analyzer.
| Injection Ports and volumes for XF Real Time ATP Rate Assay Kit | |||
|---|---|---|---|
| Port & Compound | Volume | 10X [Port] | [Final Well] |
| Port A Oligomycin | 55 µL | 15 µM | 1.5 µM |
| Port B Rotenone + Antimycin A | 62 µL | 5 µM | 0.5 µM |
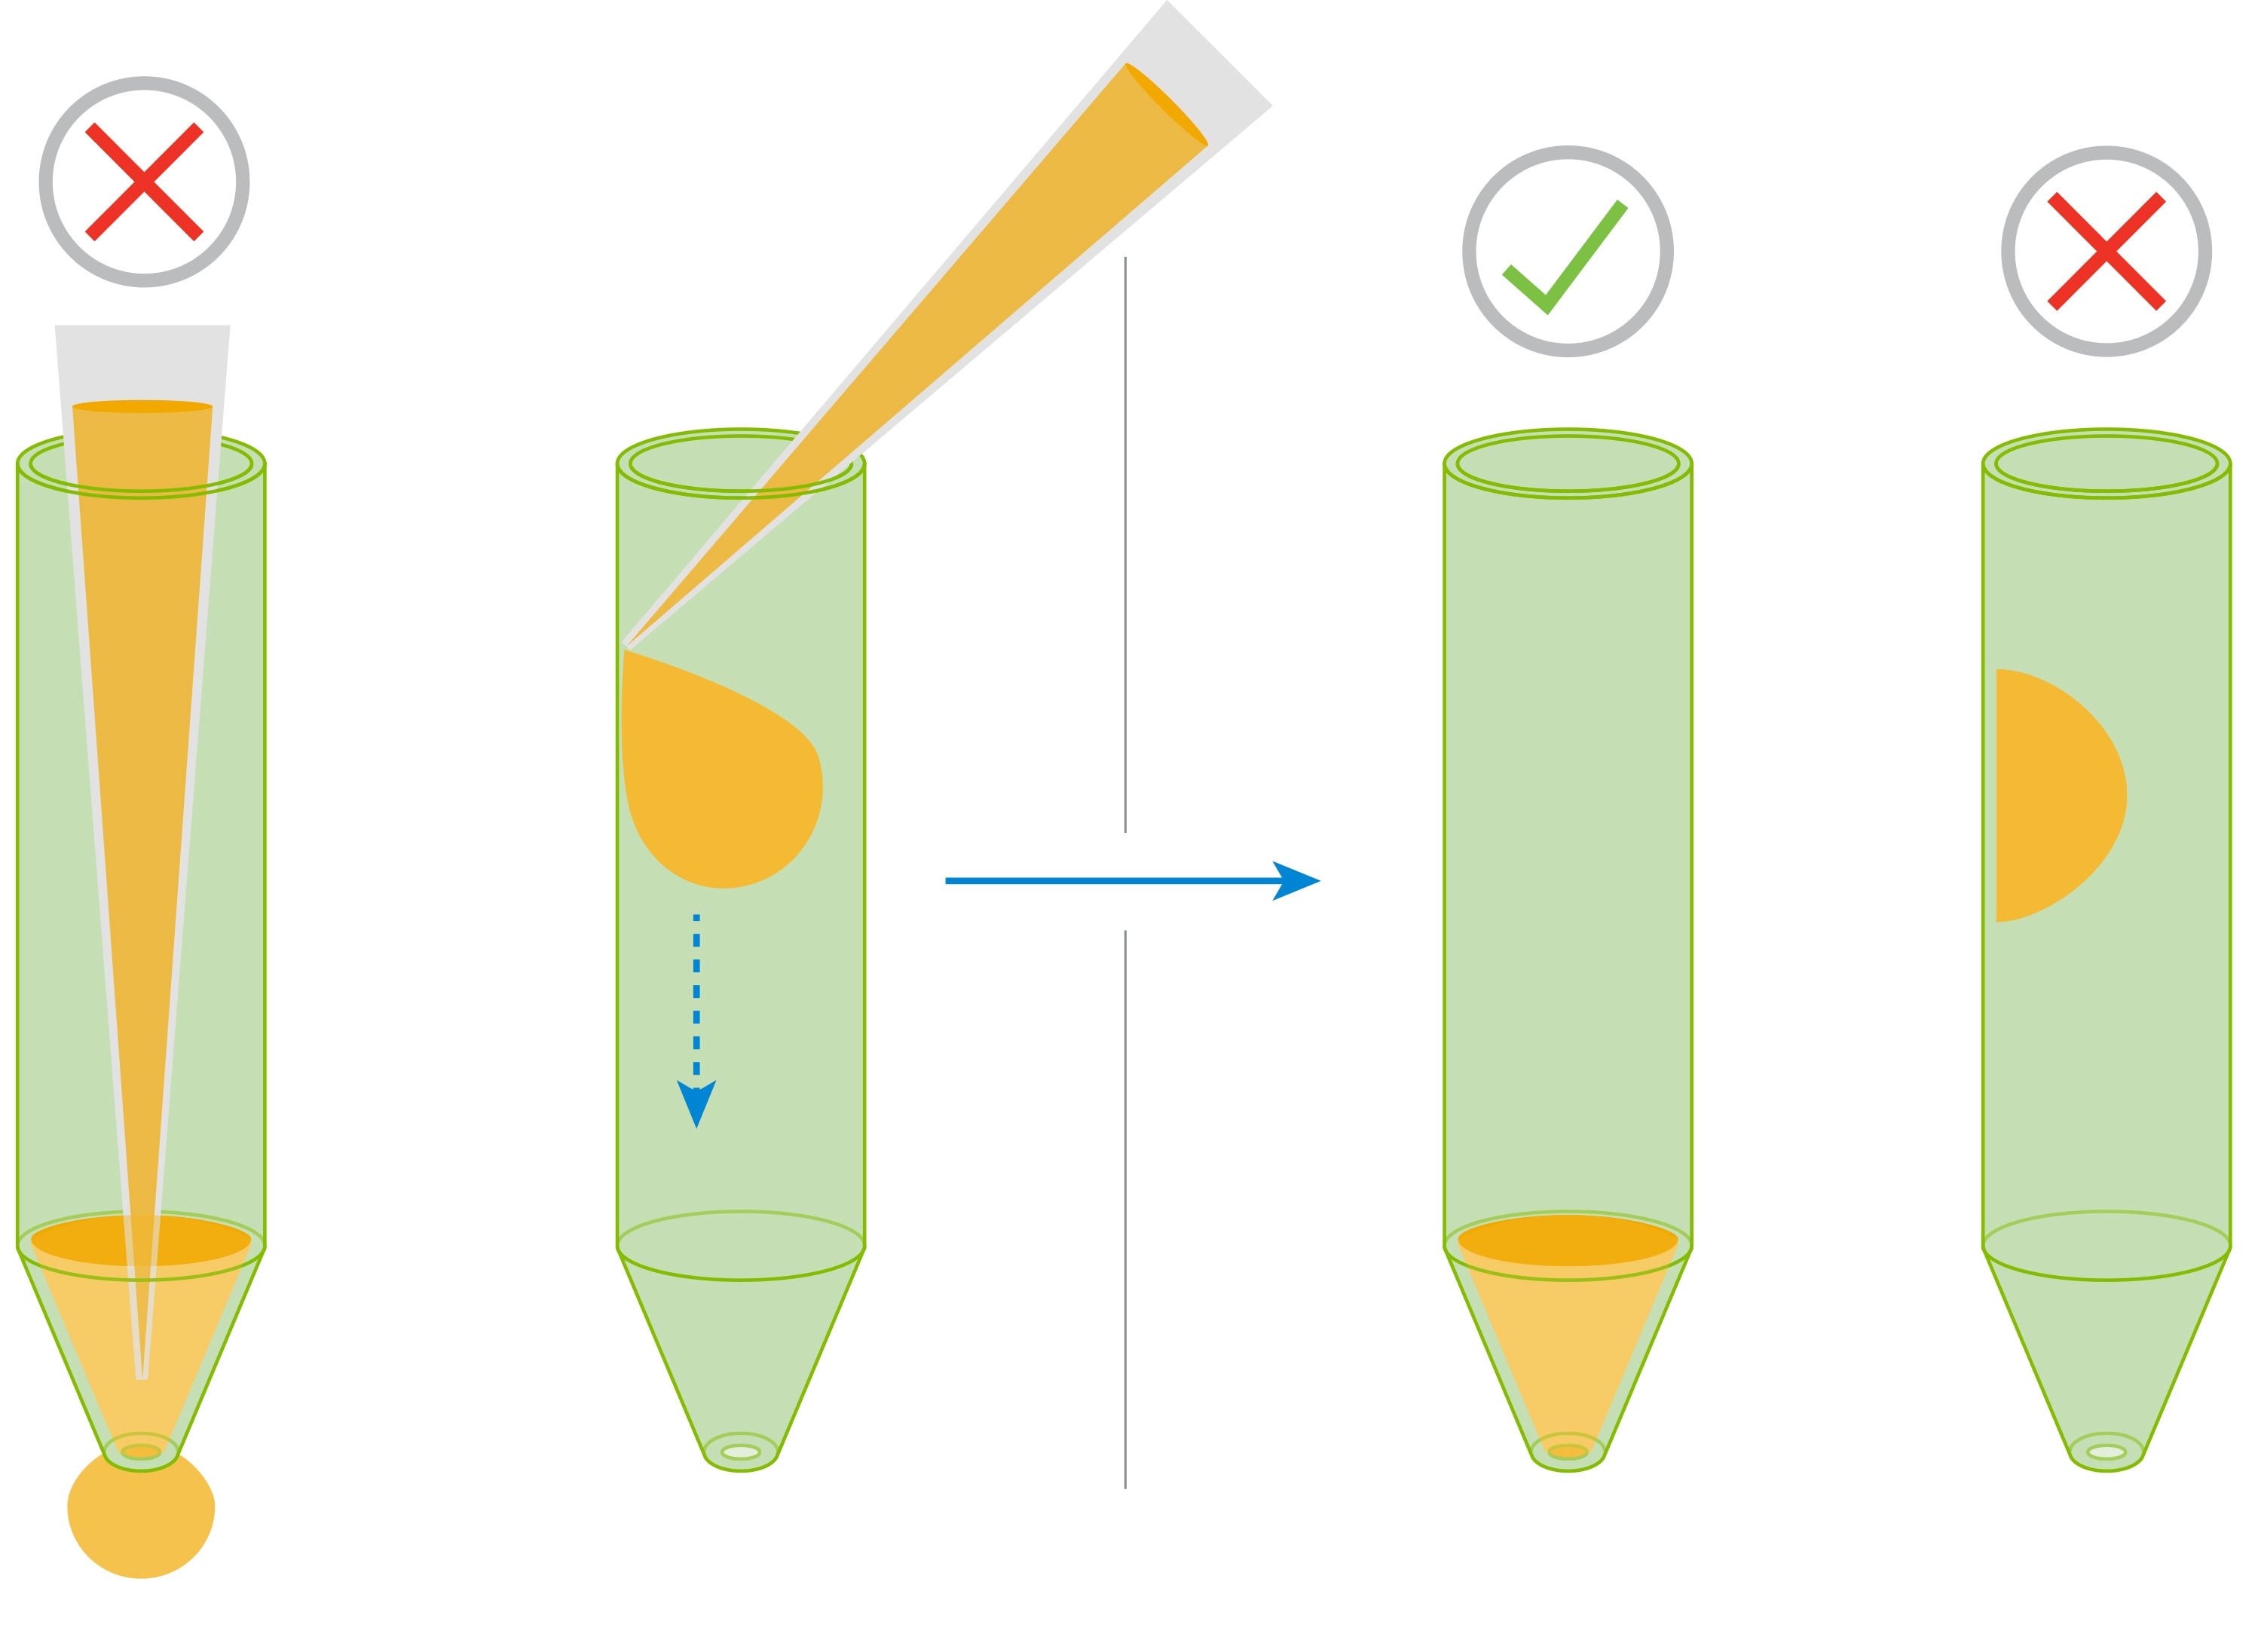
- Remove the assembled sensor cartridge with the XF Hydrobooster and utility plate from the incubator. Place the sensor cartridge upside down, next to the utility plate. Hold the utility plate steadily with one hand and use the other hand to remove the XF Hydrobooster
- Place the sensor cartridge back onto the utility plate. Leave the cartridge lid off. Orient the sensor cartridge. Place row labels (lettered A-D) to the left. The triangular notch will be in the bottom left-hand corner.
- Using a multichannel pipette, make sure the tips are securely fitted onto the pipette. Position the pipette tips (filled with your compounds for injection) at a 45° angle into the desired column in the loading guide. Insert the tips as far as they will go without resistance into the holes and dispense the compound.
- Do NOT insert the tips completely to the bottom of the injection ports as this may cause compound leakage through the port.
- Gently dispense 55 μL of the Oligomycin injection solution into port A. Withdraw the tips from the ports carefully. Avoid creating air bubbles, but do not tap any portion of the cartridge in an attempt to alleviate air bubbles. This may cause solutions to leak from the injection port.
- Repeat steps above to load port B, using 62 µL of Rotenone + Antimycin A injection solution.
4. Run your XF Assay
- Visually inspect the injection ports for even loading. The liquid should be in the port, make sure there are no residual drops on the top of the sensor cartridge.
- View cells under a microscope to:
- Estimate confluency. Ideal seeding densities for most cells will result in 75-90% confluency.
- Confirm cell health, morphology, seeding uniformity and purity (no contamination).
- For adherent cells, ensure cells are adhered with a consistent monolayer and were not washed away during washing step.
- Ensure your background wells do not contain cells.
Procedure to Run your Assay
1. Ensure the XF Flex Analyzer is powered ON and connected to the Controller (computer). You can verify the instrument connection status in the widget panel in the lower-left corner of Wave Pro software.
2. Double-click to open the desired assay template file from the Templates view.
3. After reviewing the group definitions, plate map layout and instrument protocol, click Start Run.
4. After you enter the save location for your result file, the tray door will open.
- Time to complete calibration is approximately 10-20 minutes (for assays at 37 °C).
- Once sensor cartridge calibration is complete, the software will display the Load Cell Plate dialog.
Important! Before starting calibration, ensure:
- The sensor cartridge fits properly on the Utility plate.
- The lid and hydrobooster are removed from the sensor cartridge.
- Proper orientation (direction) of the sensor cartridge on the Utility plate.
5. Place the sensor cartridge (hydrated and loaded with compounds) and Utility plate onto the tray when prompted.
6. Press I'm Ready to initiate sensor cartridge calibration.
Time to complete calibration is approximately 10-20 minutes (for assays at 37 °C).
Once sensor cartridge calibration is complete, the software will display the Load Cell Plate dialog.
7. Click Open Tray to eject the Utility plate and load the Cell Plate on the tray. The sensor cartridge remains inside the Analyzer for this step.
Important! Before loading the cell plate, ensure:
The lid is removed from the Cell Plate.
Proper orientation (direction) of the Cell Plate on the tray.
8. After placing the Cell Plate on the tray, click Load Cell Plate to initiate equilibration. After completing equilibration, the assay will automatically begin acquiring baseline measurements (as outlined in your instrument protocol).
9. Once the final measurement command in the instrument protocol is completed, the software will display the Unload Sensor Cartridge dialog.
10. Click Eject when ready to eject the sensor cartridge and cell plate. Set aside for later analysis if necessary (example - cell count normalization).
11. After removing the sensor cartridge and cell plate, stain cells using Hoechst dye.
12. Use Cell Imaging software to capture images using an Agilent BioTek Cytation imager. Utilize cell counts for data normalization.
13. Upload the assay result file to Seahorse Analytics at https://seahorseanalytics.agilent.com/ for data analysis.
Related Support Material
4. Run your XF Assay
This section focuses on performing initial cell characterization using the XF Real-Time ATP Rate Assay on your Analyzer.
This section focuses on performing initial cell characterization using the Cell Energy Phenotype Test on your Analyzer.
This section focuses on performing initial cell characterization using the XF Real-Time ATP Rate Assay on your XF HS Mini Analyzer. For more detailed information about performing an assay, please consult the XF HS Mini User Guide.
Important – Before you start your XF Assay
- Visually inspect the injection ports for even loading. The liquid should be in the port, make sure there are no residual drops on the top of the sensor cartridge.
- View cells under a microscope to:
- Confirm cell health, morphology, seeding uniformity and purity (no contamination).
- For adherent cells, ensure cells are adhered with a consistent monolayer and were not washed away during washing step.
- For suspension cells, ensure cells are stably adhered following centrifugation, washing and incubation.
- Ensure your background wells do not contain cells.
Procedure to Run your Assay
- Go to the and ensure the XFe Analyzer is powered ON and connected to the XFe Controller (computer). You can verify the instrument connection status in the widget panel in the lower-left corner of Wave Controller software.
- Ensure the XF Pro Analyzer is powered ON and connected to the XF Pro Controller software. You can verify the instrument connection status in the widget panel in the lower-left corner of XF Pro Controller software. Confirm that the temperature is shown.
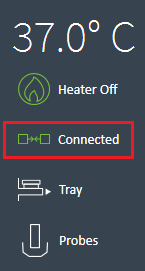
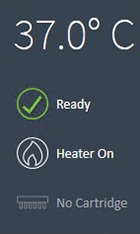
- Double-click to open the desired assay template file from the Templates view. If your assay template is not displayed on the Templates view, transfer the template using a shared network drive or USB flash drive.
- After reviewing the group definitions, plate map layout and instrument protocol, click Start Run.
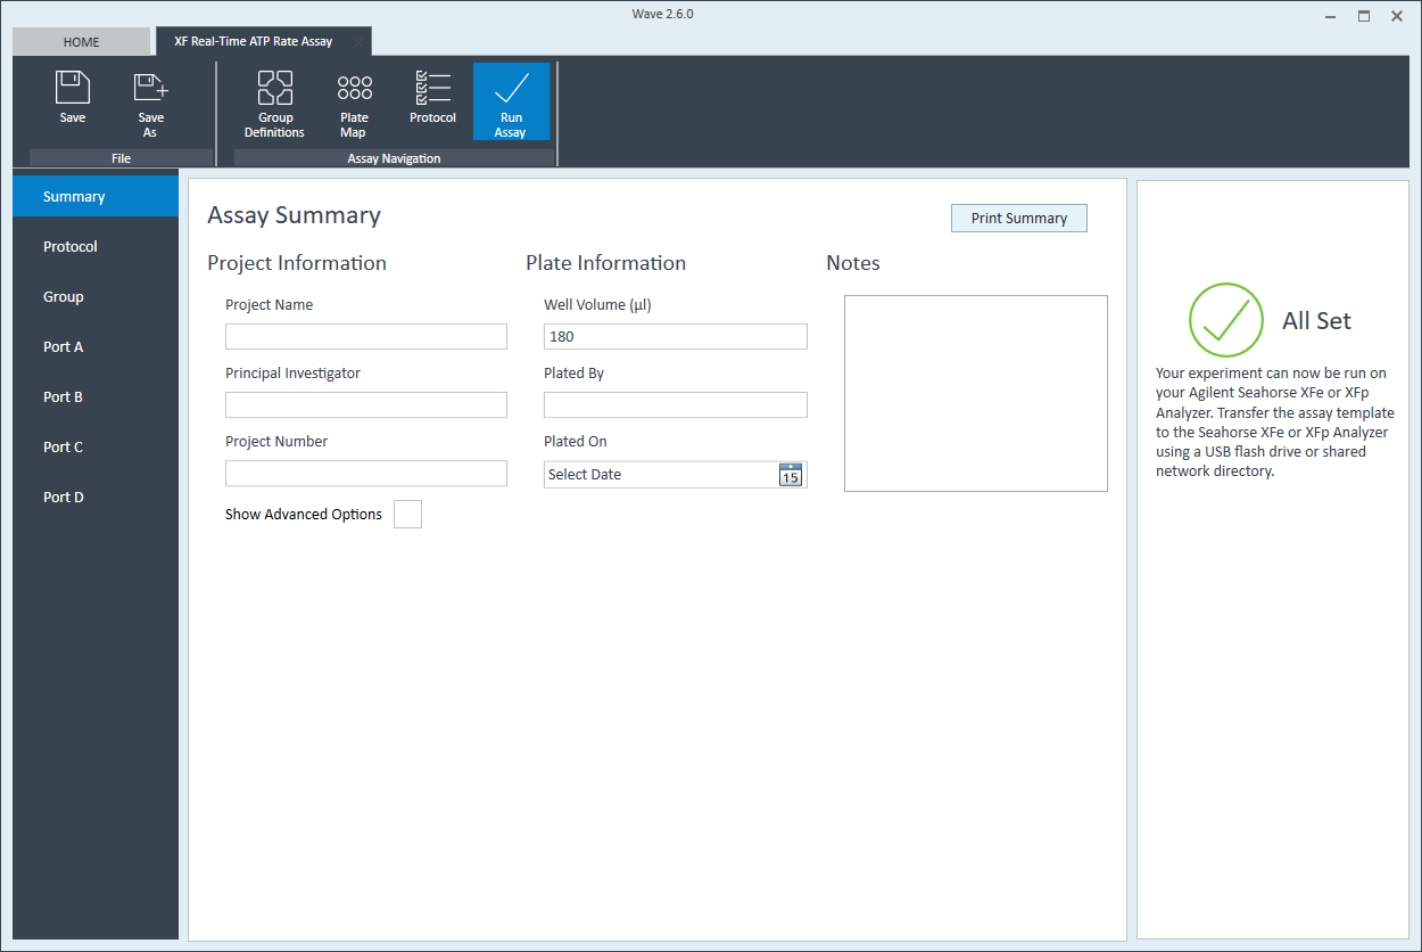
- After you enter the save location for your result file (following completion of the assay), the tray door on the XFe Analyzer will open.
Important! Before starting calibration, ensure:
- The sensor cartridge fits properly on the Utility plate.
- The lid is removed from the sensor cartridge.
- Proper orientation (direction) of the sensor cartridge on the Utility plate.
- After you have entered the save location for your result file (following completion of the assay), and clicked “save”, the “Load Cartridge” window will open. After confirming “I’m Ready”, the tray door for the XF Pro Analyzer will open.
Important! Before starting calibration, ensure:
- The sensor cartridge fits properly on the Utility plate.
- The lid is removed from the sensor cartridge.
- Proper orientation (direction) of the sensor cartridge on the Utility plate.
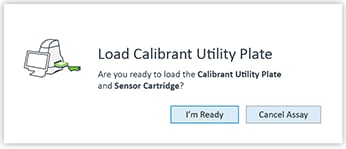
- Place the sensor cartridge (hydrated and loaded with compounds) and Utility plate onto the tray when prompted.
- Press I'm Ready to initiate sensor cartridge calibration.
Time to complete calibration is approximately 10-20 minutes (for assays at 37 °C). For XF assays performed at temperatures other 37°C an additional 30 minutes of pre-calibration time will be added to ensure accurate data acquisition.
Once sensor cartridge calibration is complete, Wave Controller will display the Load Cell Plate dialog. - Press Load Cartridge to initiate sensor cartridge calibration.
Time to complete calibration is approximately 10-20 minutes (for assays at 37 °C). For XF assays performed at temperatures other 37°C an additional 30 minutes of pre-calibration time will be added to ensure accurate data acquisition.
Once sensor cartridge calibration is complete, Wave Controller will display the Load Cell Plate dialog.
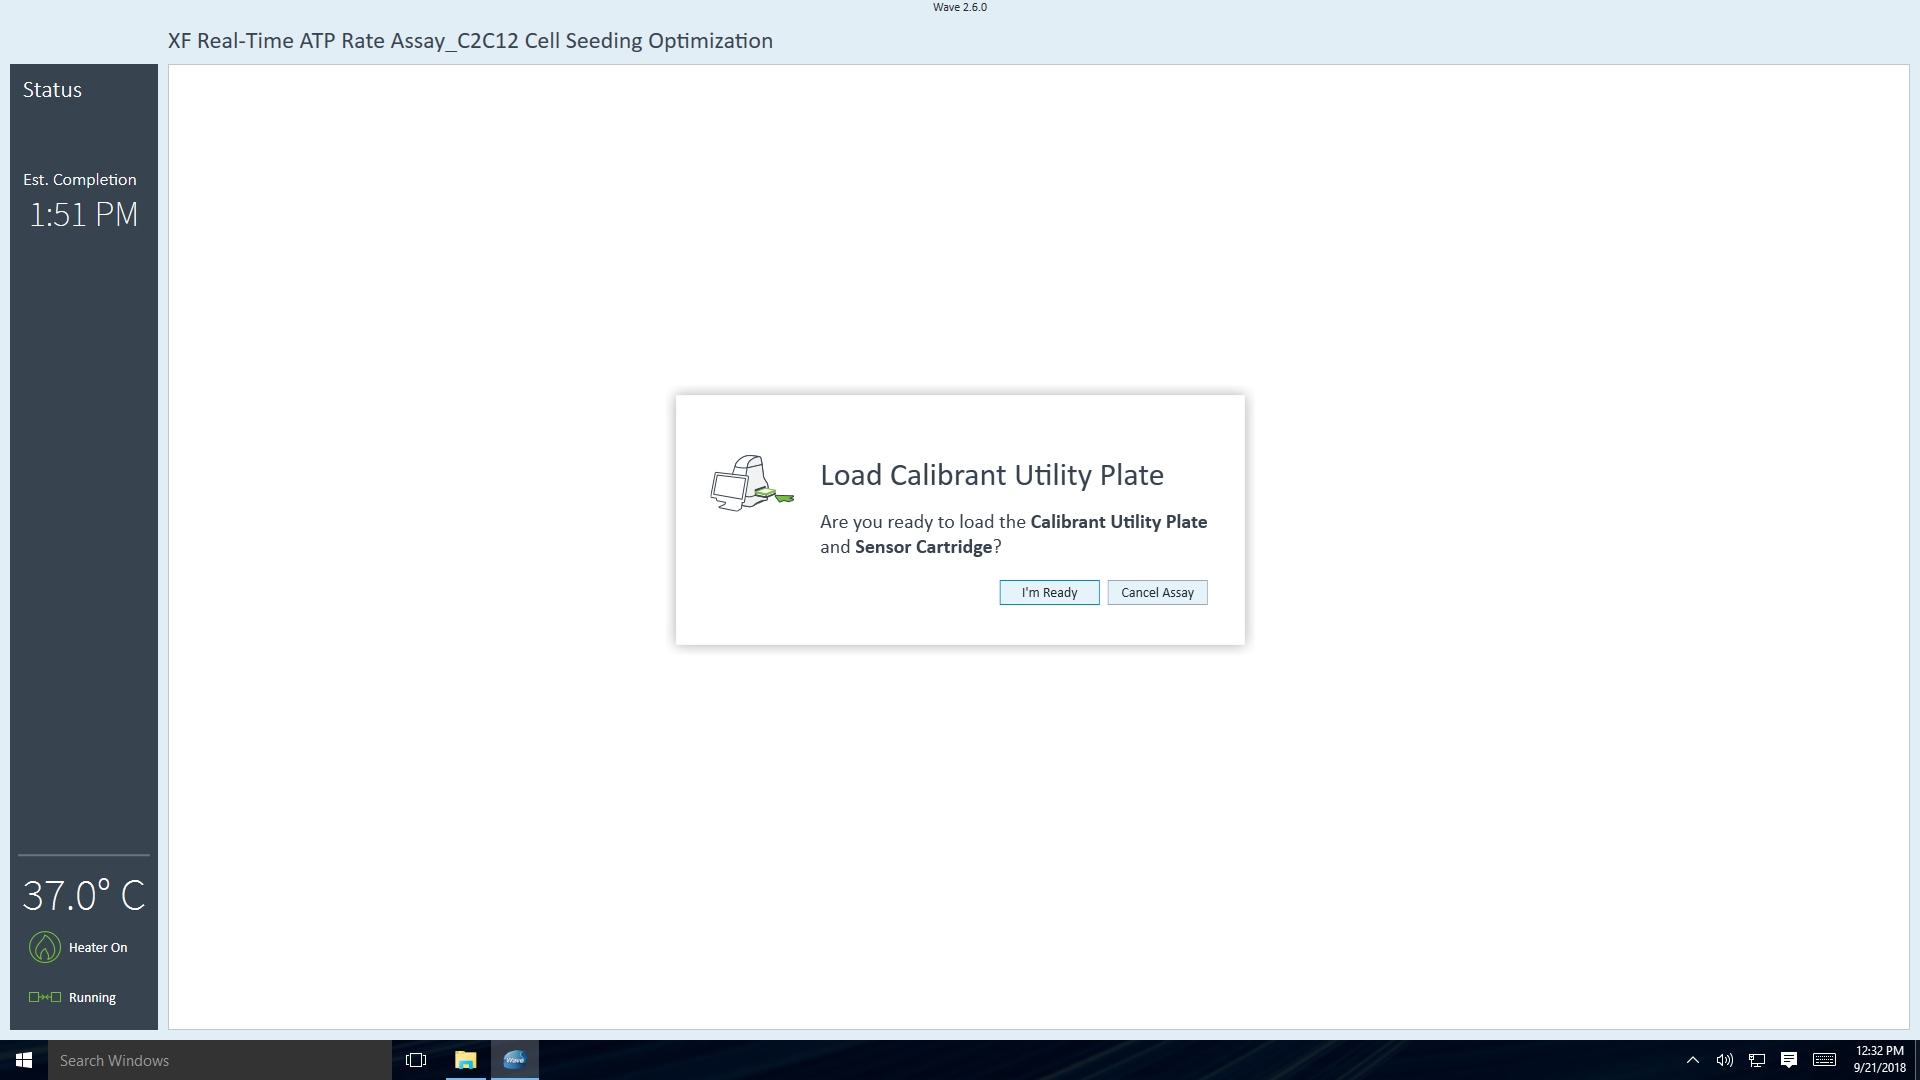
@2x%20350x472.png)
- Click Open Tray to eject the Utility plate and load the Cell Plate on the tray. The sensor cartridge remains inside the XFe Analyzer for this step.
Important! Before loading the cell plate, ensure:
- The lid is removed the Cell Plate.
- Proper orientation (direction) of the Cell Plate on the tray.
- Click Open Tray to eject the Utility plate and load the Cell Plate on the tray. The sensor cartridge remains inside the XF Pro Analyzer for this step.
Important! Before loading the cell plate, ensure:
- The lid is removed the Cell Plate.
- Proper orientation (direction) of the Cell Plate on the tray.
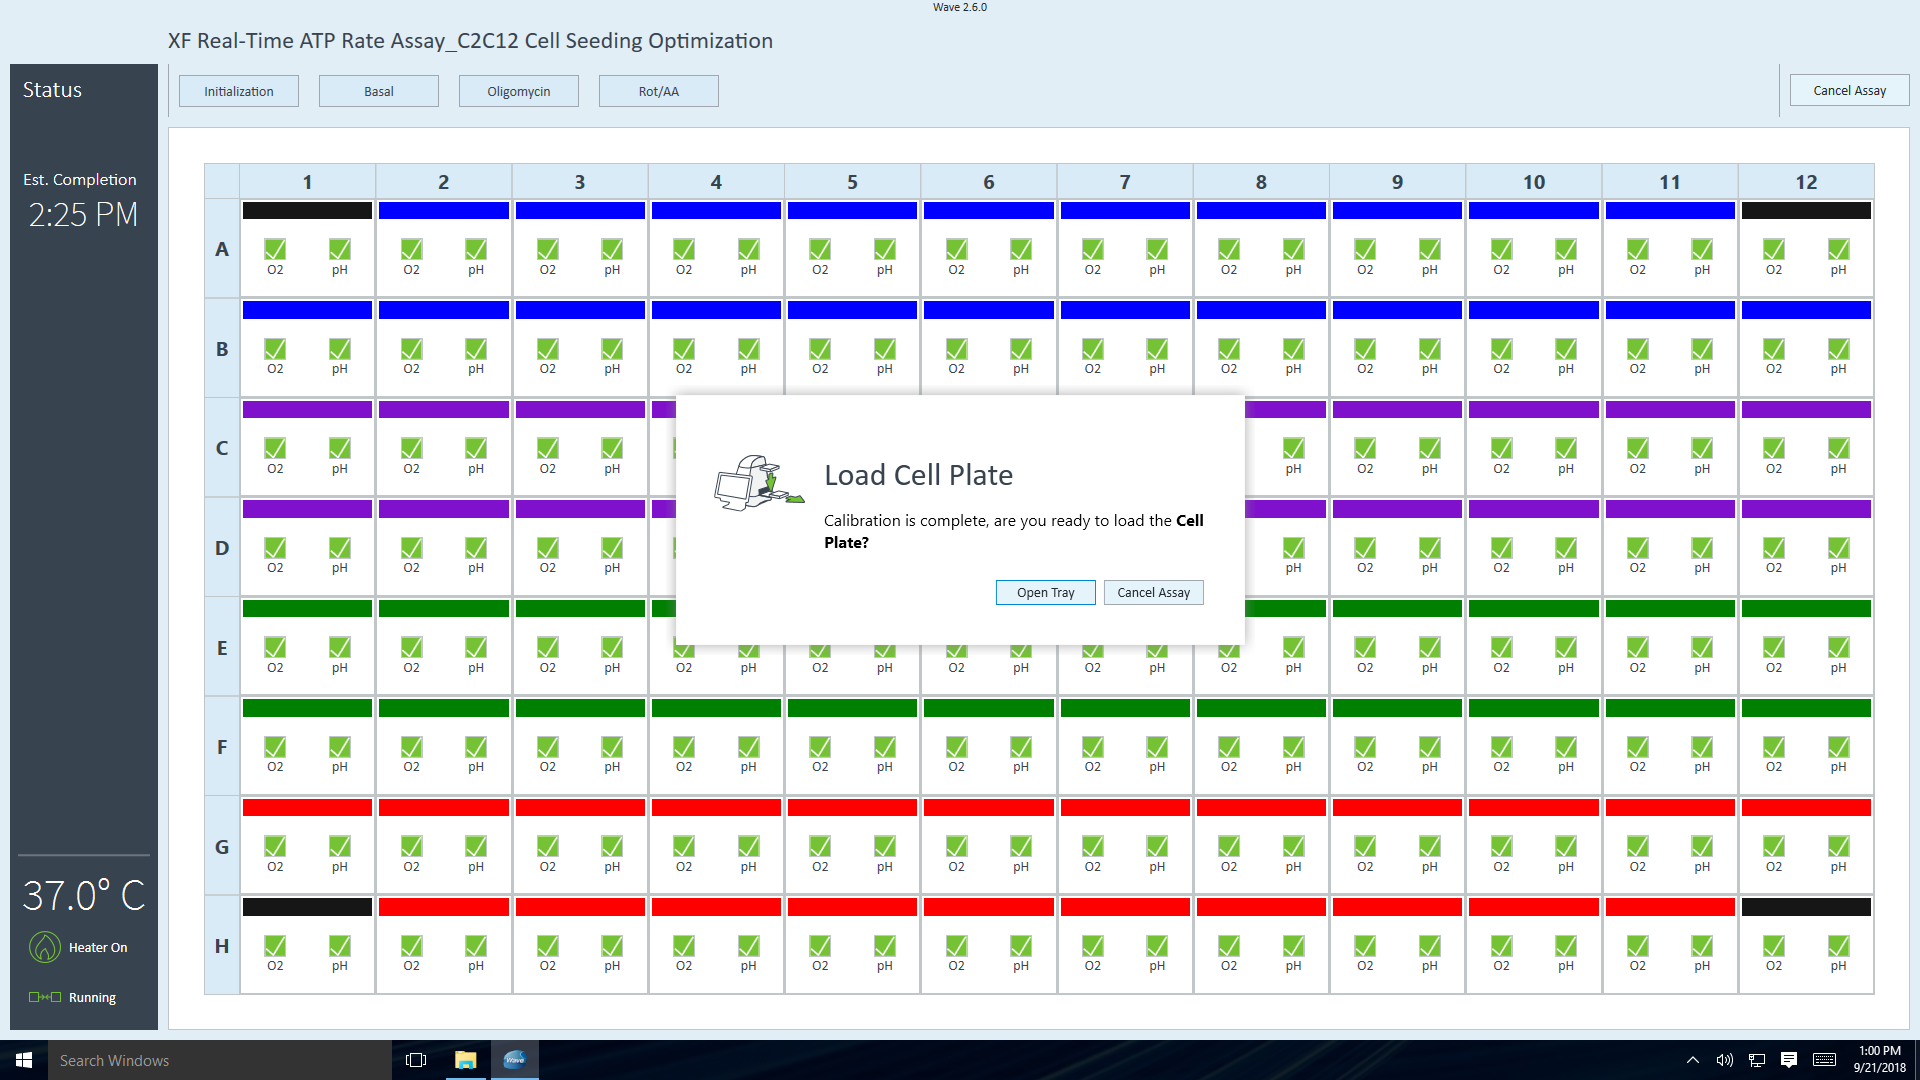
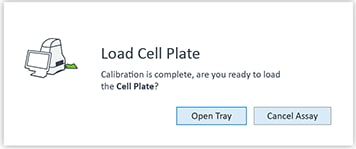
- After placing the Cell Plate on the tray, click Load Cell Plate to initiate equilibration. After completing equilibration, the assay will automatically begin acquiring baseline measurements (as outlined in your instrument protocol).
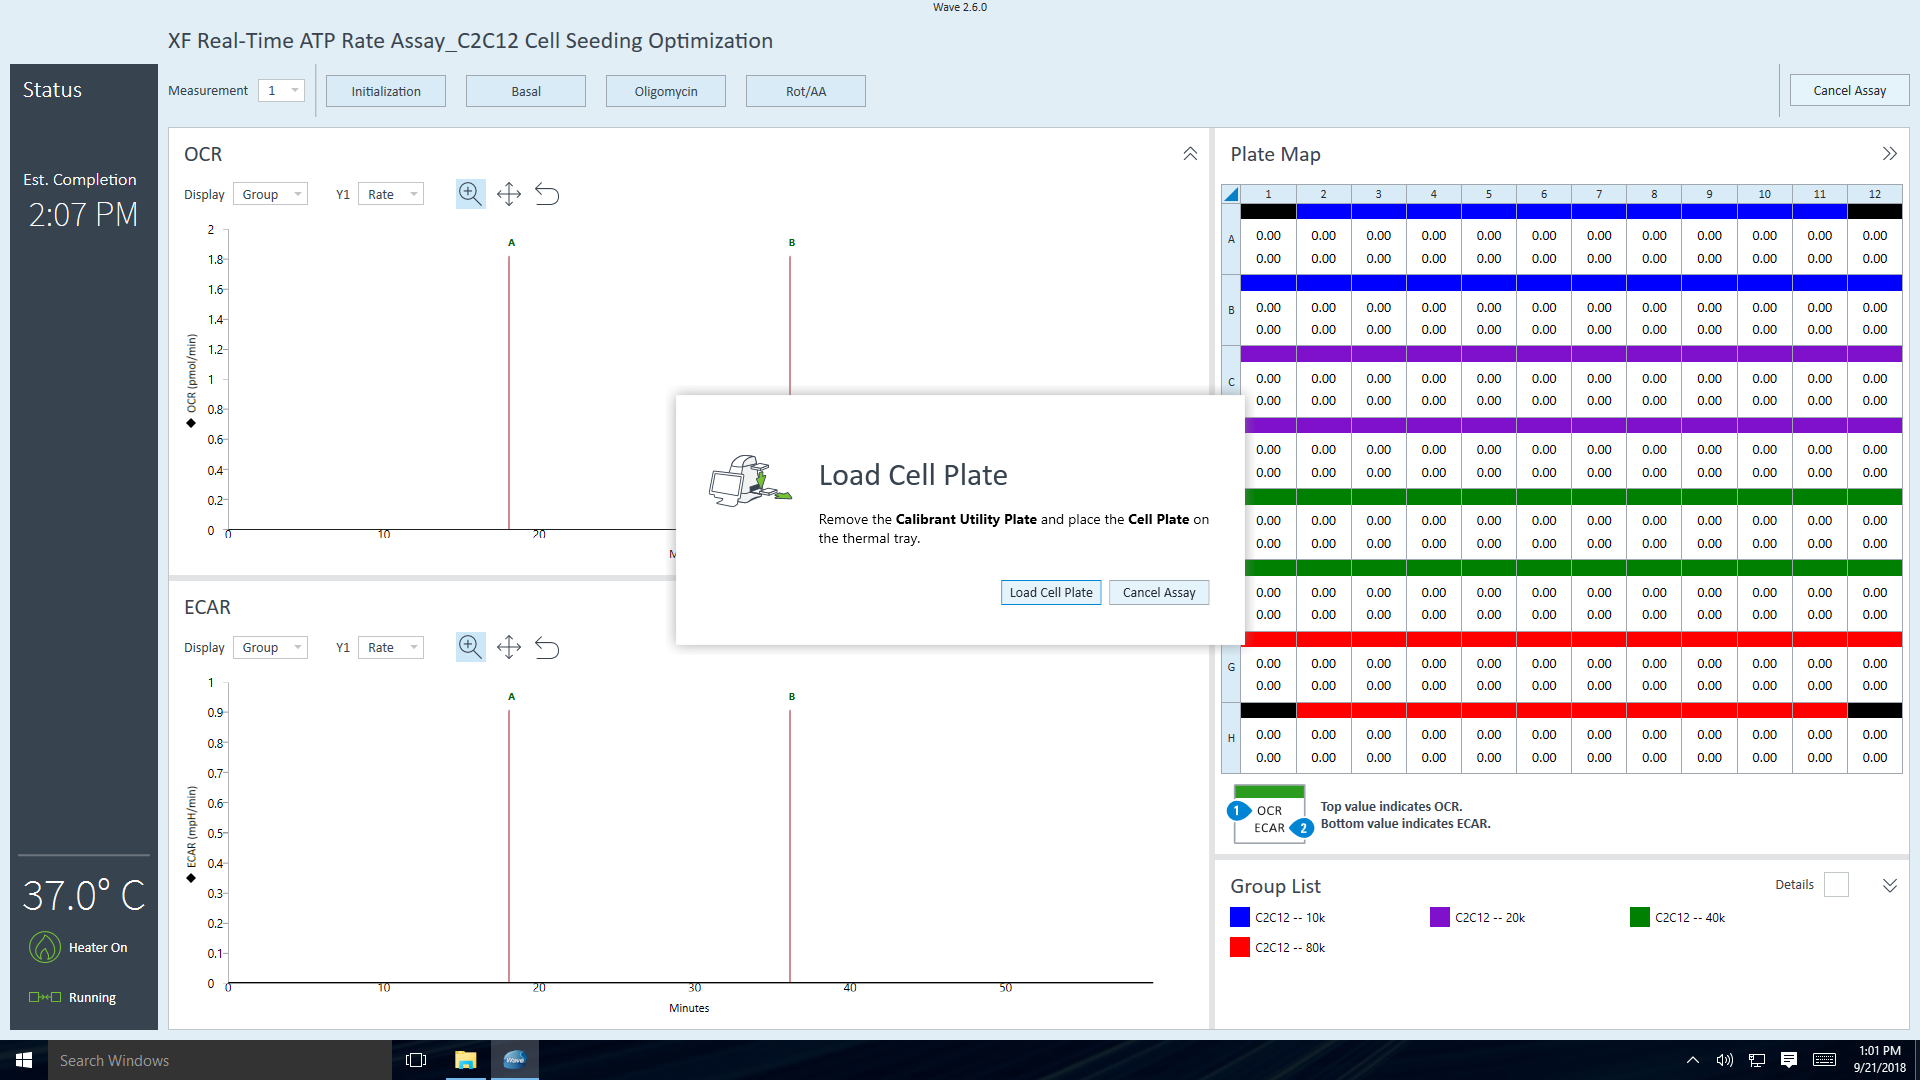
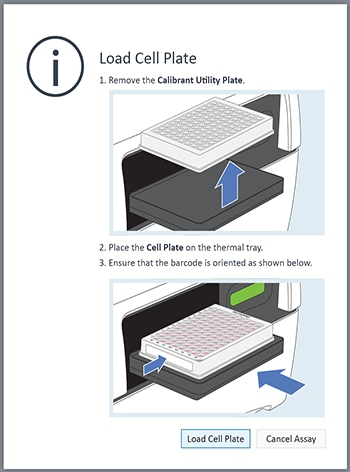
- Once the final measurement command in the instrument protocol is completed, Wave Controller software will display the Unload Sensor Cartridge dialog.
- Once the final measurement command in the instrument protocol is completed, XF Pro Controller software will display the Unload Sensor Cartridge dialog. Click EJECT when ready to eject the sensor cartridge and cell plate. Set aside for later analysis if necessary (example – cell count normalization).
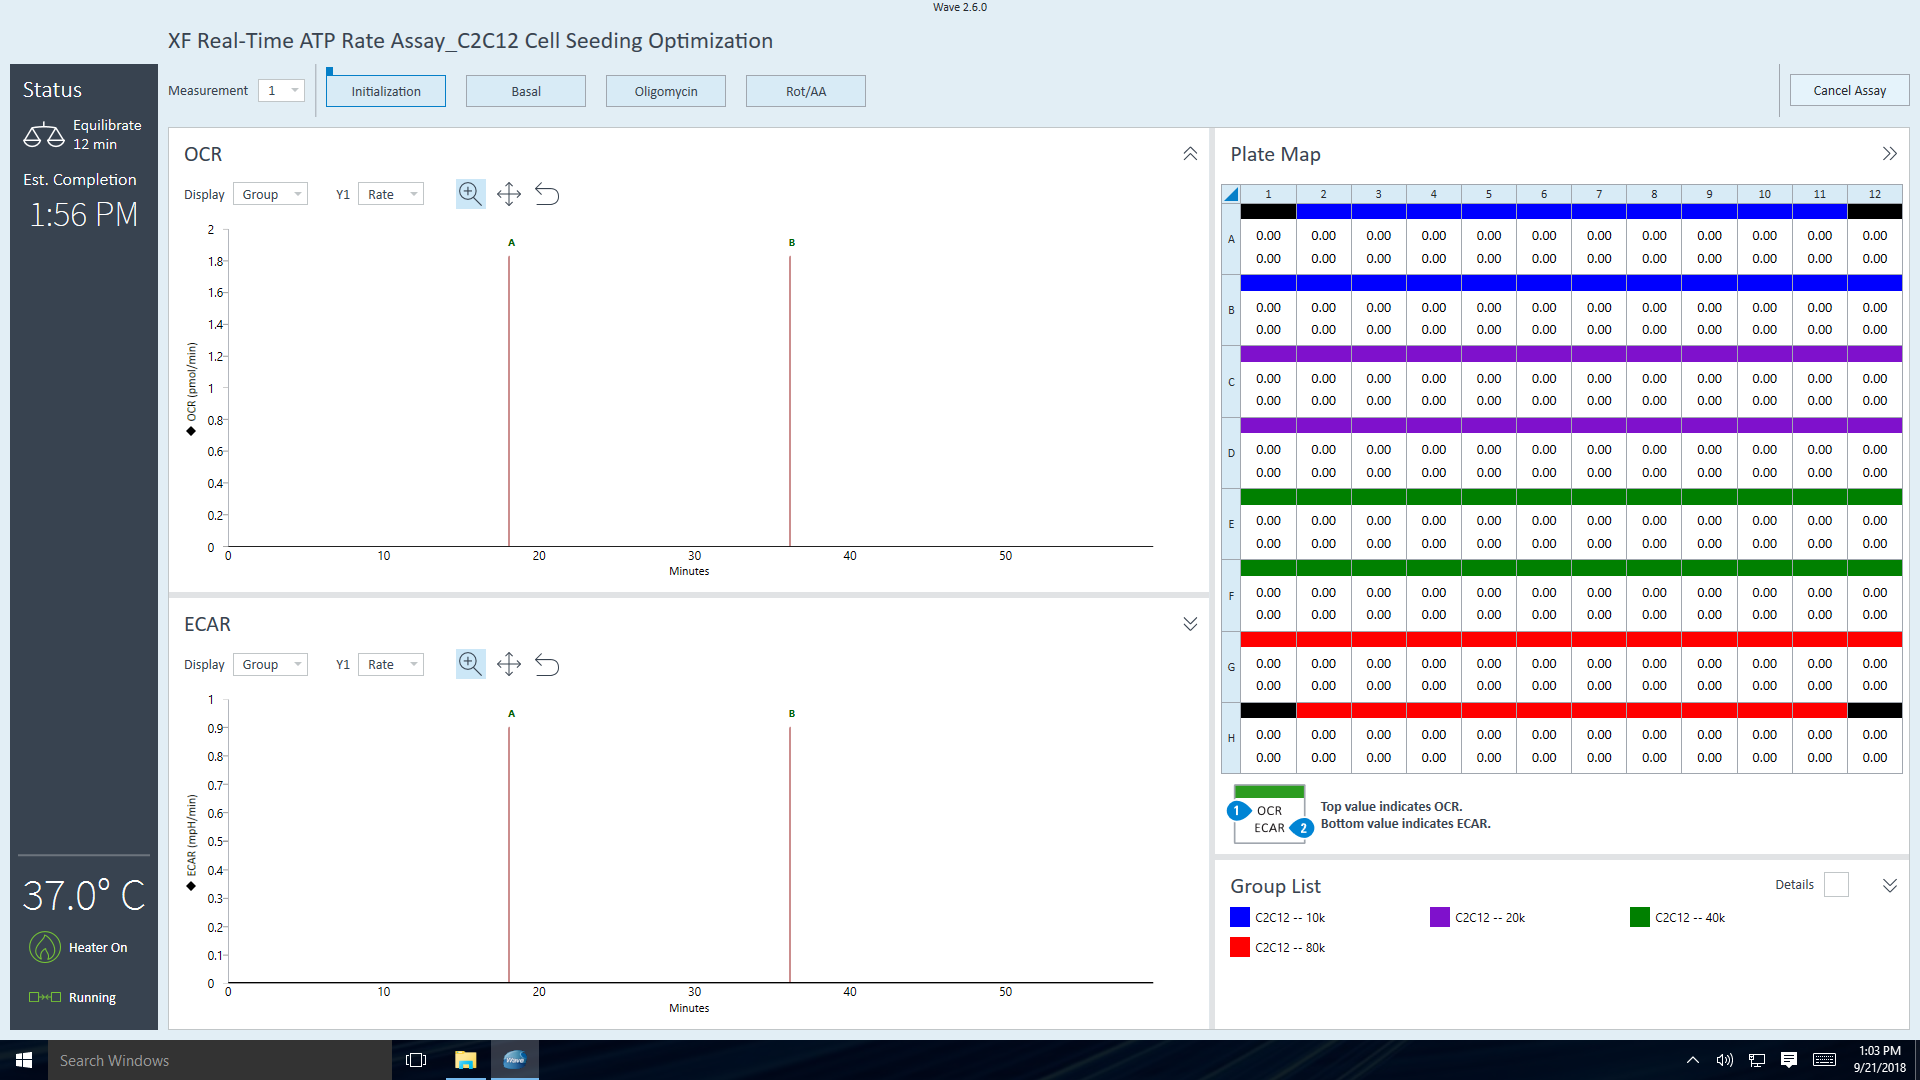
- Click Eject when ready to eject the sensor cartridge and cell plate. Set aside for later analysis if necessary (example - cell count normalization).
- After removal of the sensor cartridge and the cell plate from the tray click Done.
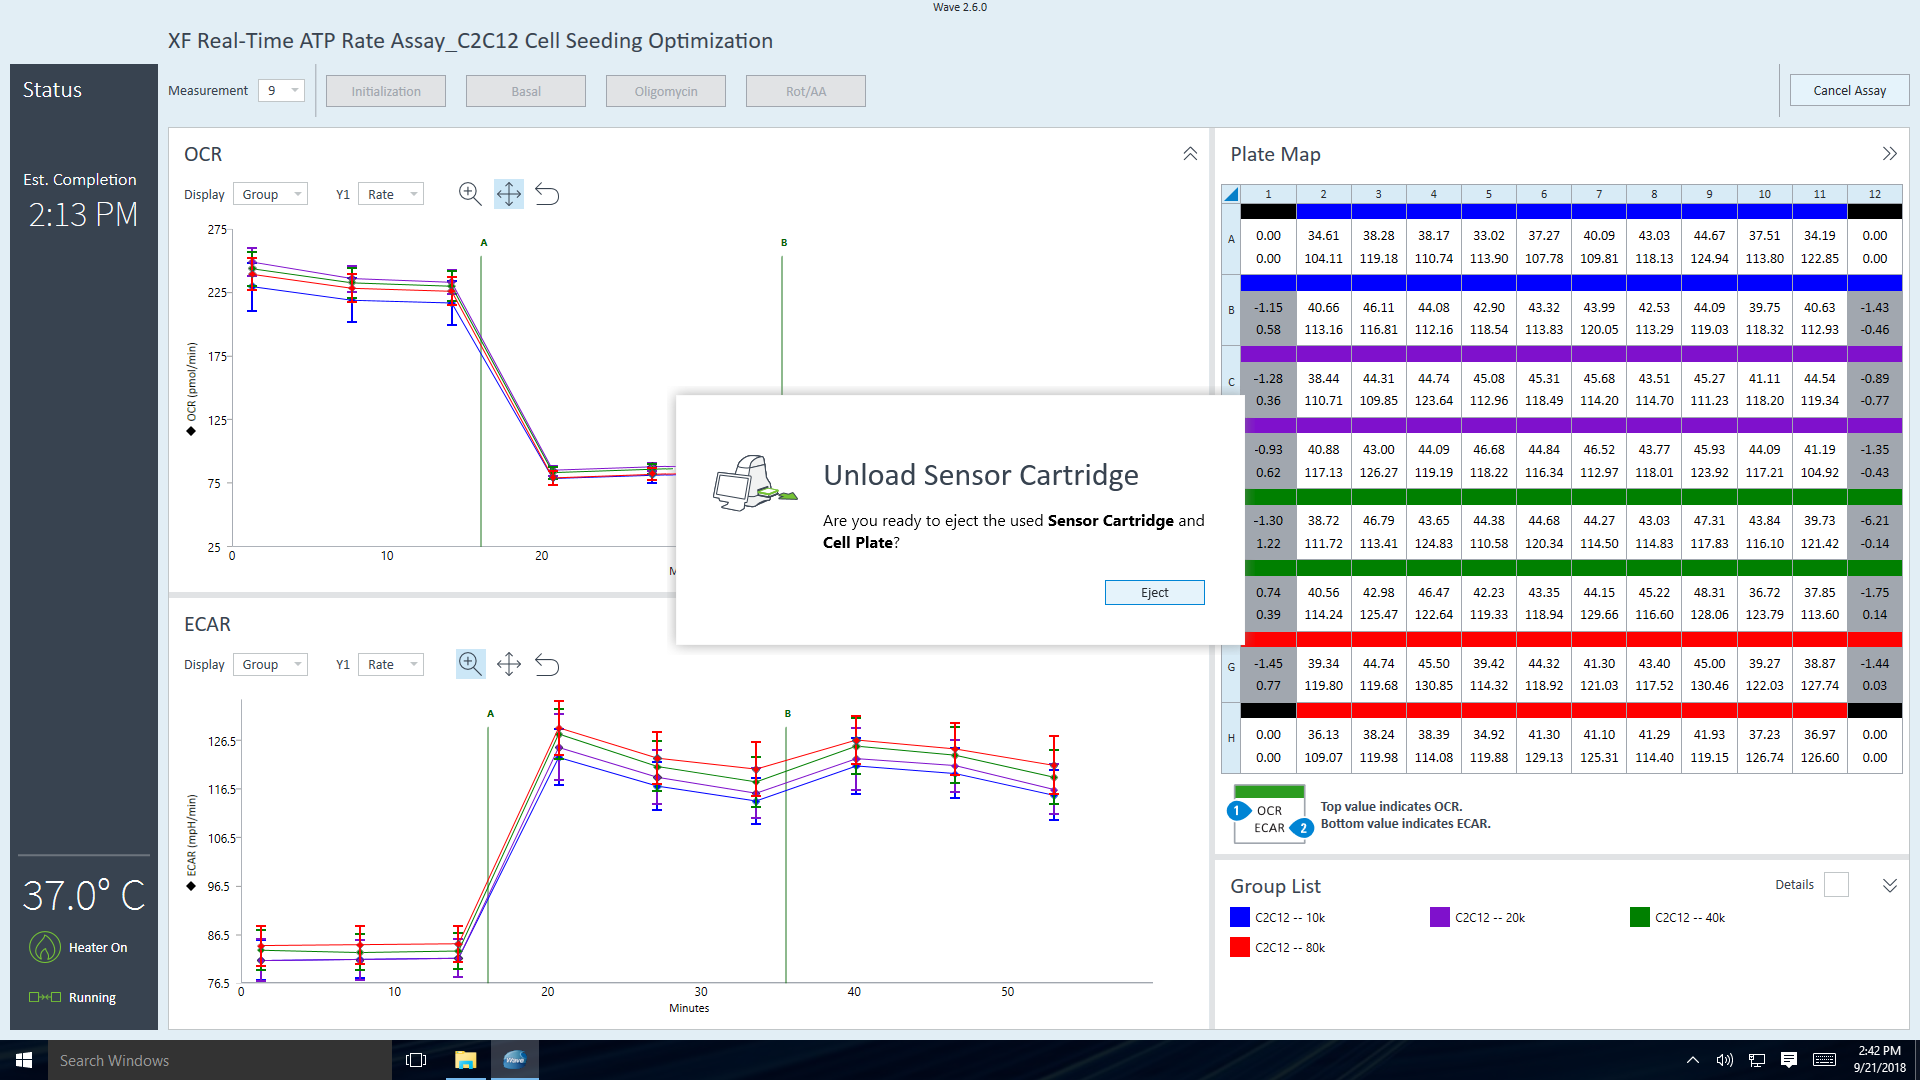
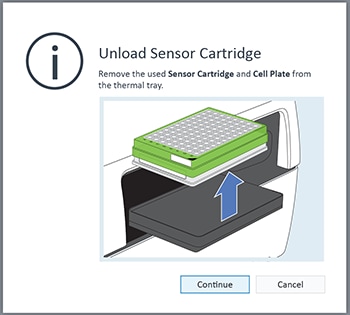
- After removing the sensor cartridge and cell plate, the Assay Complete dialog will appear.
Click View Results to immediately open your assay result file, or click Wave Home to return to the Templates view and begin another XFe assay. - The Assay Complete dialog will appear. Click View Results to immediately open your assay result file.

- Save or transfer the assay result file to a shared network drive or USB drive and open using Wave Desktop software on your PC for data analysis.
- Save or transfer the assay result file to a shared network drive or USB drive
See Chapter 2 of the Wave User Guide for complete details of XFe Analyzer assay operation, including how to add/remove measurements during an assay, environmental conditions for XFe assays at temperatures other than 37 °C, and more.
See the Wave Pro & XF Pro Controller Software User Guide for complete details, including how to add/remove measurements during an assay, environmental conditions for XFe assays at temperatures other than 37 °C, and more.
Procedure to Run your Assay
- Once all required injection ports are filled, transfer the cartridge and utility plate to the Analyzer and begin cartridge calibration.
Important! Before starting calibration, ensure:
- The sensor cartridge fits properly on the Utility plate.
- The lid is removed from the sensor cartridge.
- Proper orientation (direction) of the sensor cartridge on the Utility plate.
- When the cartridge calibration is complete, follow the software prompts to exchange the utility plate for the cell culture plate and initiate the XF assay.
Important! Before loading the cell plate, ensure:
- The lid is removed the Cell Plate.
- Proper orientation (direction) of the Cell Plate on the tray.
- When your assay is complete eject the sensor cartridge & cell culture plate, set aside for later analysis if necessary (example - cell count normalization).
- Save or transfer the XFd result file to a shared network drive or USB drive and open using Wave Desktop software on your PC for analysis of assay data.
Procedure to Run your Assay
- On the XFp Analyzer home screen, touch Start to display the list of available assay templates.
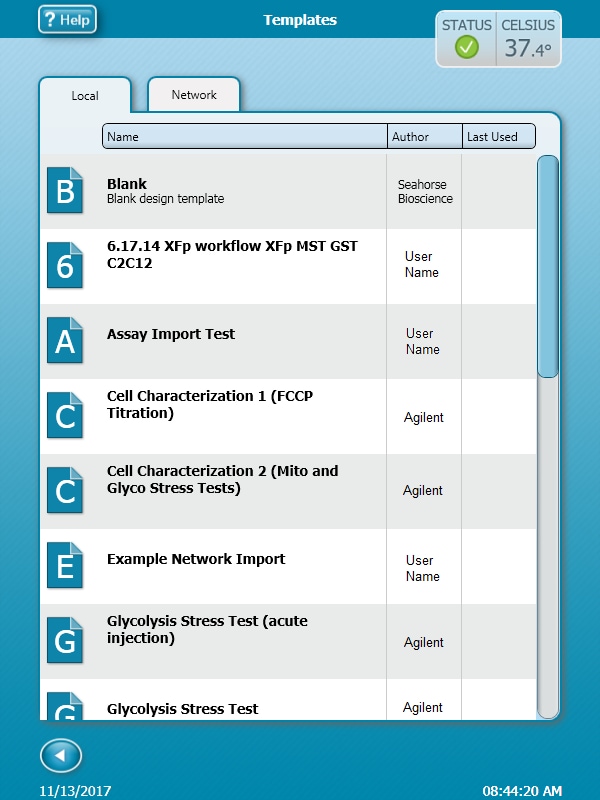
If the desired template is not available under the Local tab, open or transfer the template file using a shared network drive or USB flash drive.
- On the XF HS Mini Analyzer home view, touch Start to display the list of available assay templates.
- If the desired assay template file was created on Wave Pro/Wave software or Seahorse Analytics, open or transfer the assay template file using a shared network drive or USB flash drive, respectively.
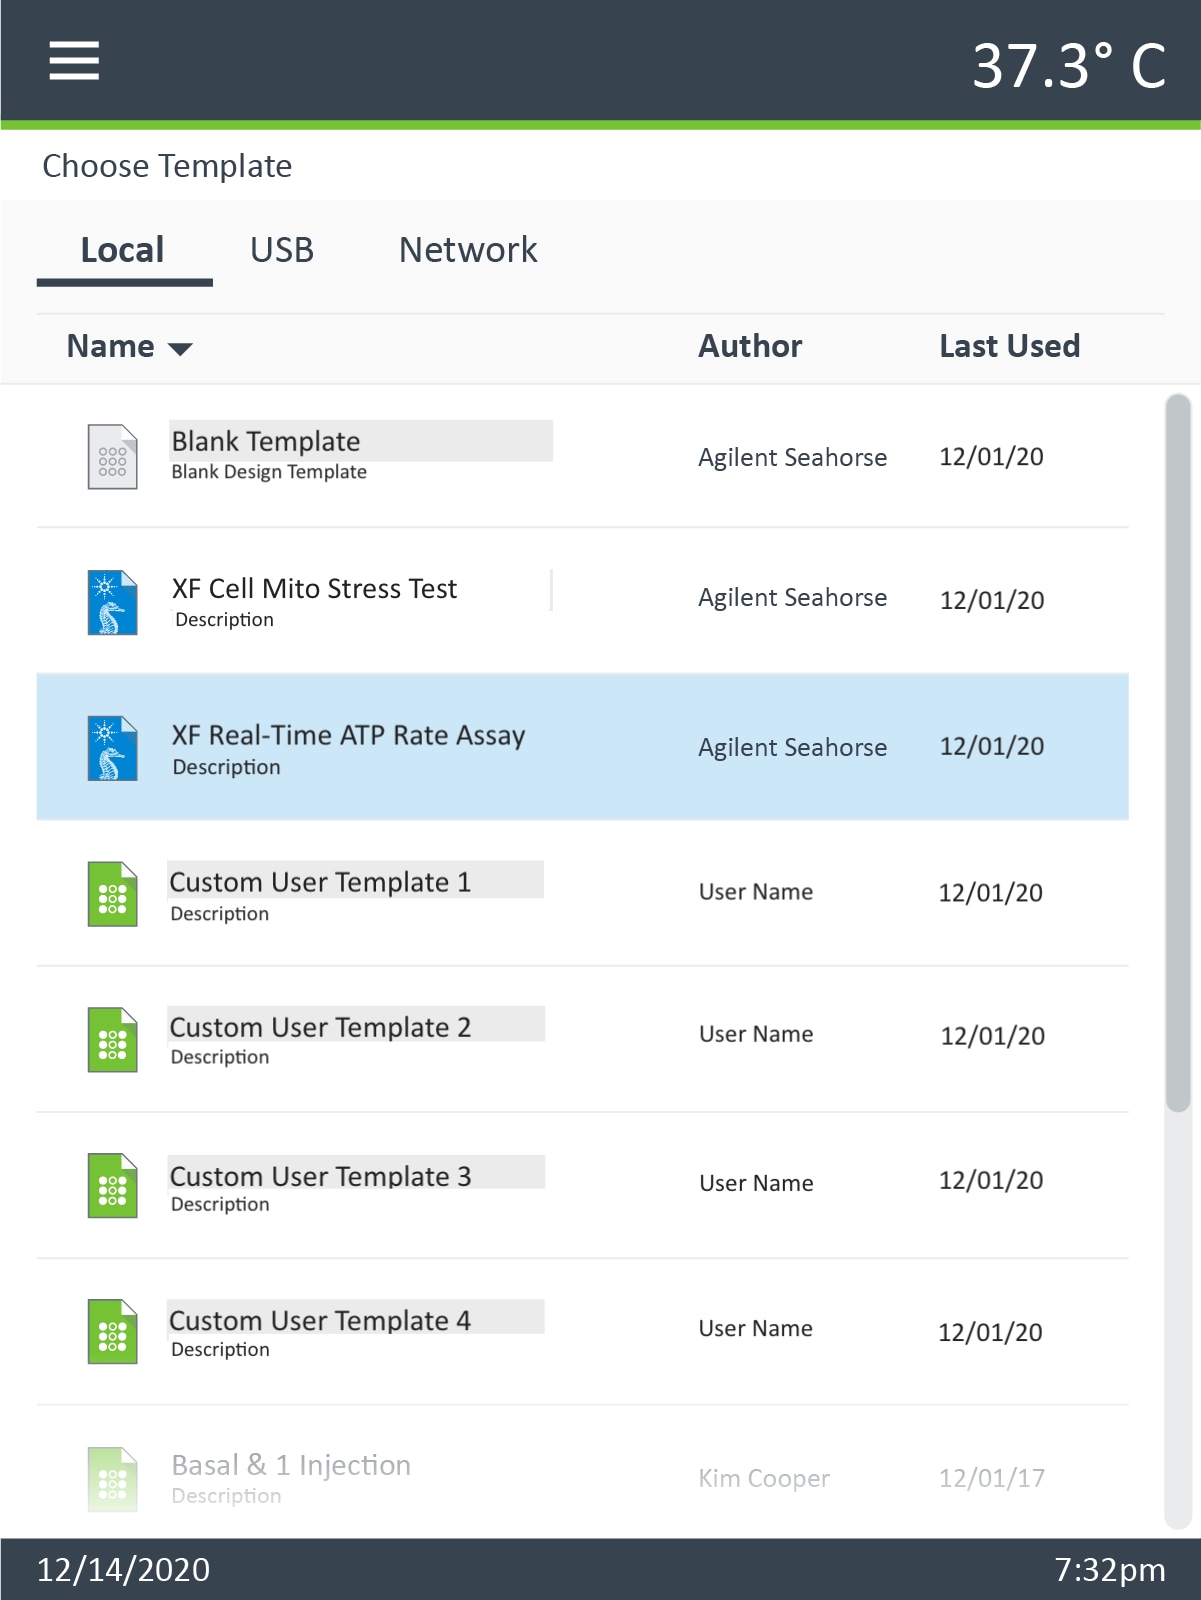
- Touch to open the assay template to review the template design:
- Group definitions - Touch the group name to display the injection strategy, pretreatments, and cell type information for the selected group. XFp Analyzer software does not allow modifications to group definitions, Wave Desktop software must be used.
- Plate Map - Change a well assigned to a group, touch the group name first, then touch the well on the plate map.
- Touch a template from the list to open and review the group definitions and plate map layout:
- Group Definitions – Touch the group name to display the injection strategy, pretreatments, assay media, and cell type for the selected group. Modifications to group definitions can be made using the modify function in Agilent Seahorse Analytics.
- Plate Map – To change the group assigned to a well on the plate map, first touch the group name from the list then touch the well on the plate map.
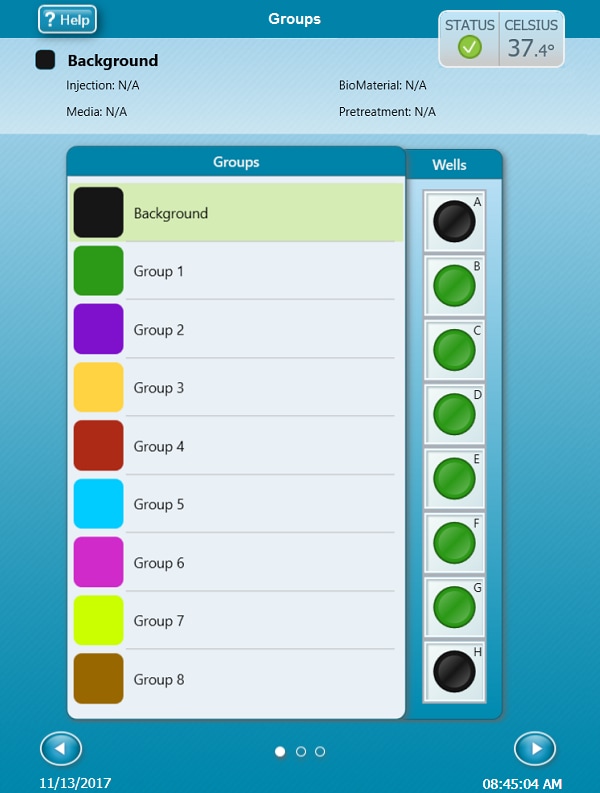
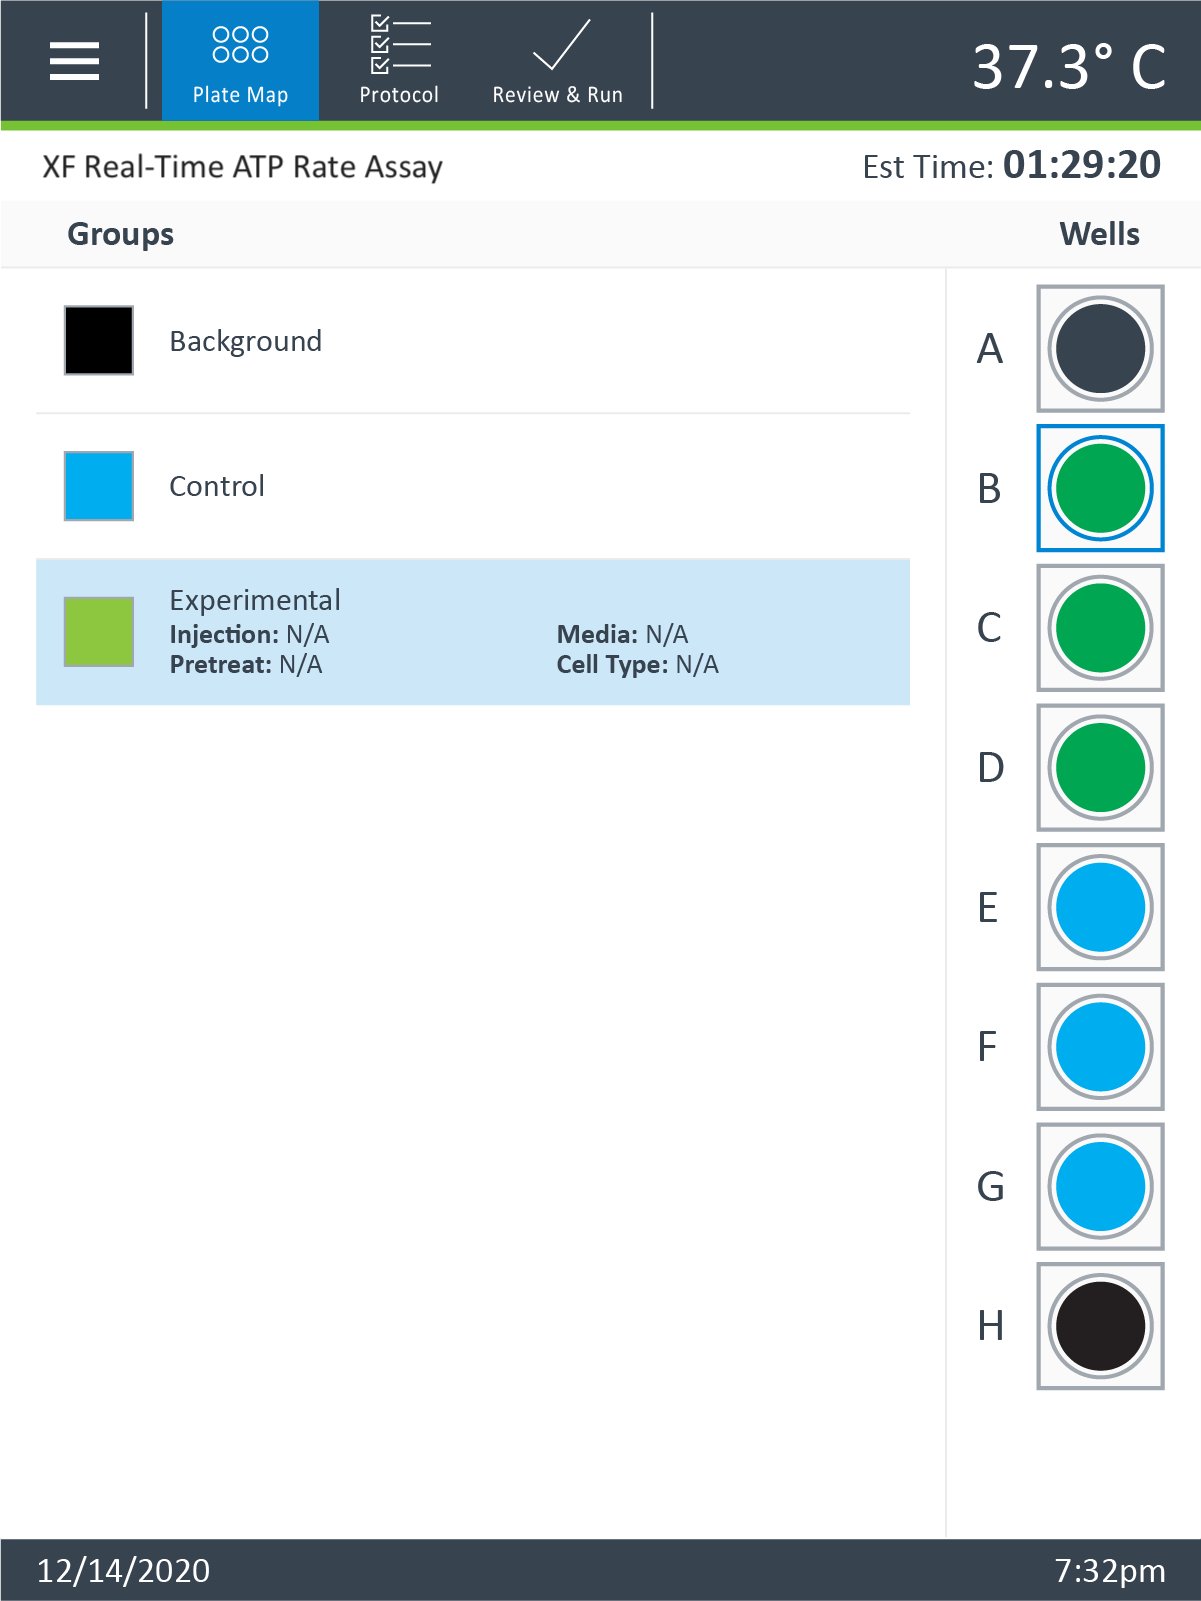
- Touch the right arrow (lower-right corner) to review or edit the instrument protocol
- To add or remove measurement cycles from the instrument protocol, first touch the protocol step, then use the plus/minus buttons to adjust measurement cycles.
- Touch Protocol in the ribbon at the top of the XF HS Mini display to review or edit the instrument protocol.
- To add or remove measurement cycles, first touch the protocol command then use the plus/minus buttons to adjust the number of measurement cycles.
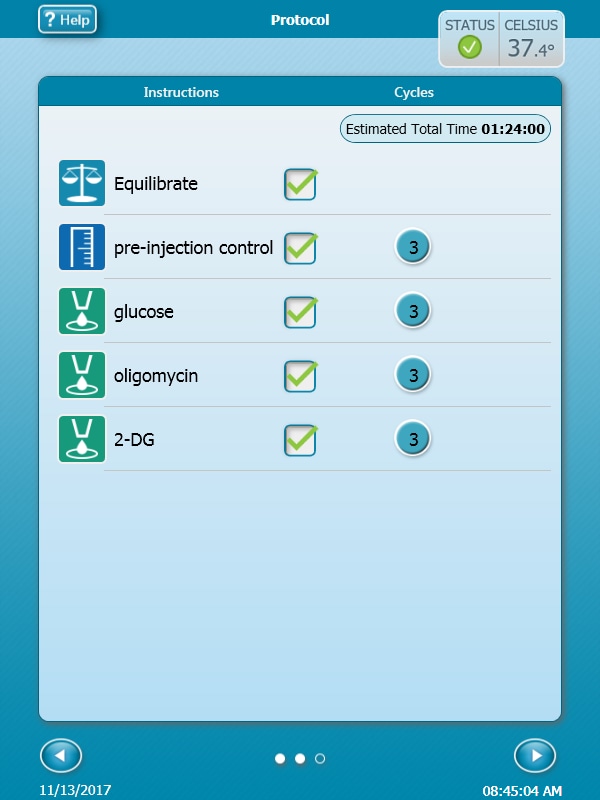
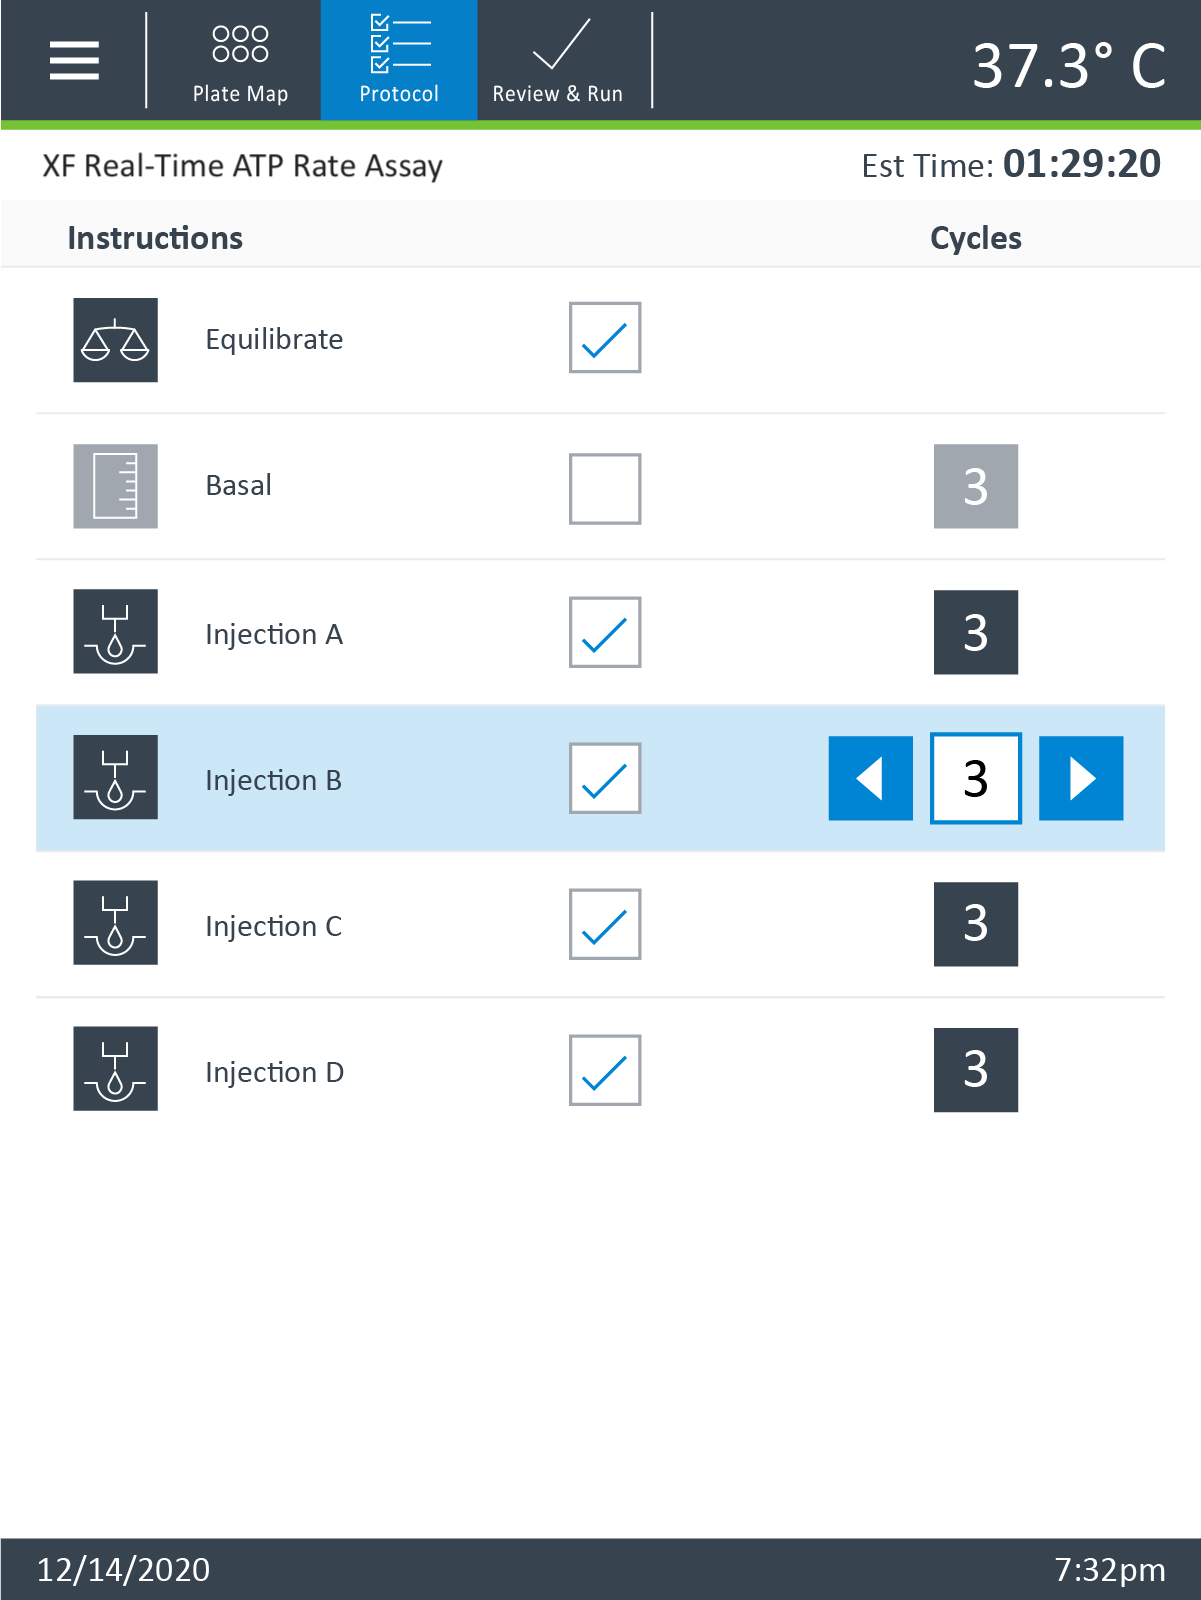
- Touch the right arrow (lower-right corner) to review or edit the instrument protocol.
- Press Edit next to Assay Name to customize the name of your assay result file.
- Press Edit next to Notes to add custom notes related to your assay.
- Press Edit next to Email Notification to notify recipients for user-interaction (example – replace utility plate with the cell plate), and to automatically send the assay result file following completion of the assay. This feature requires an active internet connection on the XFp Analyzer.
- Touch Review & Run in the ribbon at the top of the XF HS Mini display to:
- Edit the assay result file name.
- Add notes about the assay.
- Review alert notifications.
- Enter an email address to receive automated notifications from the XF HS Mini Analyzer when user interaction is required, and a copy of the assay result file when the assay has completed. An active internet connection is required for this feature.
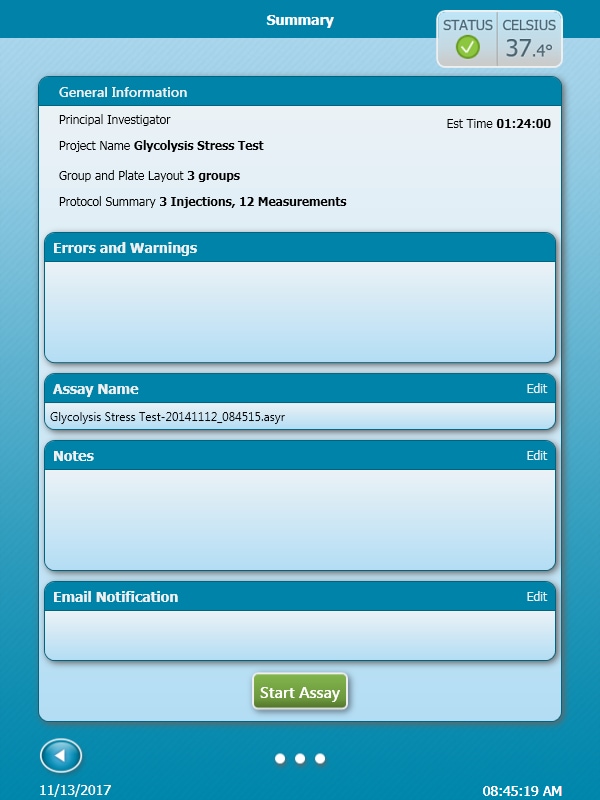
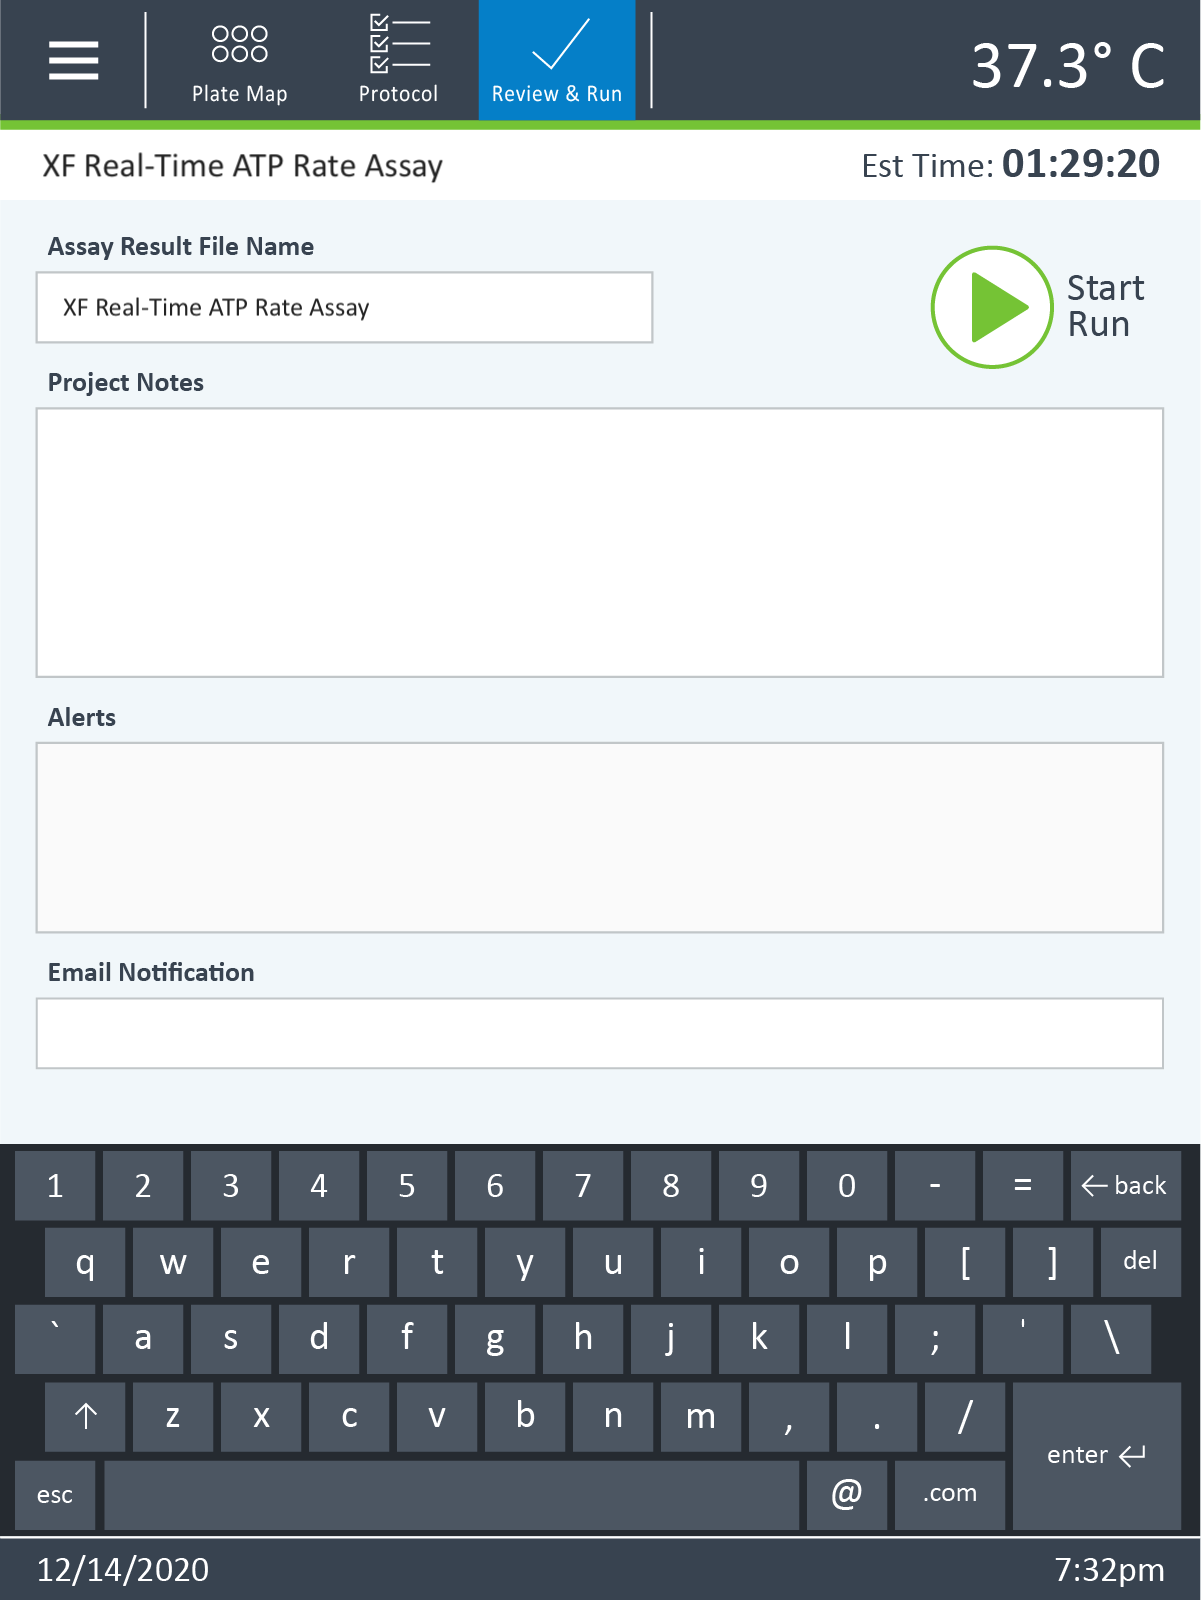
- When ready to begin the XF assay, click Start Assay.
- Place the sensor cartridge (hydrated & loaded with compounds) and utility plate onto the tray when prompted.
Important! Before loading the cell plate, ensure:
- The sensor cartridge fits properly on the Utility plate.
- The lid is removed from the sensor cartridge.
- Proper orientation (direction) of the sensor cartridge on the Utility plate.
- Touch Start Run when you are ready to begin your XF assay.
- Follow the on-screen prompts to load the calibrant utility plate and sensor cartridge (hydrated and loaded with compounds for injection).
Important! Before starting calibration, verify:
- The sensor cartridge fits properly on the calibrant utility plate.
- The sensor cartridge lid has been removed.
- The sensor cartridge + calibrant utility plate are properly positioned on the tray.
Press Close Tray when ready to begin calibration.
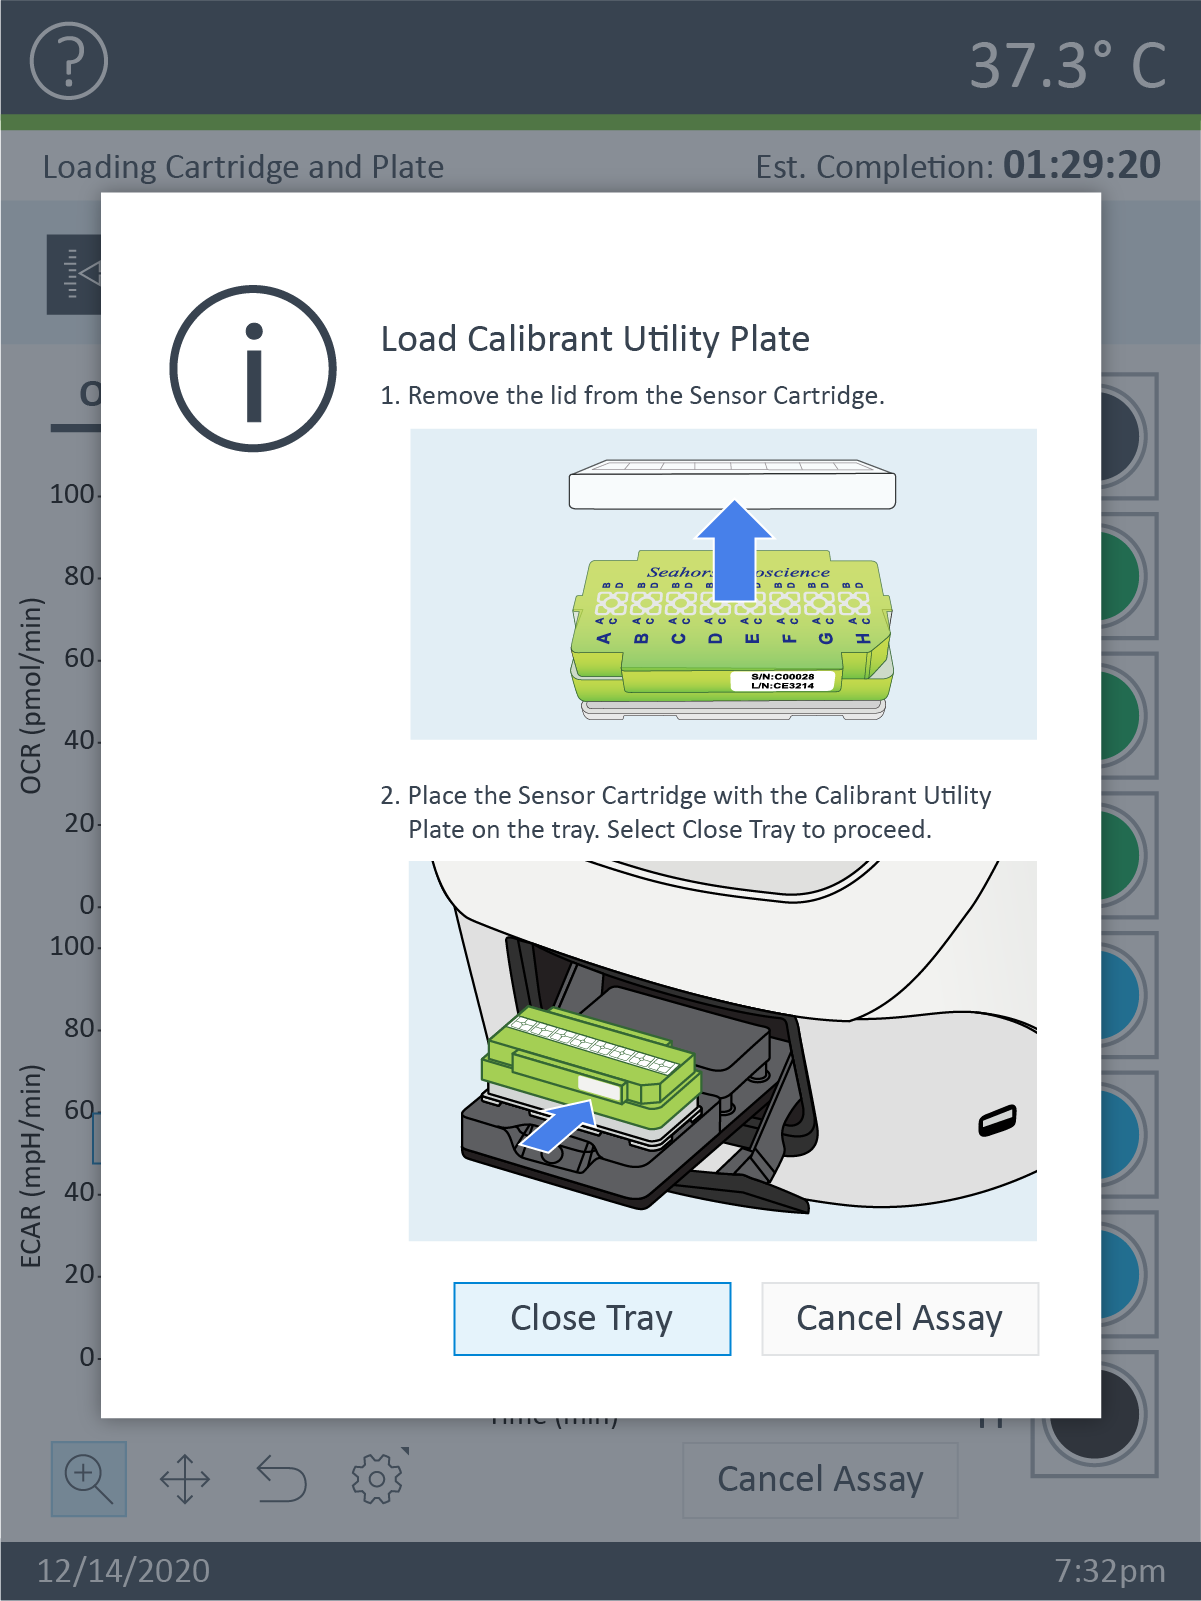
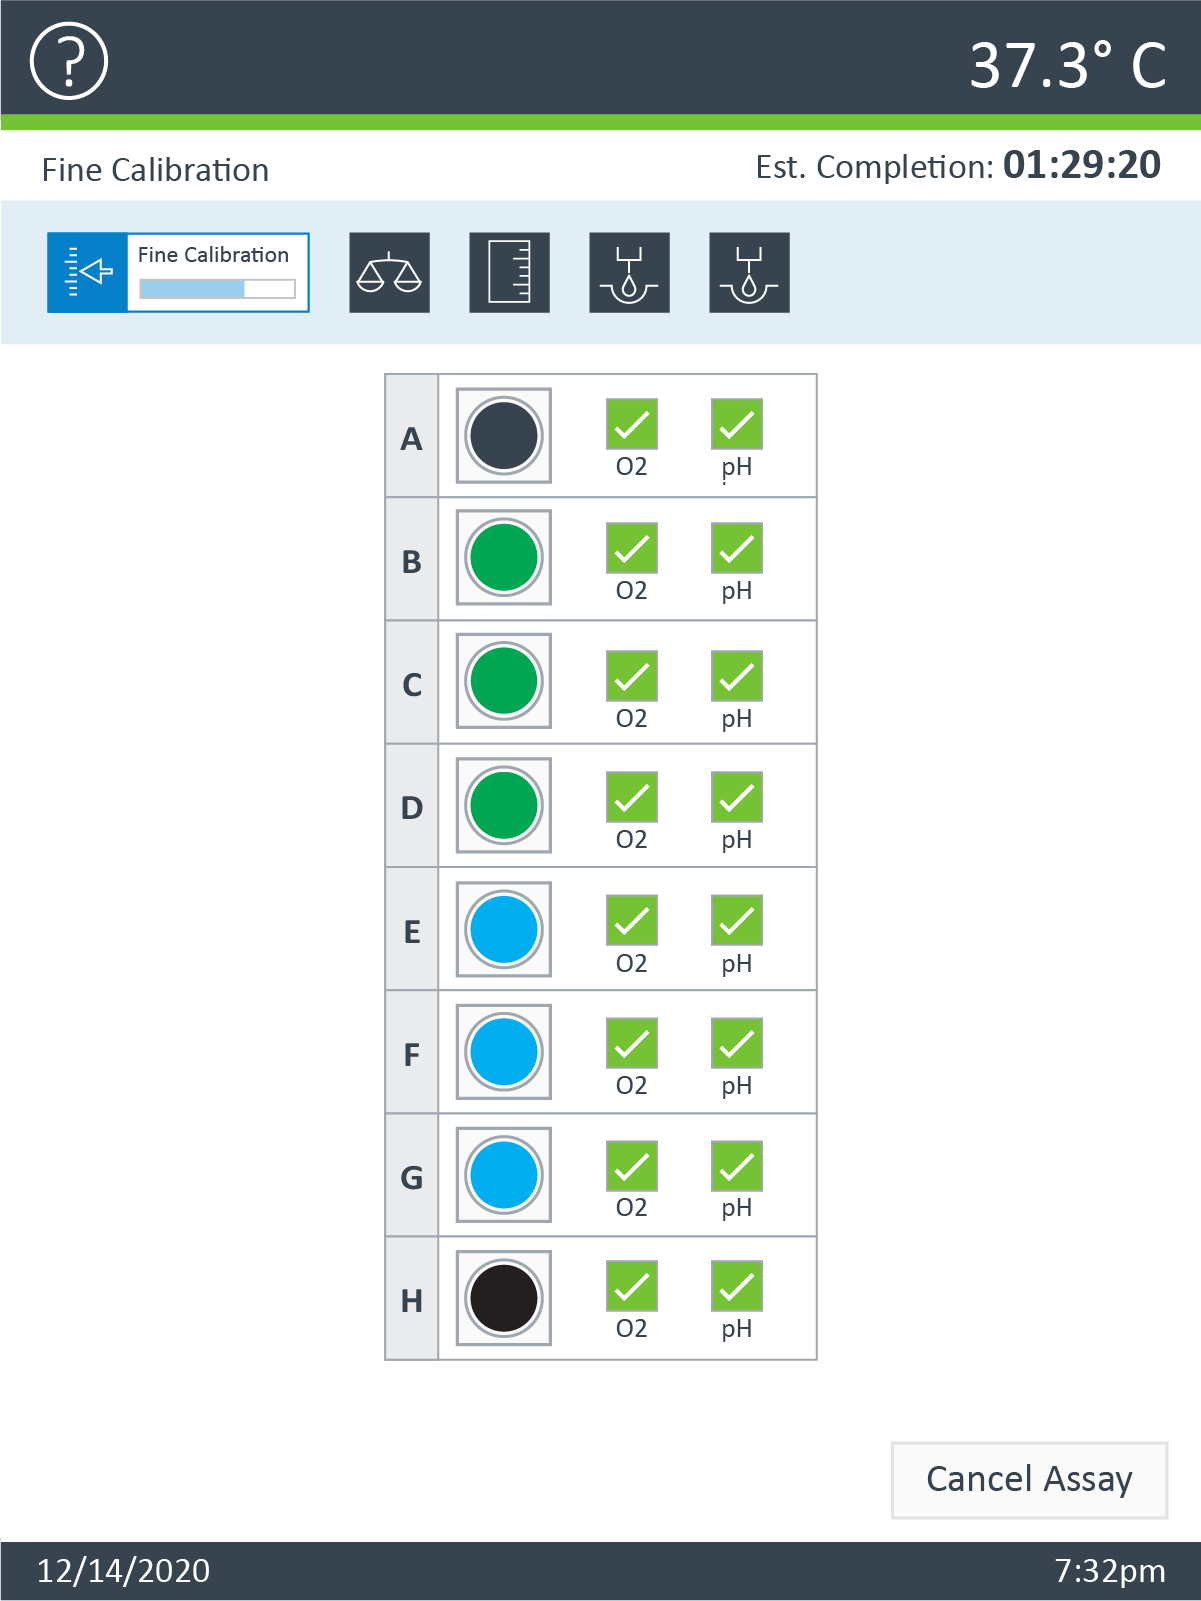
- Once calibration is complete the XFp Analyzer tray will open and present the utility plate. Remove the utility plate and load the cell plate on the tray.
Important! Before loading the cell plate, ensure:
- The lid is removed the Cell Plate.
- Proper orientation (direction) of the Cell Plate on the tray.
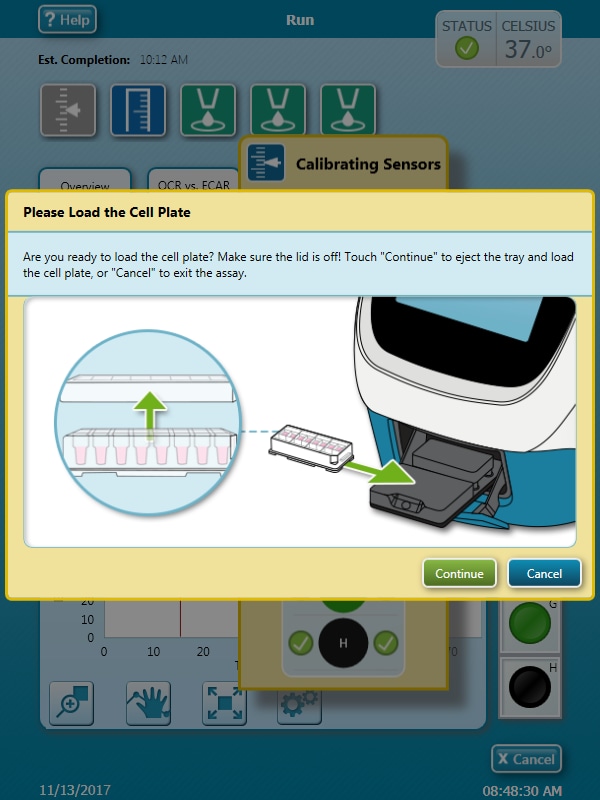
Press Continue when ready to begin your assay.
- Once calibration is complete, press Open Tray to present the calibration utility plate. Remove the calibration utility plate and place the cell plate on the tray.
Important! Before loading the cell plate to start your assay, verify:
- The cell plate lid has been removed.
- The sensor cartridge + calibrant utility plate are properly positioned on the tray.
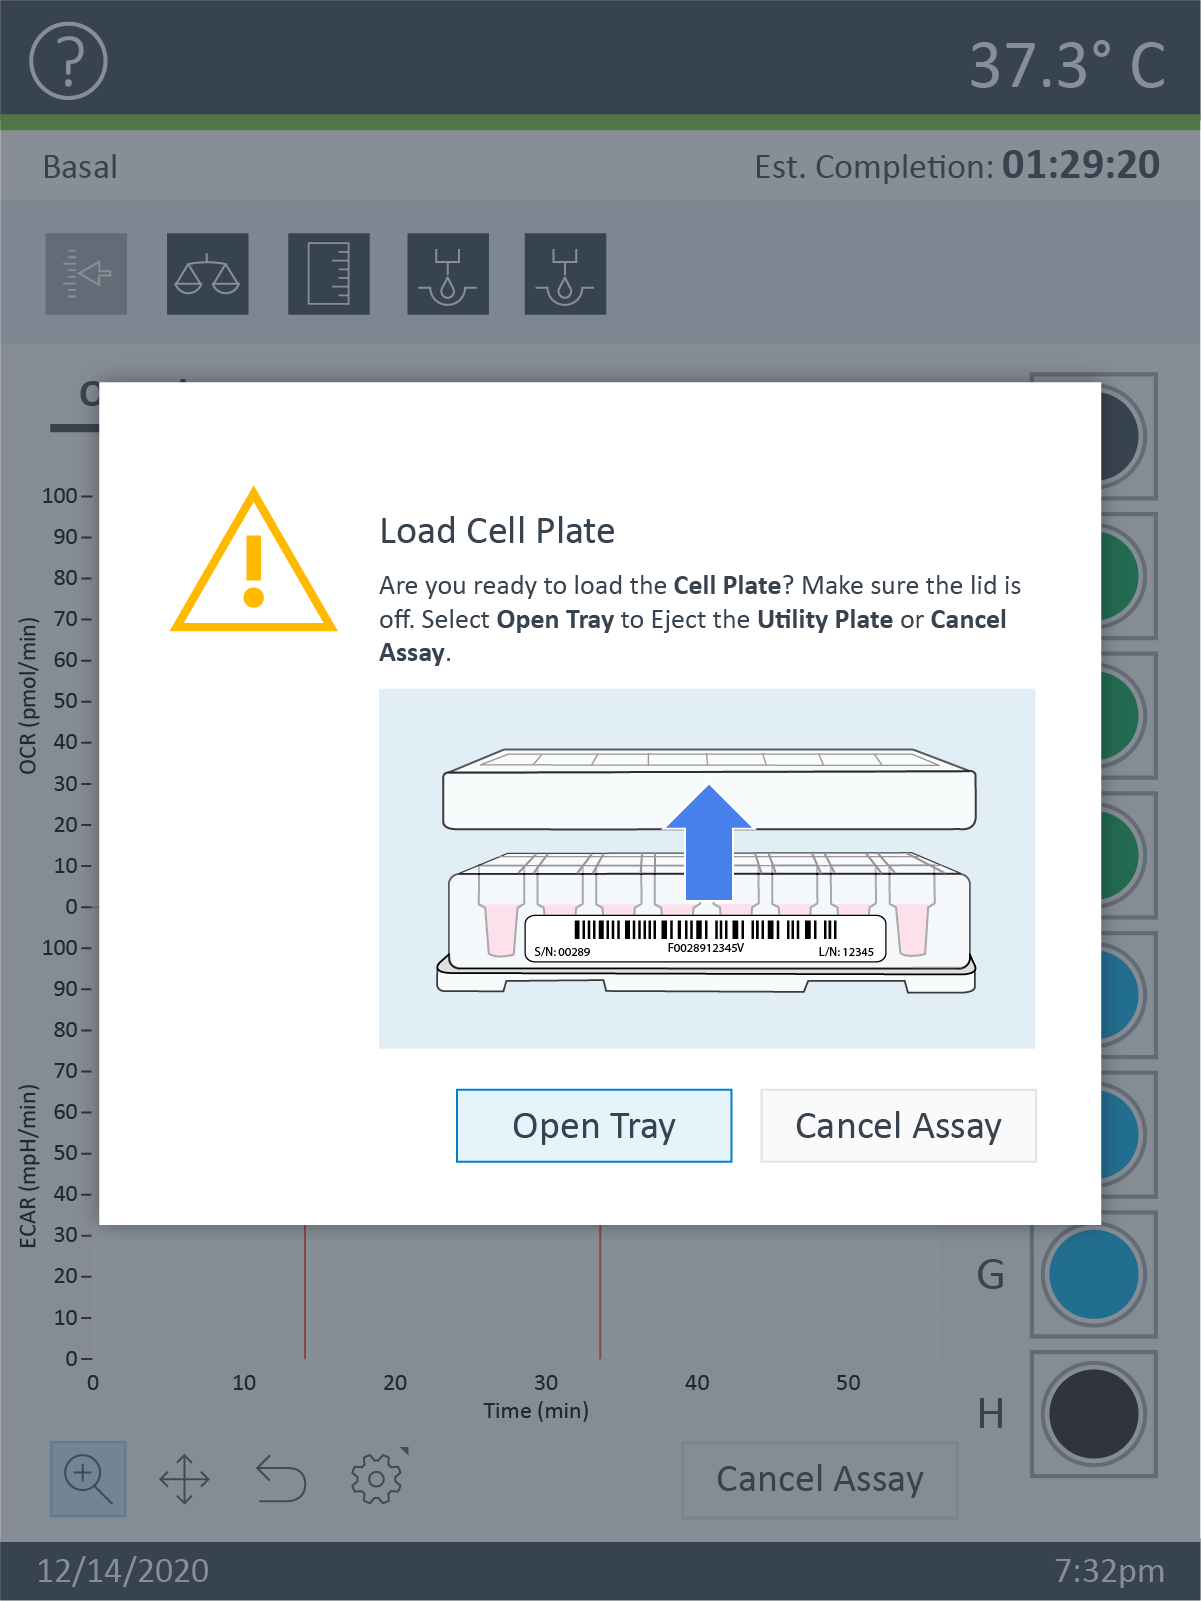
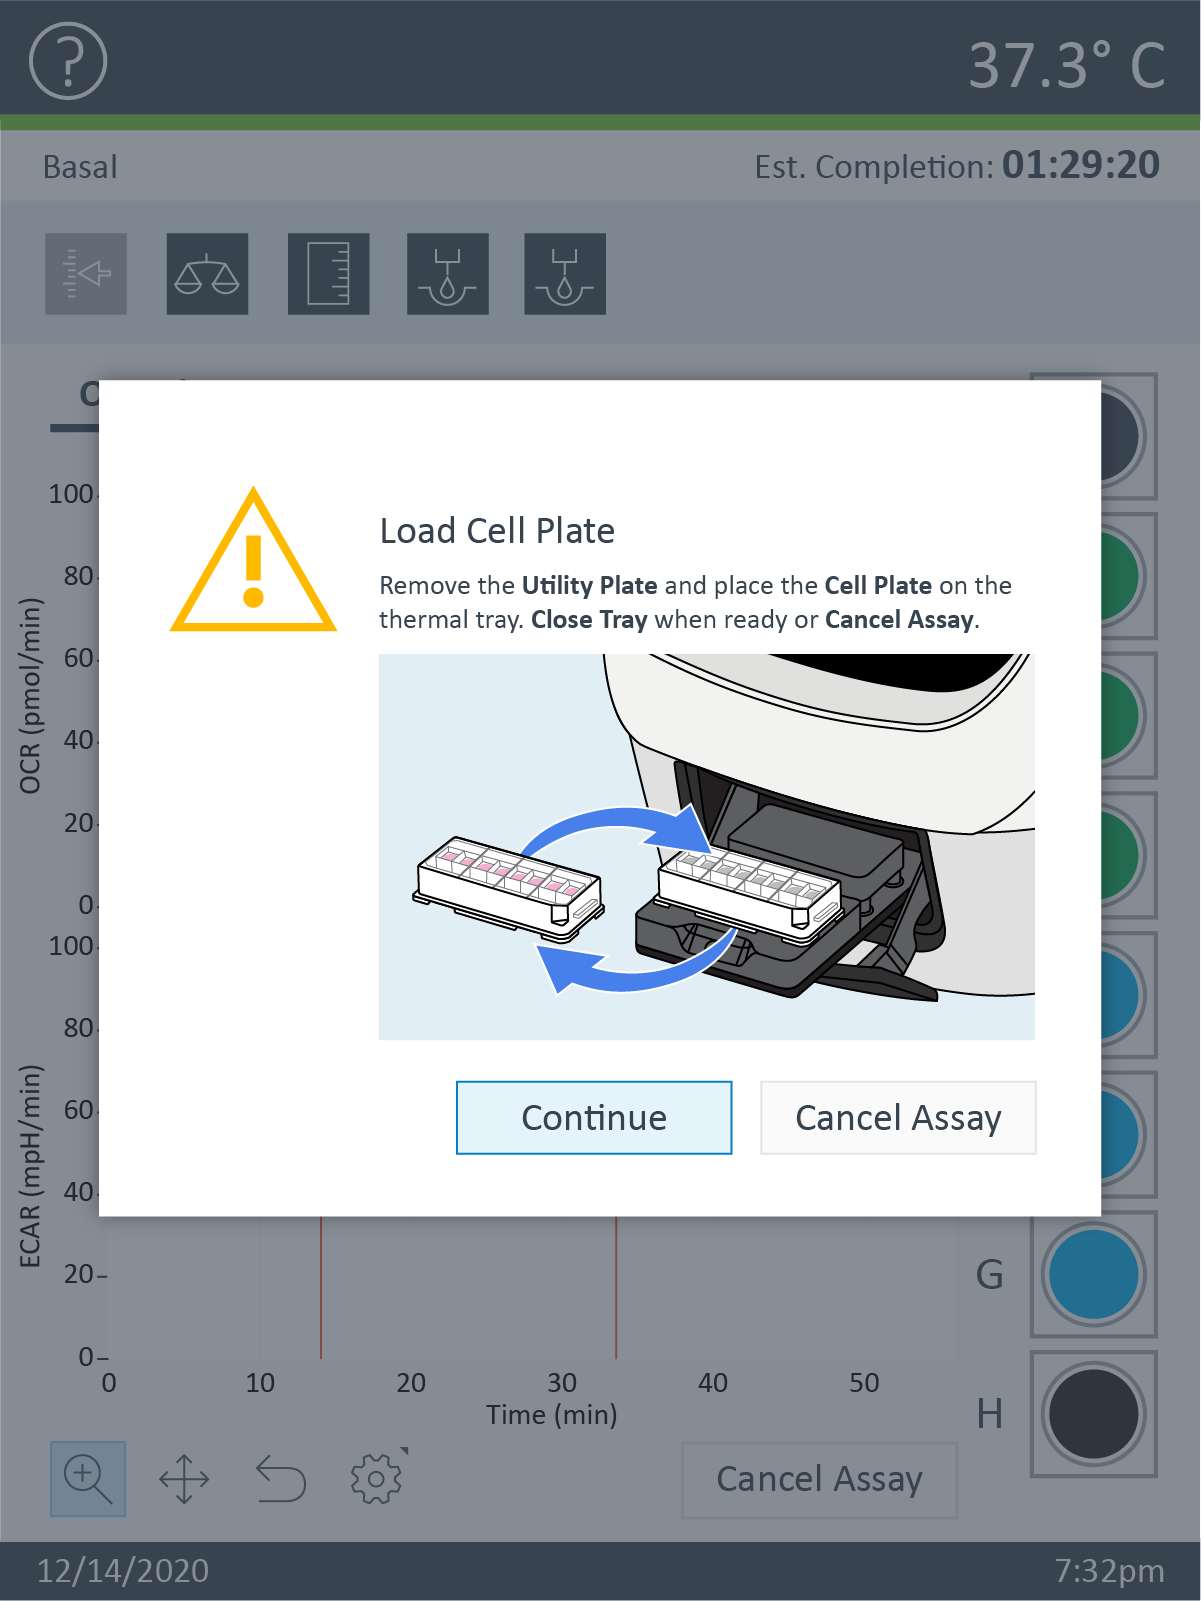
Note: Upon loading the XF HS Miniplate into the XF HS Mini Analyzer the screen will present a reminder to remove the silicone mask. This must be done to prevent interference and possible damage to the instrument.
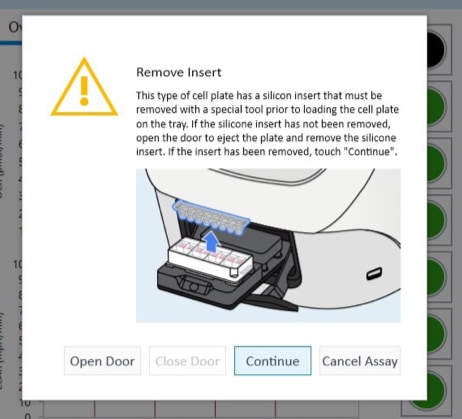
- After placing the Cell Plate on the tray, touch Continue to begin equilibration. After completing equilibration, the assay will automatically begin acquiring baseline measurements (as outlined in your instrument protocol).
- The first step in your assay is called Equilibration. Once Equilibration is complete, the analyzer will start acquiring the first baseline measurement (as defined in your instrument protocol). Above the data display in the center of the view you can see the current and completed commands in your instrument protocol.
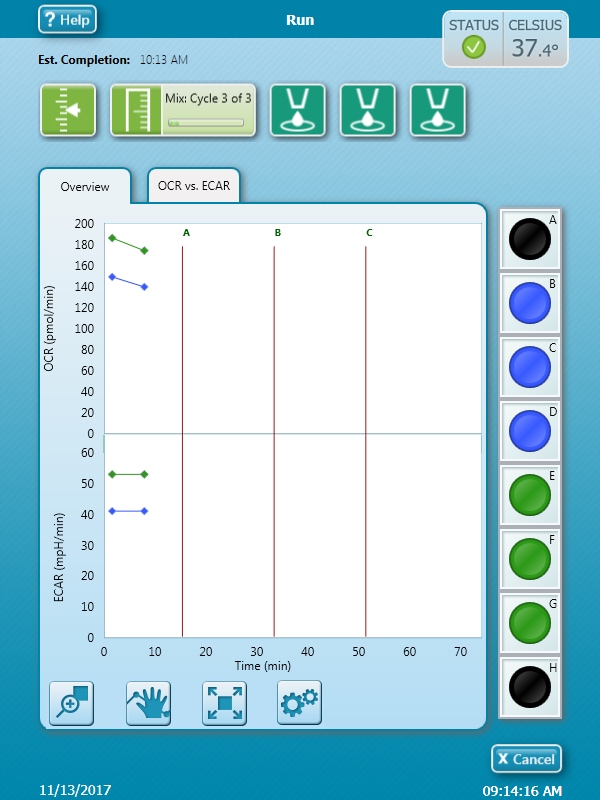
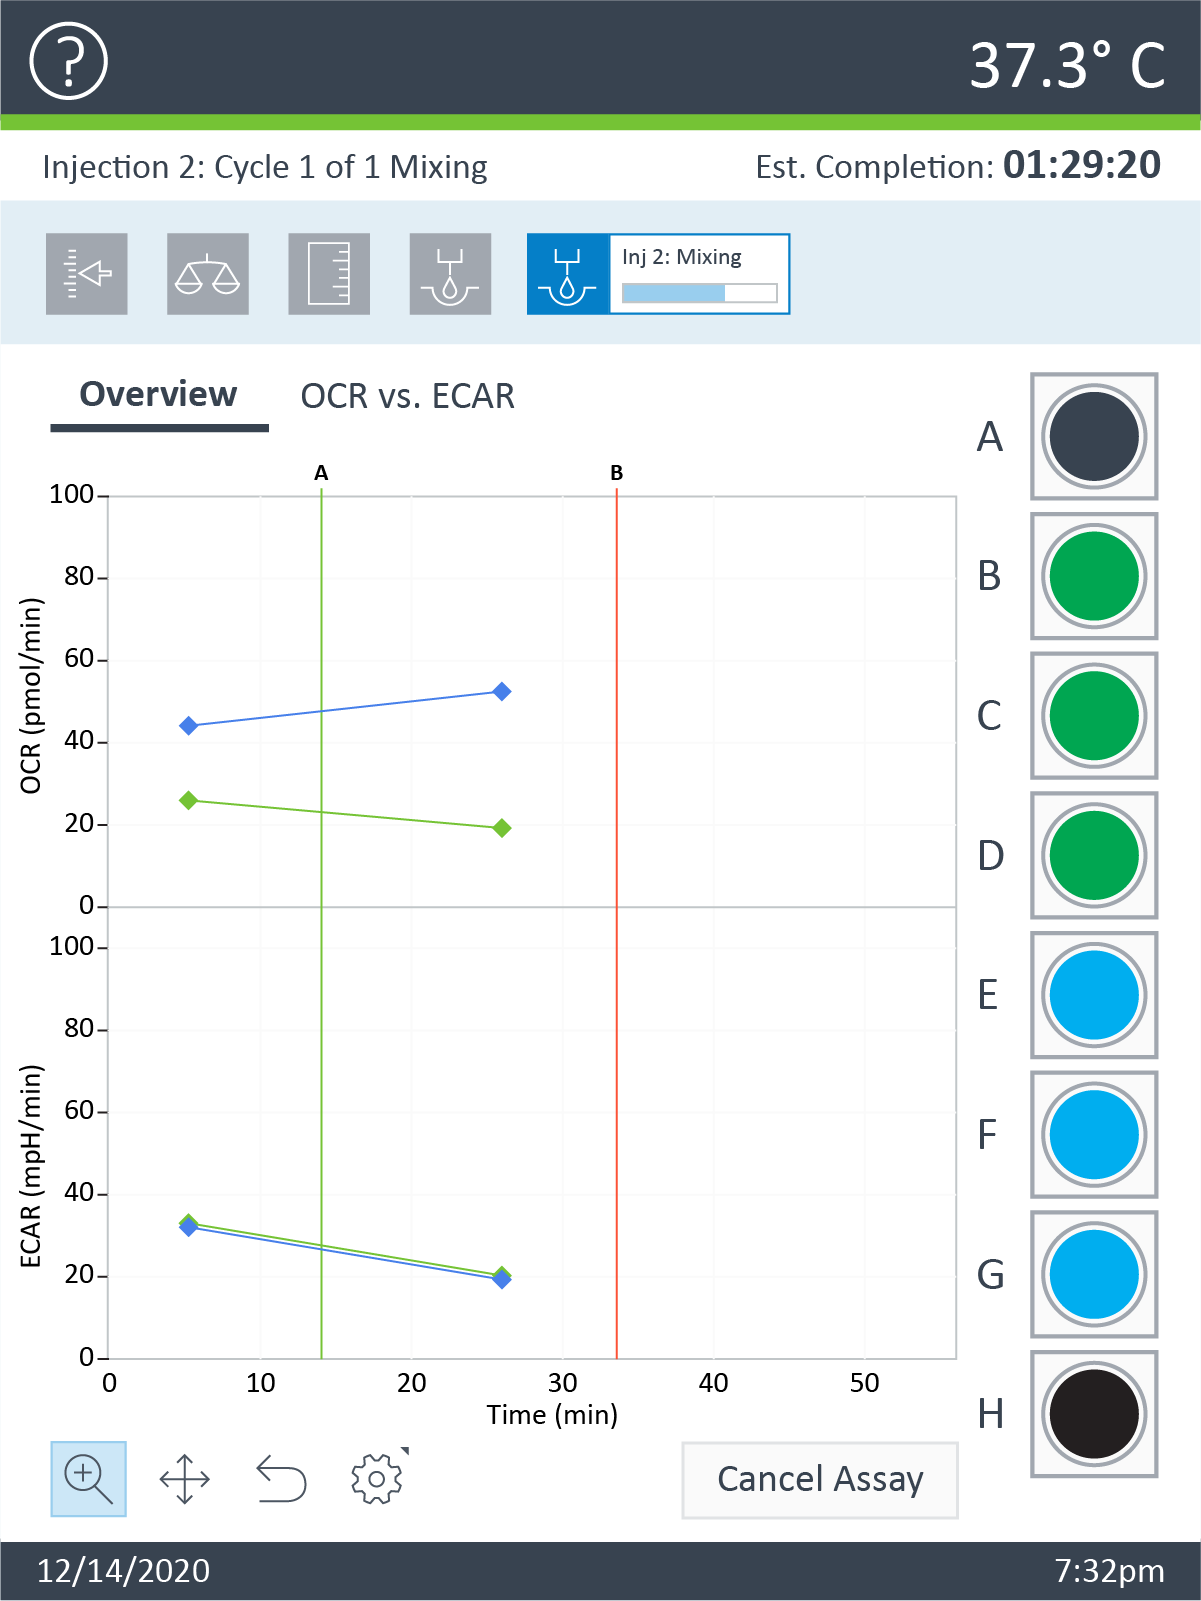
- Once the final measurement command in the instrument protocol is completed, the Remove Plate and Cartridge dialog will appear. Click Continue to eject the sensor cartridge and cell plate. Set aside for later analysis if necessary (example - cell count normalization).
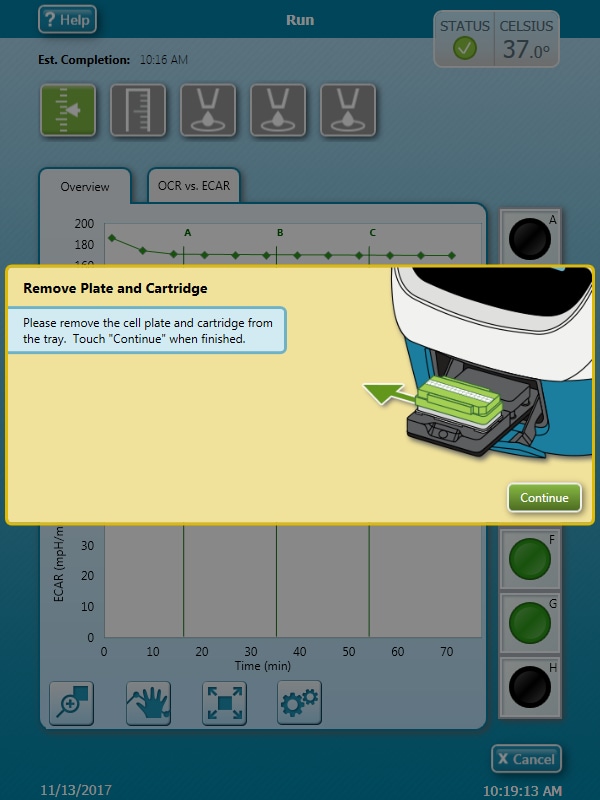
- Once the final measurement in your instrument protocol has completed, press Eject to eject the sensor cartridge and cell plate from the XF HS Mini. When the tray is fully ejected, remove the sensor cartridge and cell plate from the tray and set aside for additional analysis if necessary (example - cell count normalization). Press Continue to close the tray.
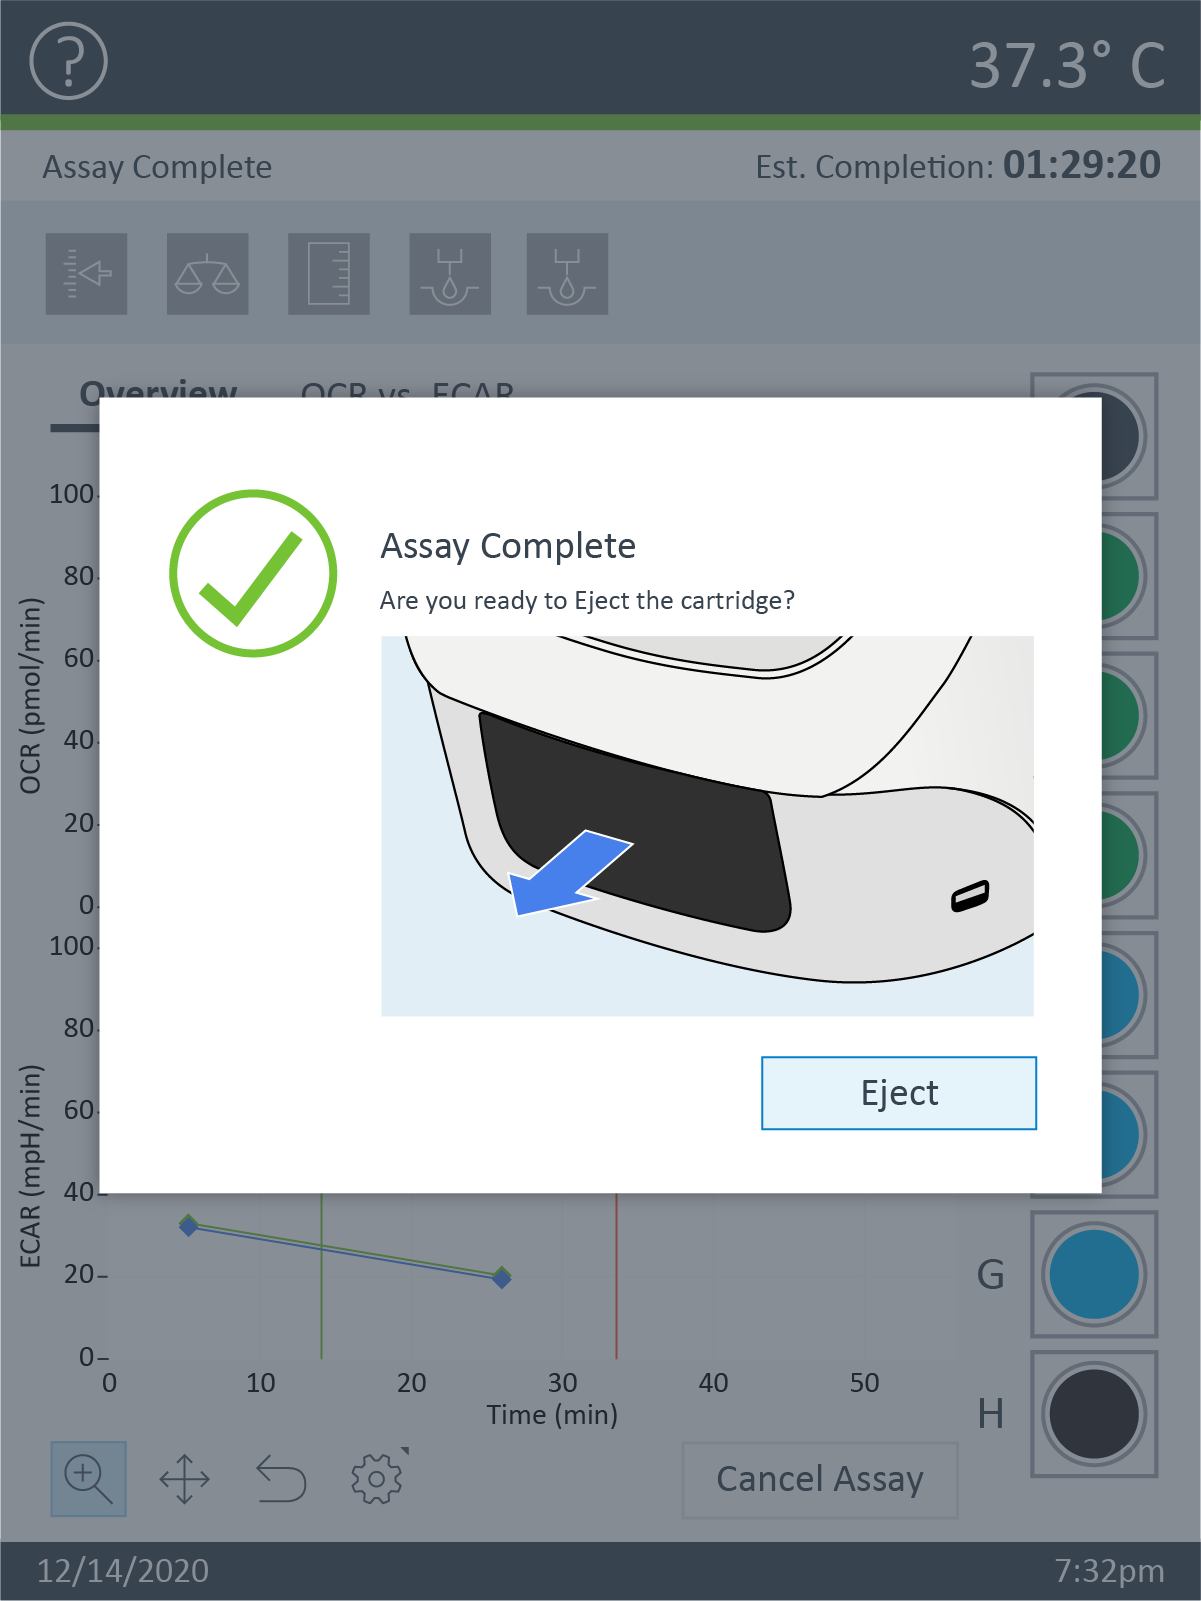
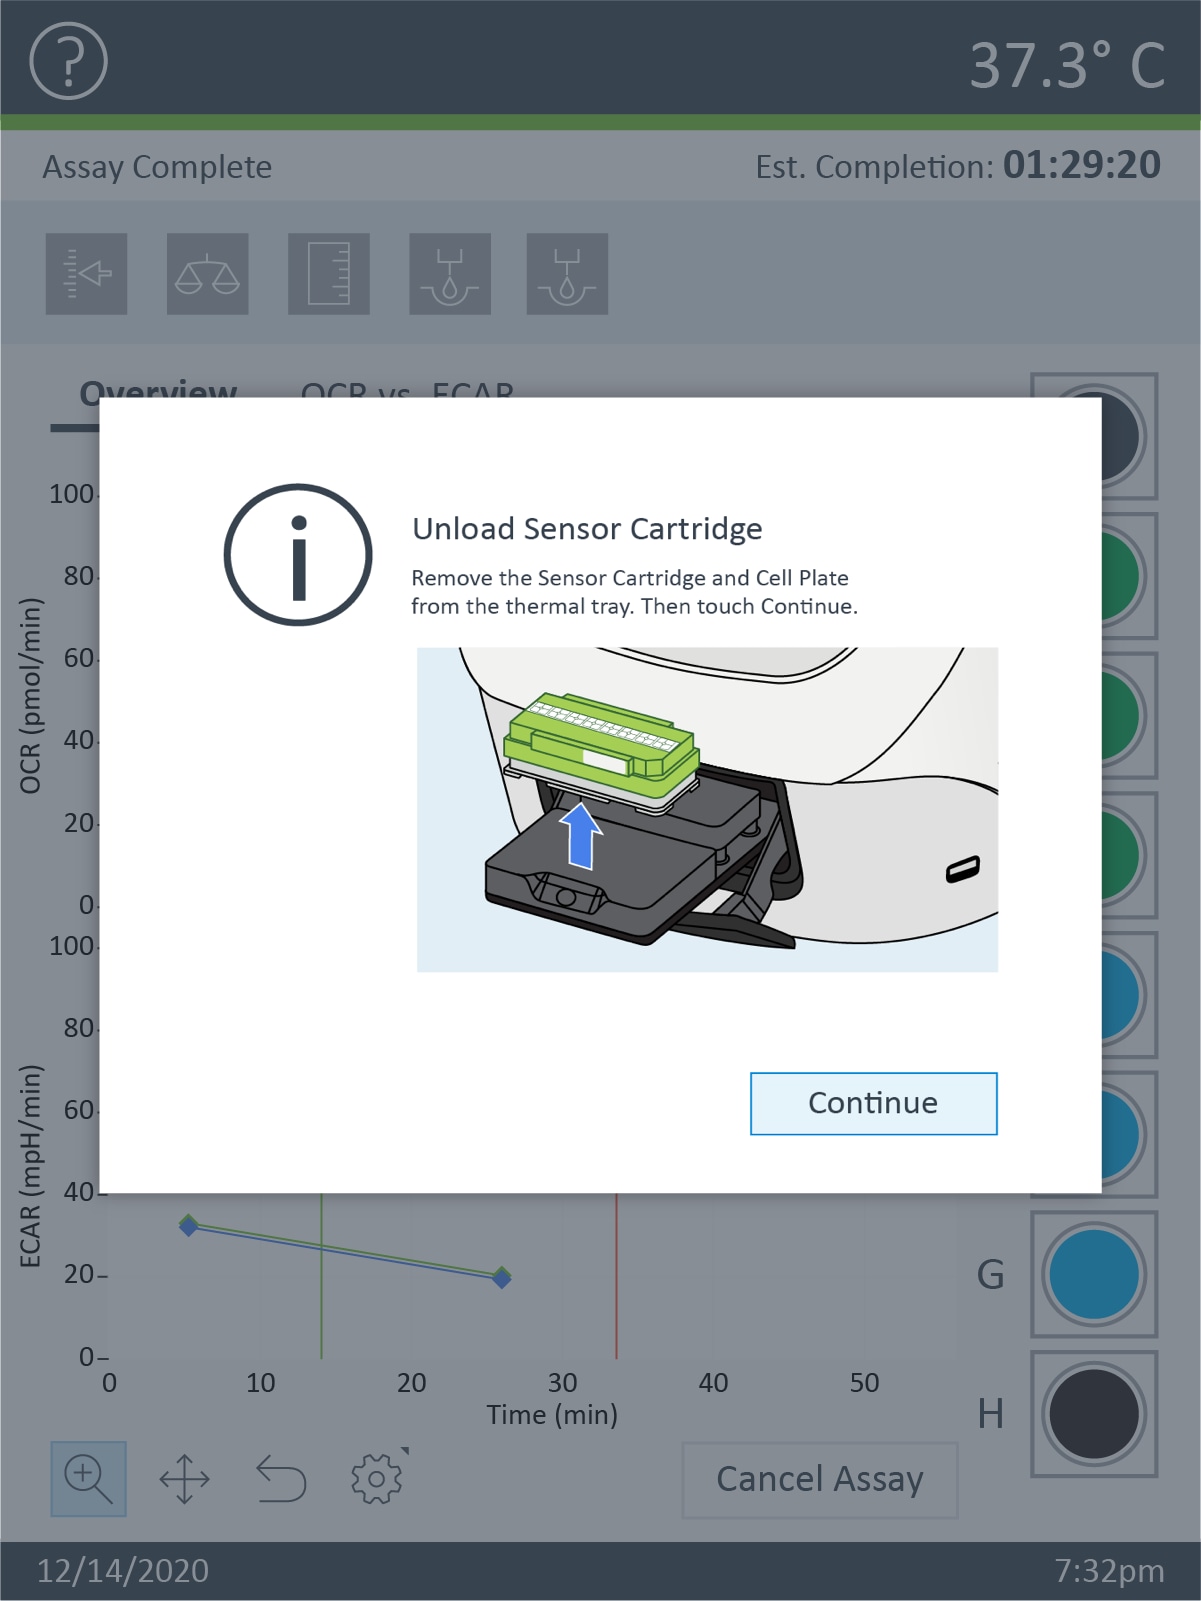
- Save or transfer the assay result file to a shared network drive or USB drive and open using Wave Desktop software on your PC for data analysis.
- Choose a location (USB or Network) to save your assay result file and other data file formats from the XF HS Mini, then click OK. Log-in to your Seahorse Analytics account and upload your XF HS Mini assay result file for data analysis.
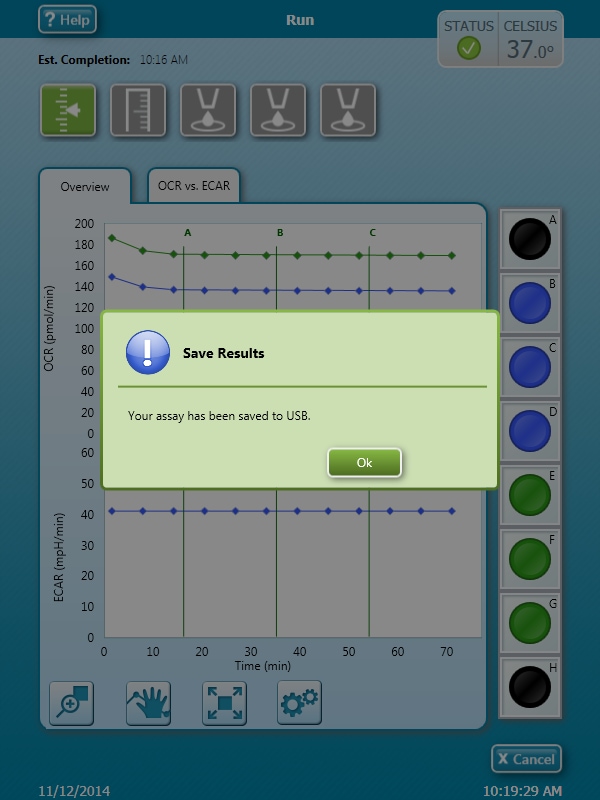
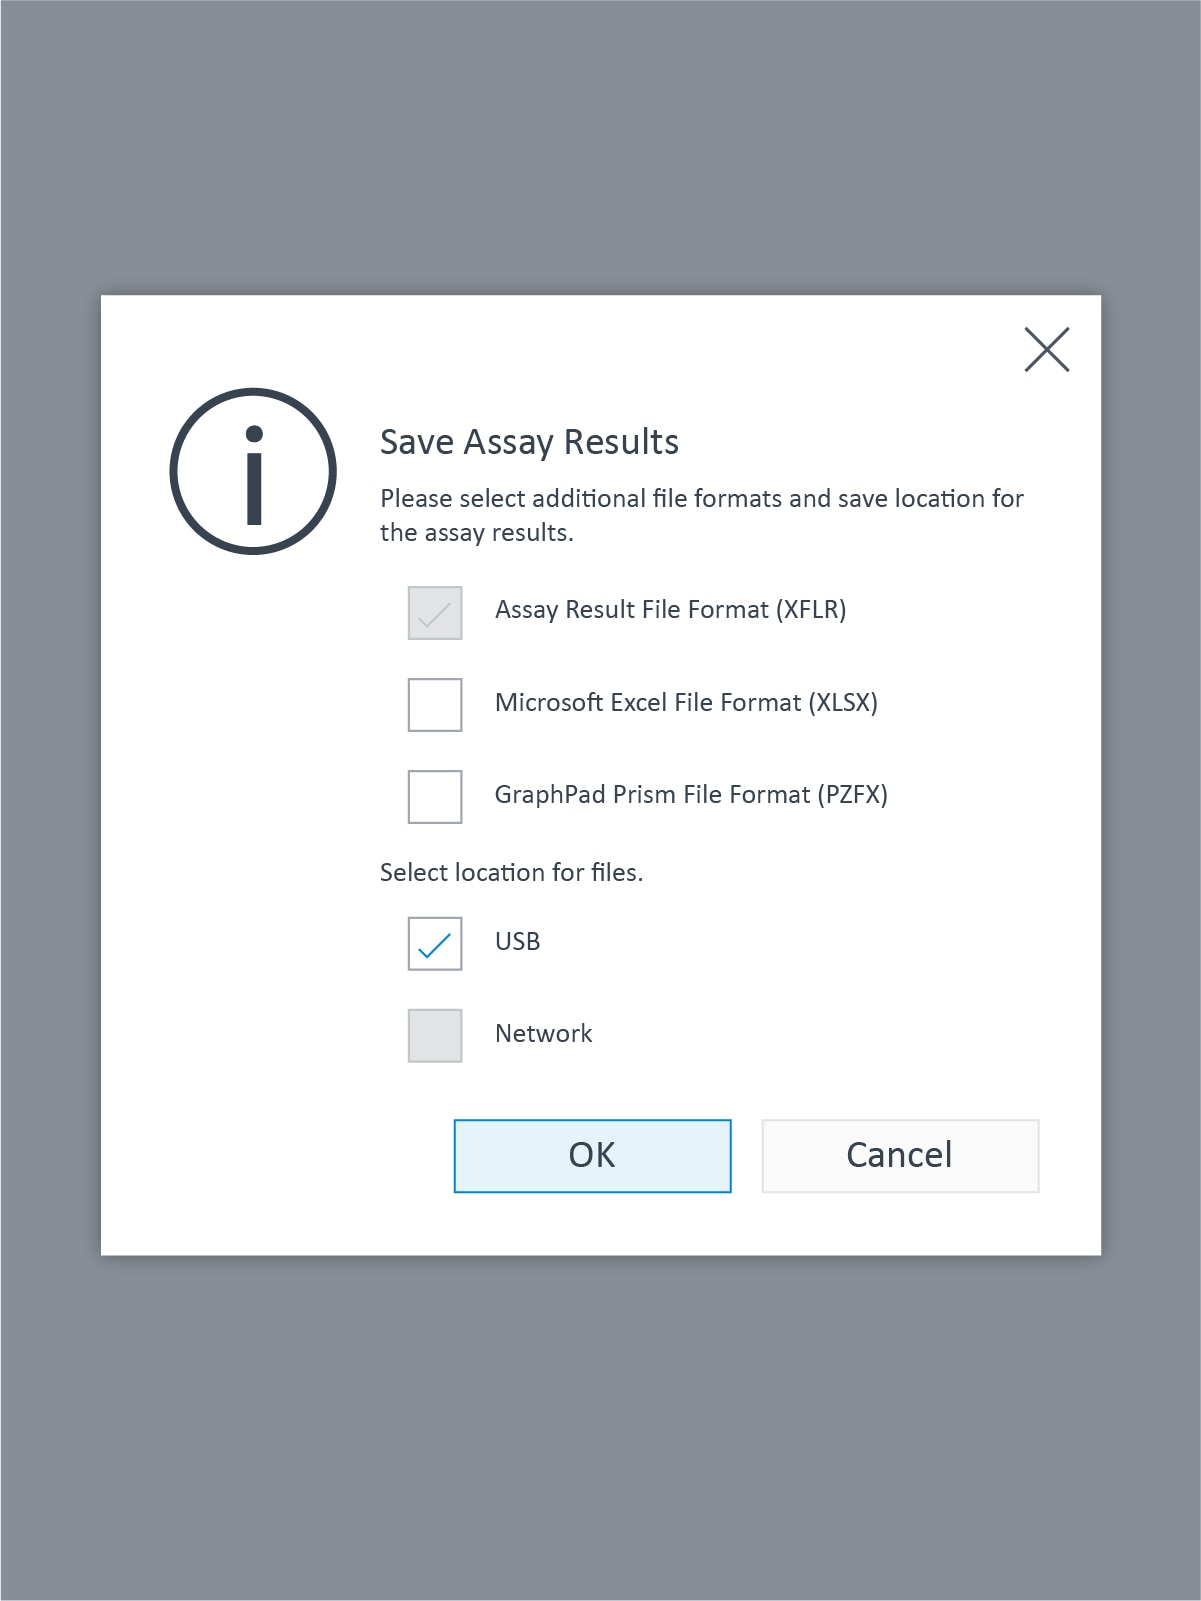
Related Support Material
- XF24 Software ReadMe Installation Guide
- XF96 Software ReadMe Installation Guide
- XFp Extracellular Flux Analyzer User Guide
- XF HS Mini Extracellular Flux Analyzer User Guide
- XFp Network Setup Guide
- XF HS Mini Network Setup Guide
- Wave User Guide
- XFe Network Guide
- Agilent Seahorse XF Real Time ATP Rate Assay Templates
- How to analyze Agilent XF Real-Time ATP Rate Assay result data
- Technical Overview: Characterizing Your Cells - Using OCR Values to Determine Optimal Seeding Density
- Technical Overview: Characterizing Your Cells - Using OCR Values to Determine Optimal Seeding Density
- Seahorse XF HS Mini Software Update (February 2021)
- Agilent Seahorse XF Pro Analyzer Operating Manual
- Agilent Seahorse Wave Pro and XF Pro Controller Software User Guide
Showing only information for the Seahorse Seahorse XF Pro
Change instrument type5. Analyze XF Assay Results
In the Analyze XF Assay Results section, you will learn the basics of Agilent Seahorse Analytics and how to use Seahorse Analytics to analyze your XF Real-Time ATP Rate assay result file. While Wave Pro, XF Pro Controller, and Seahorse Analytics softwares can all be used to analyze results, XF Pro Controller and Wave Pro softwares only provide a subset of the analysis functions available in Seahorse Analytics. If you are looking for help content for XF Pro Controller and Wave Pro softwares, click here. If you are looking for help content for Wave Desktop and Report Generators, please click here.
Seahorse Analytics is a web-based software application that provides desktop-like interactivity with an easy-to-learn interface, allowing you to analyze result data from your Agilent Seahorse XFe, XFp, and XF HS Mini Analyzer from any computer, from anywhere in the world. As long as you have internet access, you can analyze your Seahorse data with Seahorse Analytics.
Select a topic below to learn more:
5.1 Introduction & File Upload
5.1 Introduction
5.1 Introduction & File Upload
Agilent Seahorse Analytics is the go-to data analysis software for your Seahorse Analyzers Analyzer, enabling you to easily import, analyze, report, and share your results with your team or collaborators.
Agilent Seahorse Analytics is a web-based data analysis software for your Seahorse XF Analyzer, enabling you to easily import, analyze and share your results from any computer with internet access.
Basic information about Agilent Seahorse Analytics:
| Specification | Detail |
|---|---|
| Used For | Data analysis |
| Seahorse Data File Compatibilty | XFe96 assay result file |
| XFe24 assay result file | |
| XFp assay result file | |
| XF HS Mini assay result file | |
| Internet Browser Compatibility | Google Chrome |
| Safari | |
| Mozilla Firefox | |
| Microsoft Edge Use of Internet Explorer is strongly discouraged |
|
| Export Options | Microsoft Excel (.xlsx) |
| Graphpad Prism (.pzfx) | |
| Image File (.JPG and .PNG) |
| Specification | Detail |
|---|---|
| Internet Browser Compatibility | Google Chrome |
| Safari | |
| Mozilla Firefox | |
| Microsoft Edge Use of Internet Explorer is strongly discouraged |
|
| Export Options | Microsoft Excel (.xlsx) |
| GraphPad Prism (.pzfx) | |
| Image File (.JPG and .PNG) |
Getting familiar with the Seahorse Analytics User Interface
Home View:
After you register and/or log-in to your Seahorse Analytics account, you will find yourself on the Home view (pictured below). To get back to the Home view, click the Home button in the upper-left corner of the dark blue navigation ribbon.
- The data files list on the Home view displays the most recent five (5) files you have imported, edited, and/or accepted from a file share.
- Below the files list, you will see My Analyzers, where you can assign one or more Seahorse XF Analyzers to your profile.
- To import a data file from the Home view, click the small File Upload button in the upper-right corner above the files list.
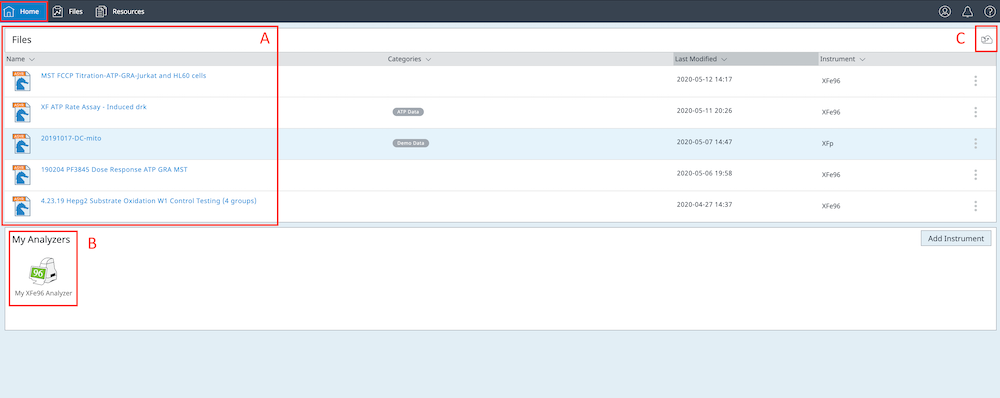
Files View:
Click the Files button in the upper-left corner of the dark blue ribbon at the top of the application to display all data files you have imported to your Seahorse Analytics account.
- On the left of the Files view, you will see any custom folders you have created for your account.
- The list of files and accompanying file meta data (i.e. last modified date, instrument type, etc.) is seen in the middle of the Files view.
- In the upper-right corner of the Files view, you will see the File Upload button, allowing you to import data files to your account. You will find the Create Folder button, which will create a new custom folder you can assign data files to. You will also find a search field that allows you to perform keyword searches of the data files in your account. The search function looks for keyword matches in the file name, categories, last modified date, and instrument type.
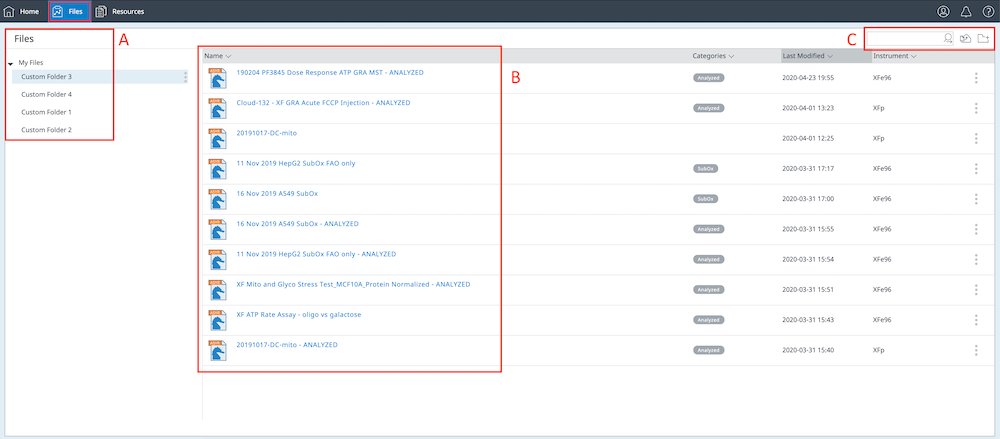
Resource View:
Click Resources in the top-level dark blue ribbon to access a collection of frequently used resources to support your Agilent Seahorse XF assay workflow and contact information for the Agilent Cell Analysis support team.

Settings and User Information:
Click the small user account icon in the upper-right corner of the dark blue top navigation bar to manage your user account information, or logout.
Click the Settings and User Data link to display account management options, which include:
- Checking the amount of free space to store data files, view the Agilent Privacy Policy, or delete your Seahorse Analytics account.
- Renaming or deleting your custom analysis views.
- Changing your Seahorse Analytics account password.
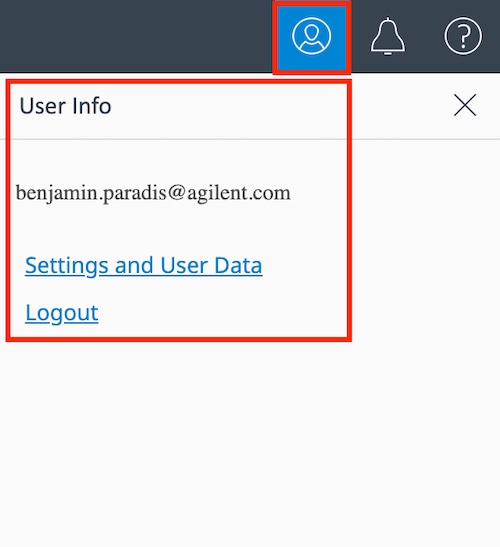
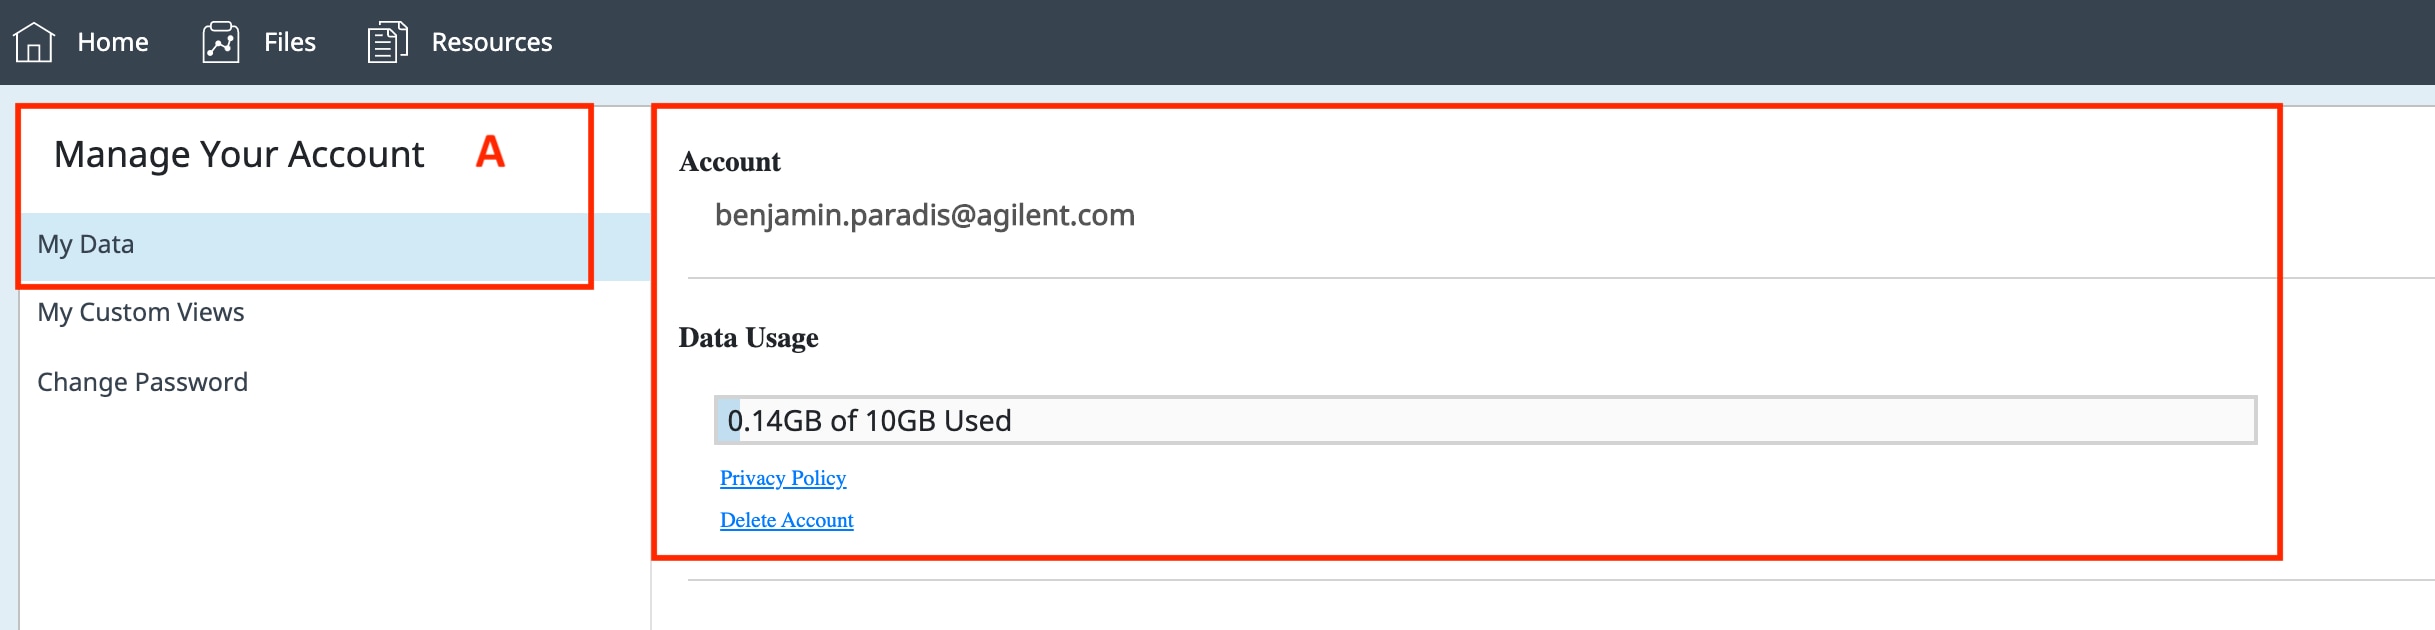
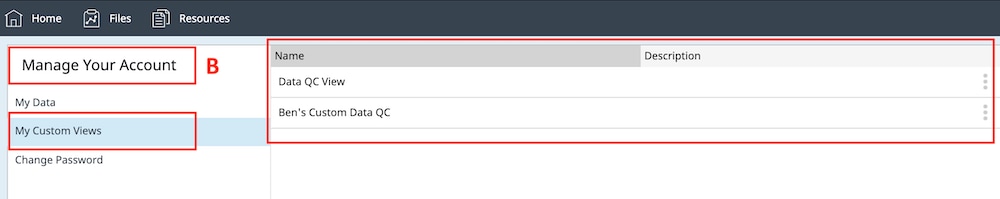
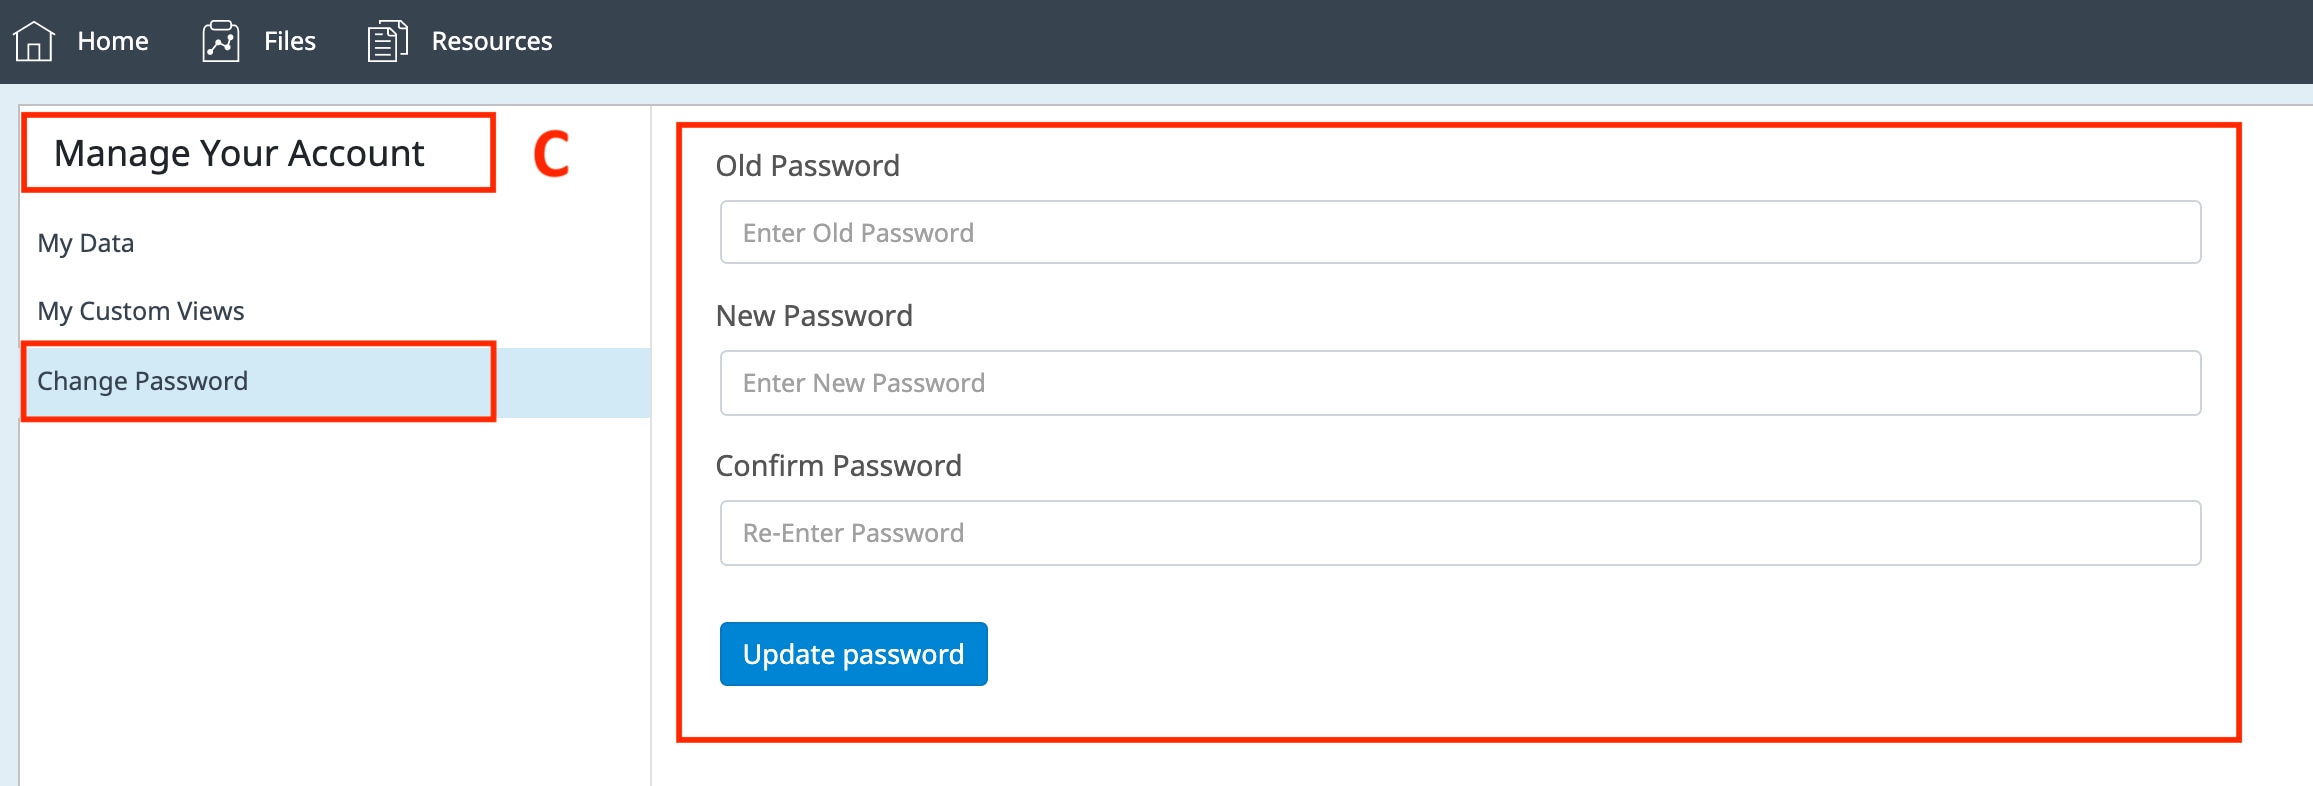
Notifications:
Click the small bell icon in the upper-right corner of the dark blue top navigation bar to display your account notifications. Notifications tell you when someone has shared a data file with you, or a file you shared with another user has been accepted. The notification bell icon will display a small red number that corresponds to the number of pending notifications you have. Please see the Sharing section for more information on how to share and accept data files.
Help:
Click the question mark icon in the upper-right corner of the dark blue top navigation bar to display basic help information. The help information displayed depends on the current screen in the software when you click the Help button. For more information on analysis views, click the Help button while you are on an analysis view. For more information on file management features, click the Help button while you are on the files view.
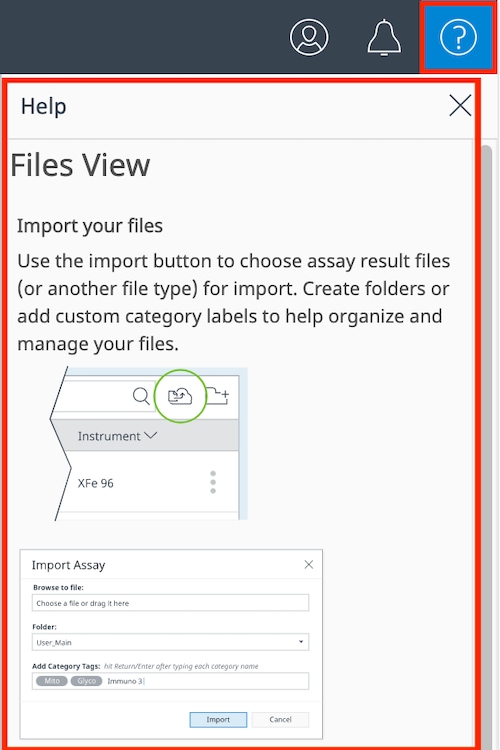
How to import data files
There are two ways to get data files into your account: (1) manually import data files or (2) accepting data files that have been shared with you. You can import data files to your account from both the Home and Files view using the File Upload button in the upper-right corner above the files list on both views.
- Click the File Upload button to display the file upload dialog (pictured on the right).
- Click the Choose a file text to browse to your data file, or if you have file explorer open to your data files, you can drag & drop a file into this region.
- Import one or multiple data files at a time, you can see that 2 data files have been selected for import.
- Choose a custom folder to save the data file in rather than the main files list. You can always move a data file to a custom folder after you have imported it.
- Assign a category label to a data file by typing a new category, or by clicking in the category field to display existing category labels.
How to import data files
There are two ways to get data files into your account: (1) manually import data files or (2) accepting data files that have been shared with you. You can import data files to your account from both the Home and Files view using the upload file button.
- Click the Upload File button.
- Click Browse or if you have file explorer open to your data files, you can drag & drop a file into this region.
- Import one or multiple data files at a time, you can see that 2 data files have been selected for import.
- Choose a custom folder to save the data file in rather than the main files list. You can always move a data file to a custom folder after you have imported it.
- Assign a category label to a data file by typing a new category, or by clicking in the category field to display existing category labels.
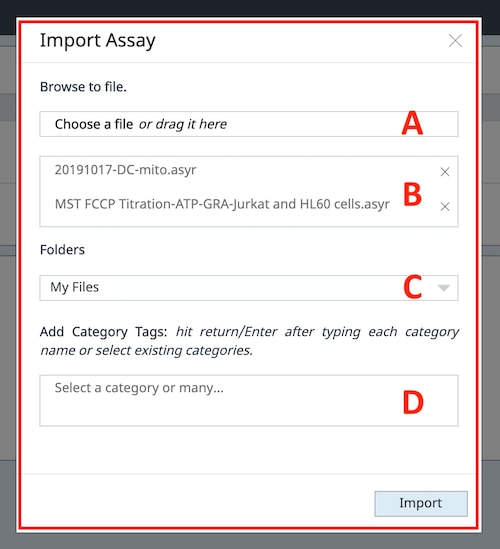
- Click Import
- Seahorse Analytics will confirm a successful file import. When you dismiss this dialog, you will see the imported file(s) are displayed first in the files list.
- Click Upload
- Seahorse Analytics will confirm a successful file import. When you dismiss this dialog, you will see the imported file(s) are displayed first in the files list.
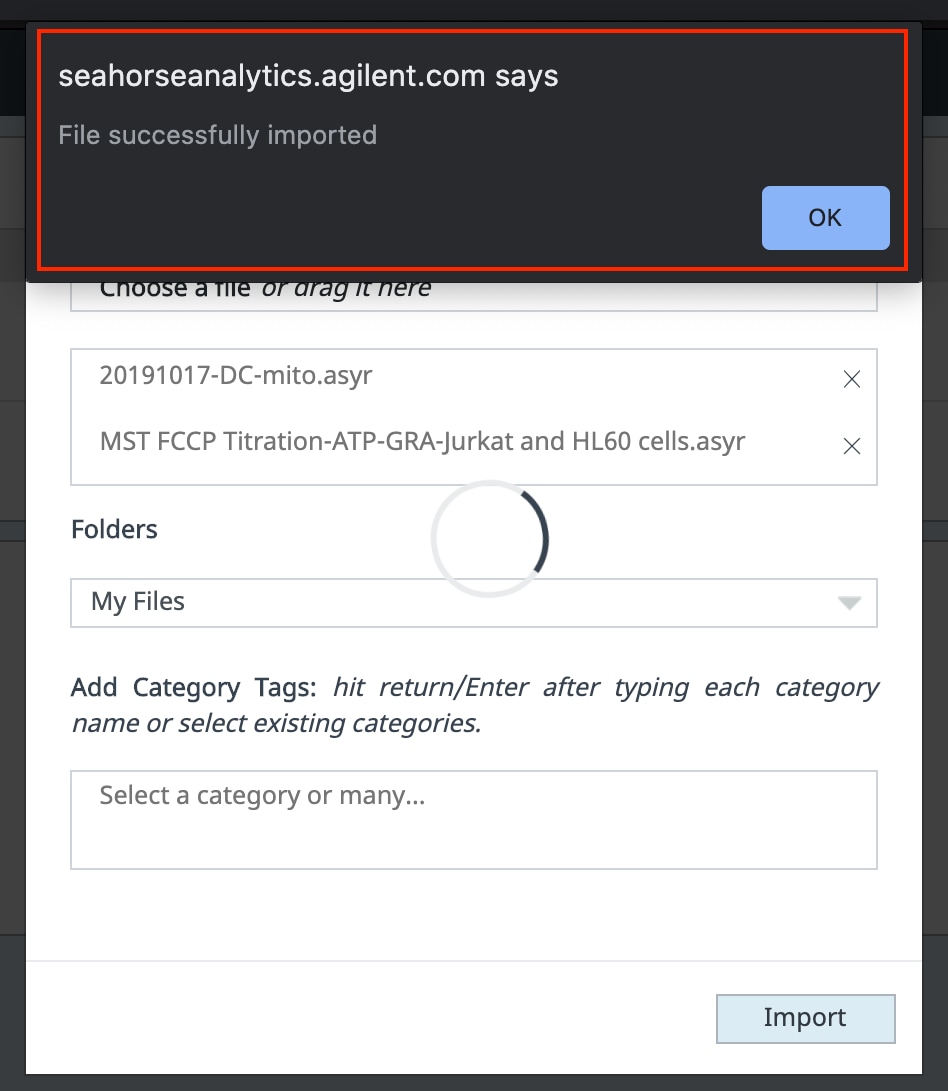
Other file management features:
To the right of each file in your account, you will notice a small 3-dot icon (pictured below).
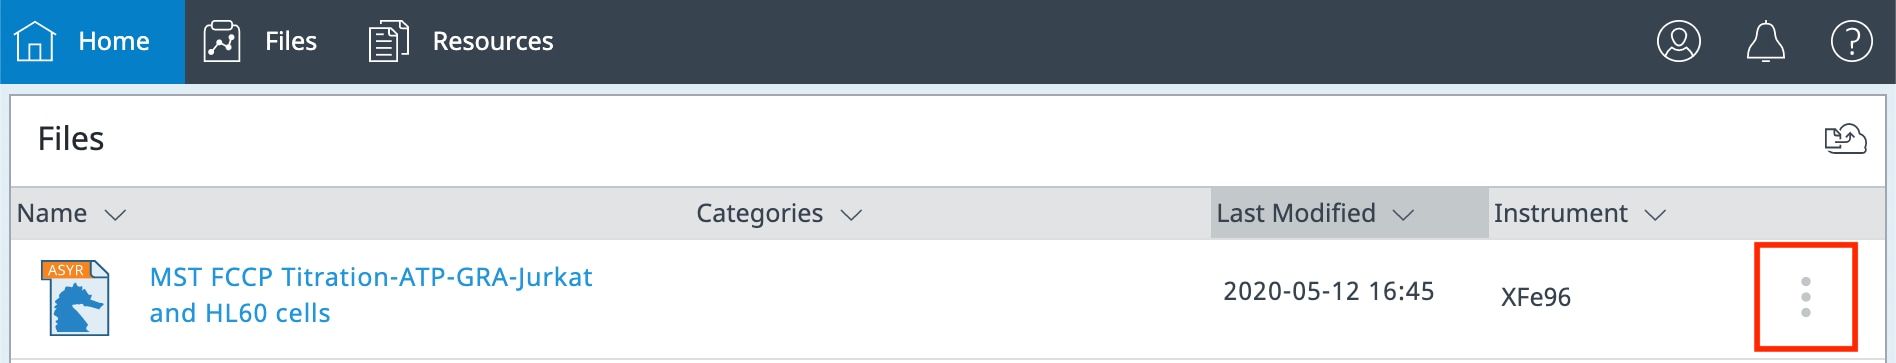
Click this 3-dot button to display a menu of additional file features, which include:
- Send To: Display the share dialog to enter an email address to send the selected file to.
- Delete: Delete the selected file from your account.
- Categories: Add or delete category labels.
- Make a Copy: Create a copy of the selected file.
- Rename: Rename the selected file.
- Move to folder: Move the selected file to a custom folder.
- Export to Excel & GraphPad Prism: Export the data from the selected assay result file to a Microsoft Excel or GraphPad Prism file.
- Download: Download the selected file to your PC.
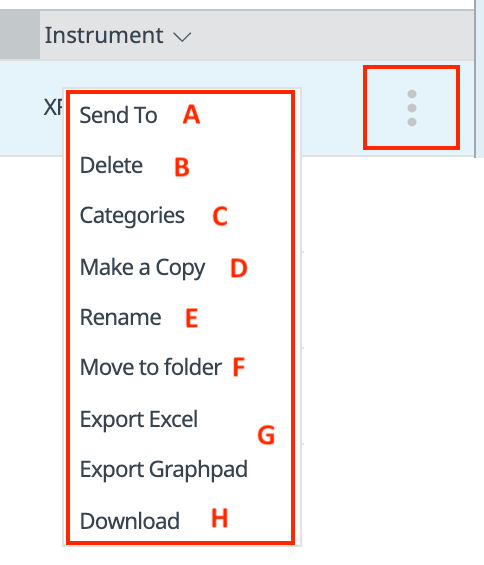
Related Support Material
Reference Material
5.2 Analysis Views
5.2 Types of Data
A Seahorse Analytics analysis view is a collection of widgets (graphs) in a single page. There are 3 different analysis view categories – standard analysis views, custom analysis views, and assay kit companion analysis views.
- The standard analysis view contains basic widget options such as kinetic graph, scatter plot and bar chart, which are used to view OCR, ECAR, PER for a specific rate measurement or series of rate measurements (i.e. kinetic graph).
- The custom analysis view list displays all custom analysis views containing user-selected defined widgets. Any type of widget can be added to a custom analysis view.
- The assay kit companion analysis view list shows analysis views where the widgets on each view represent defined parameters of the selected Agilent Seahorse XF assay kit. The assay kit companion analysis views can be used for data analysis of files generated using respective supported Agilent Seahorse XF assay workflows and protocols.
Expand the Views list to display the list of analysis views applied to an assay result file or to add a new analysis view (pictured below).
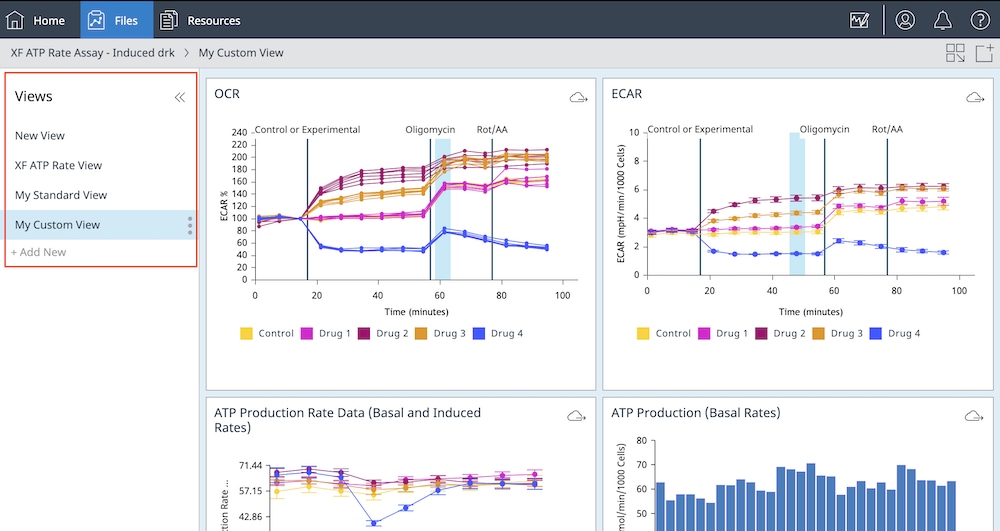
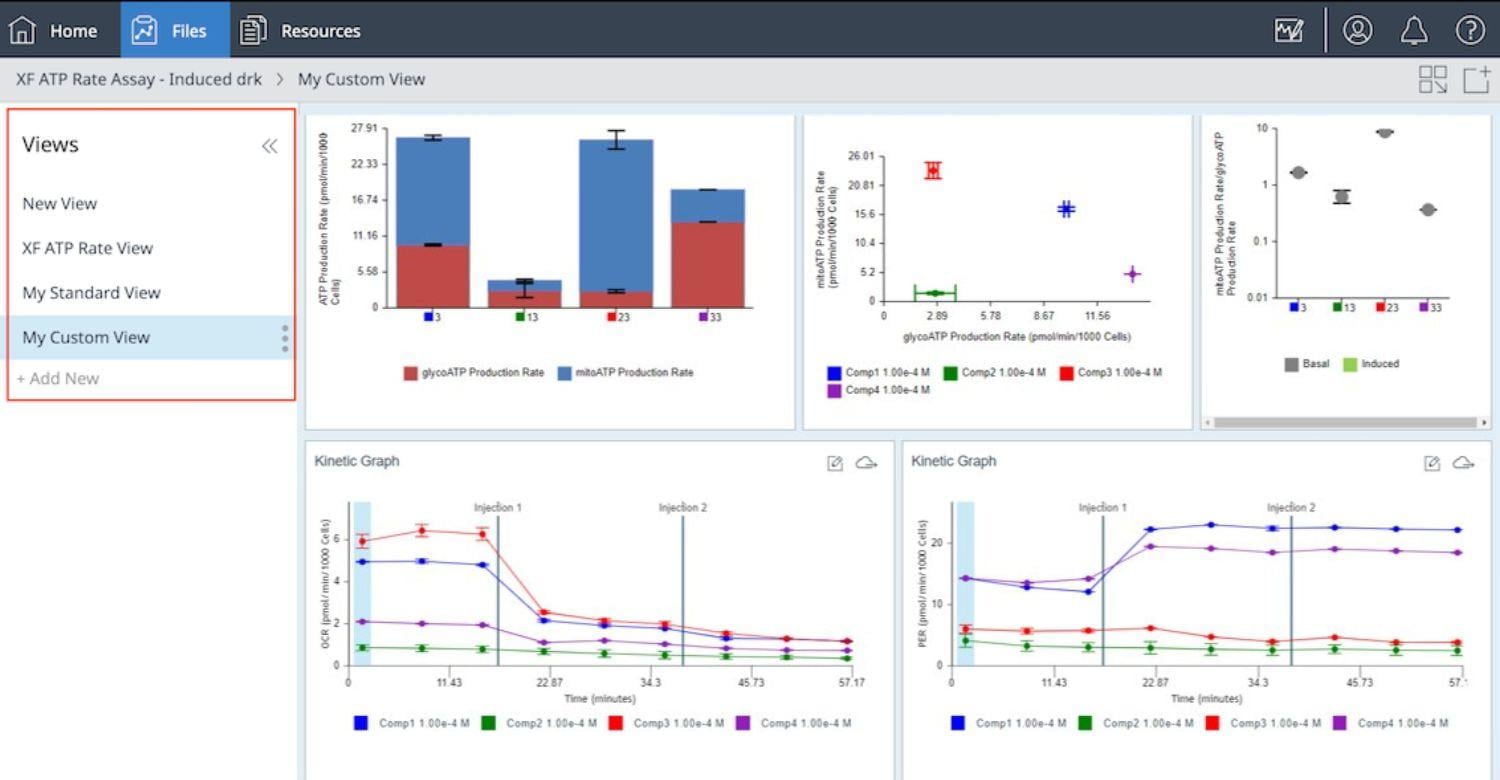
Other important points:
- Not all XF assay workflows can be analyzed using Seahorse Analytics. You can export your result data to Microsoft Excel or GraphPad Prism for custom analysis needs.
- Each widget has its own plate map that controls the graphed data for that widget. To edit the graphed data, open the widget editor view by double-clicking the widget. The graphed data is controlled using the functions seen in the ribbon above the graph and using the plate map to the right of the graph. To make file-level changes go to the Modify view.
- There are times when you make wish to make small modifications to your assay result file. You can access the modify functions from any analysis view by clicking the Modify button found in the upper-right corner in the ribbon. Changes to a file using Modify will affect all widgets/analysis views in your result file (i.e. removing an outlier well, changing group color, or renaming a group).
Blank and Custom Analysis Views: The custom analysis view feature provides ultimate data analysis flexibility. You can save any analysis view as a custom view, however this example shows you how to create a custom analysis view starting from a Blank view. The series of steps below also highlights how to automate routine steps in your analysis workflow using the blank/custom view feature, improving workflow consistency and saving time.
a. Open an assay result file and select the Standard Graphs > Blank View and click Add View
b. Click the Add Widget, select Standard Graphs > Kinetic Graph and click Add Widget
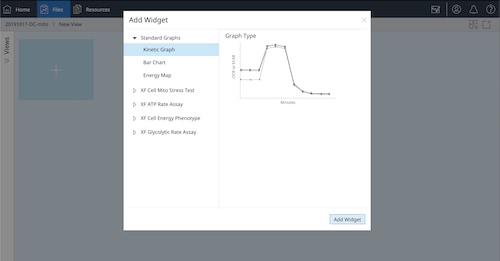
c. On the Widget Editor view, perform the following steps:
- Toggle Y1 > Level to display O2 level data
- Turn Background Correction OFF
- Double-click the name of the widget and type: Oxygen Level Data QC
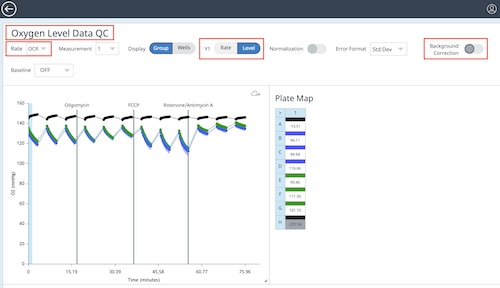
d. Click the back-arrow to return to the analysis view.
e. Click the Add Widget + (pictured below the kinetic graph), select Standard Graphs > Kinetic Graph and click Add Widget
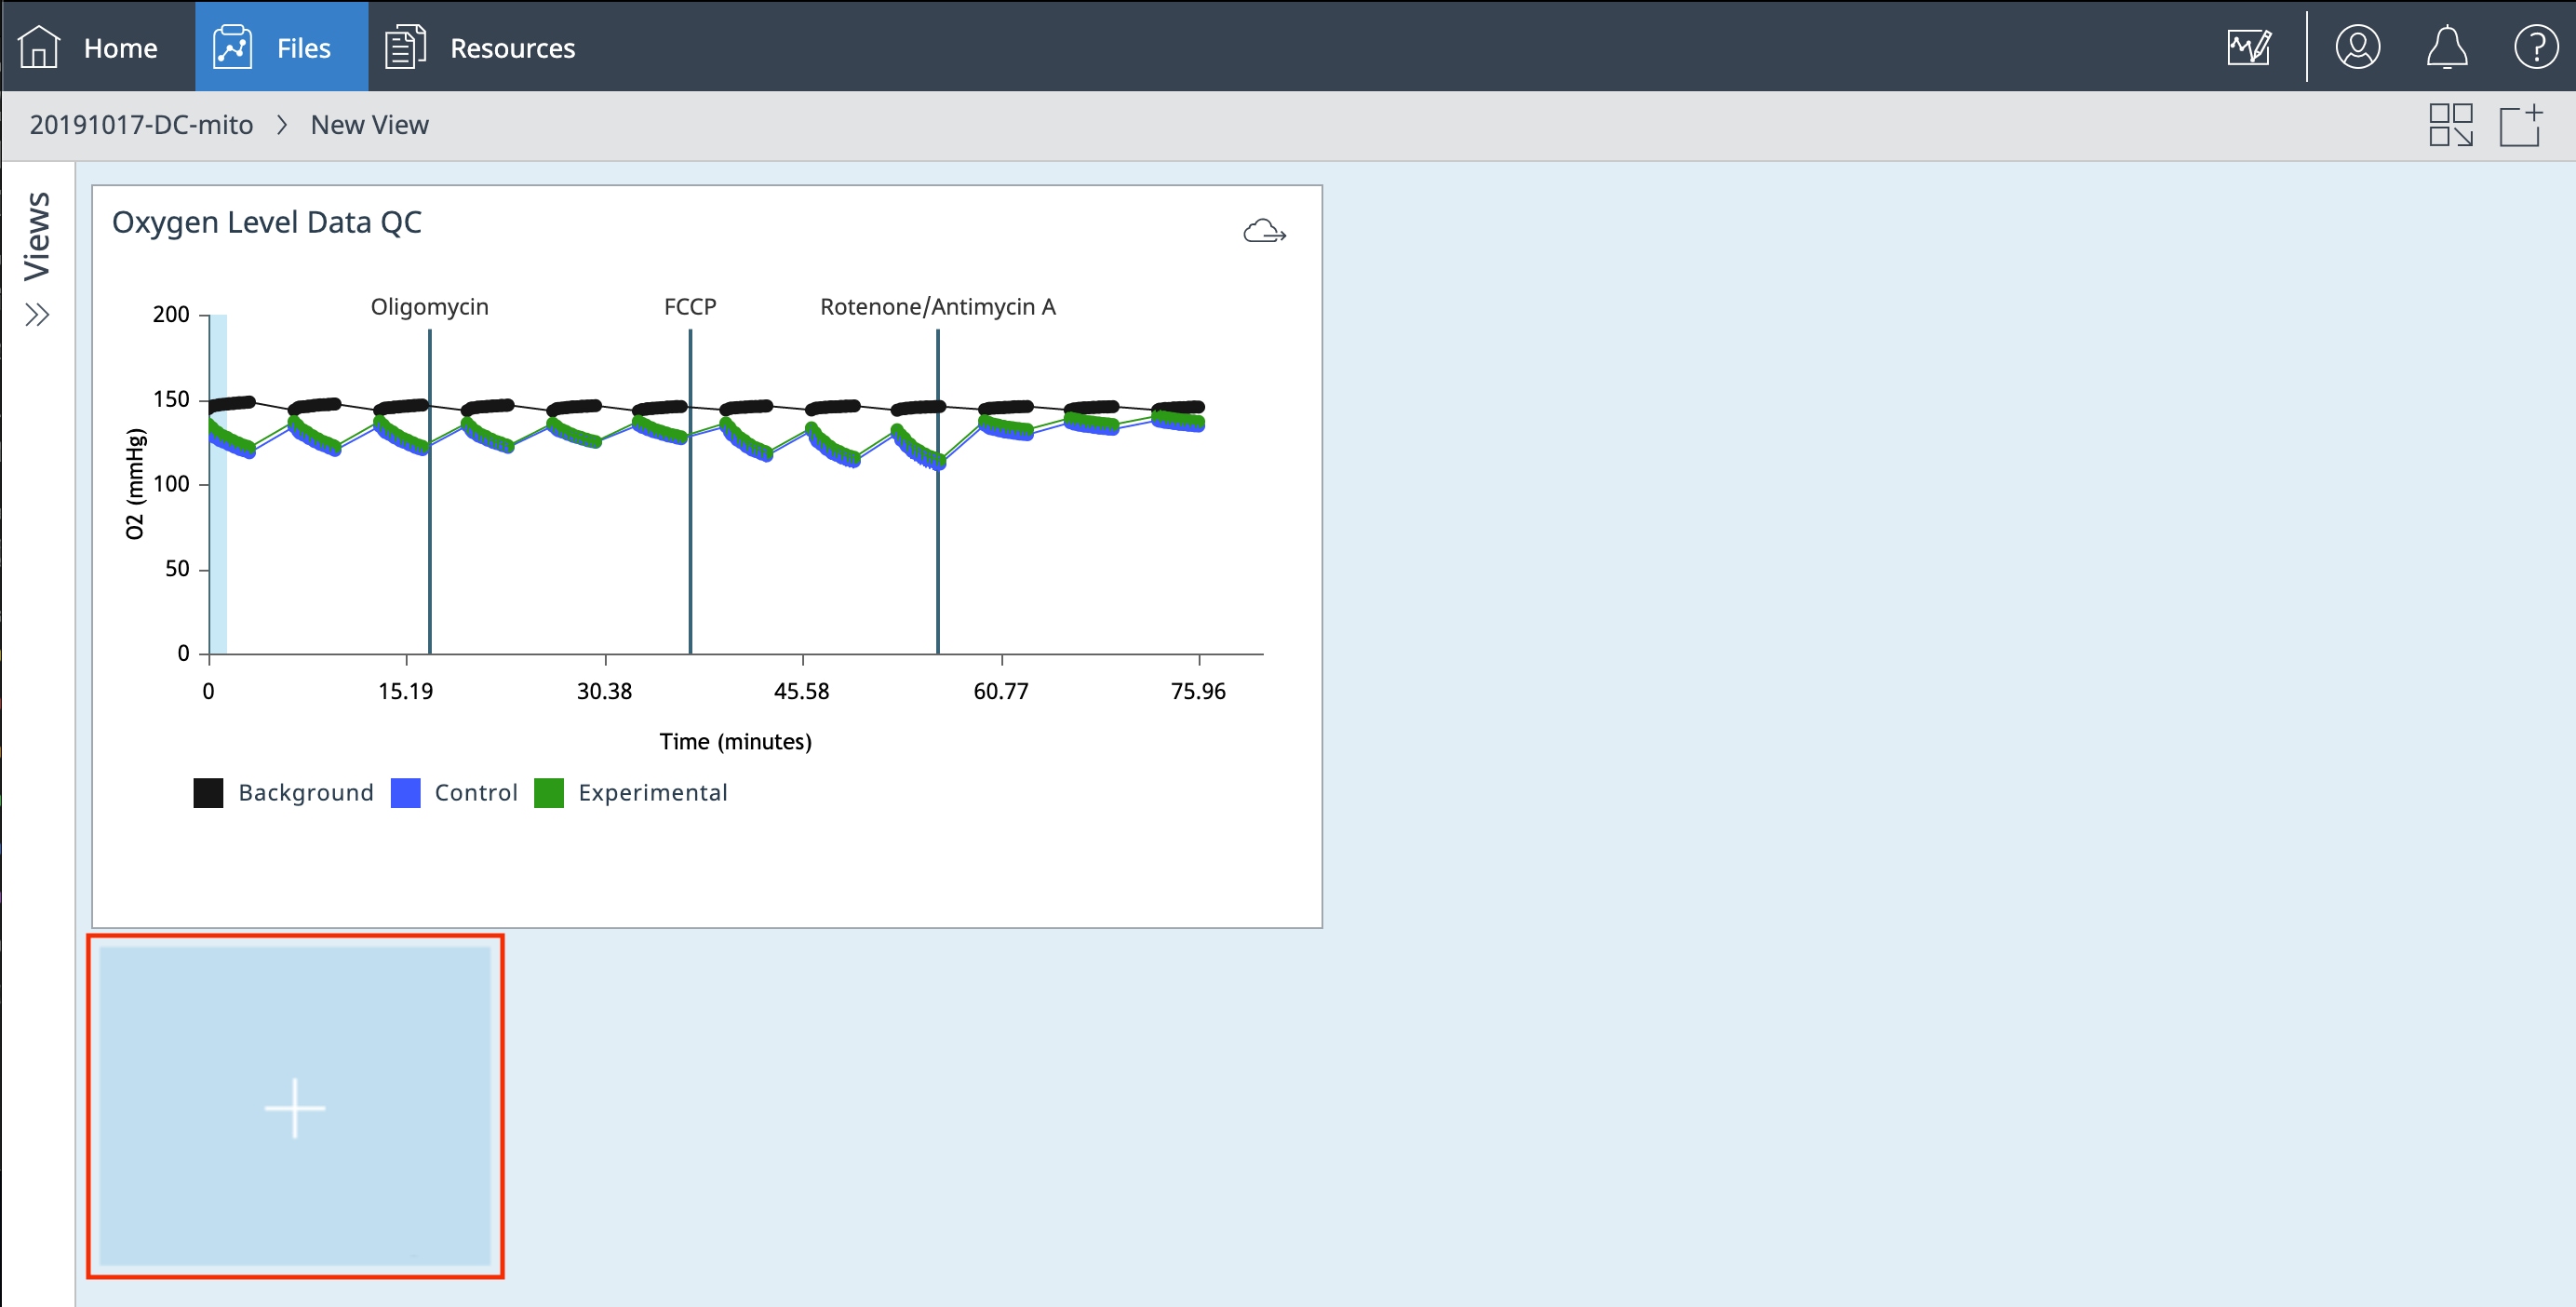
f. On the Widget Editor view, perform the following steps:
- Use the Rate drop-down menu and select ECAR
- Toggle Y1 > Level to display pH level data
- Turn Background Correction OFF
- Double-click the name of the widget and type: pH Level Data QC
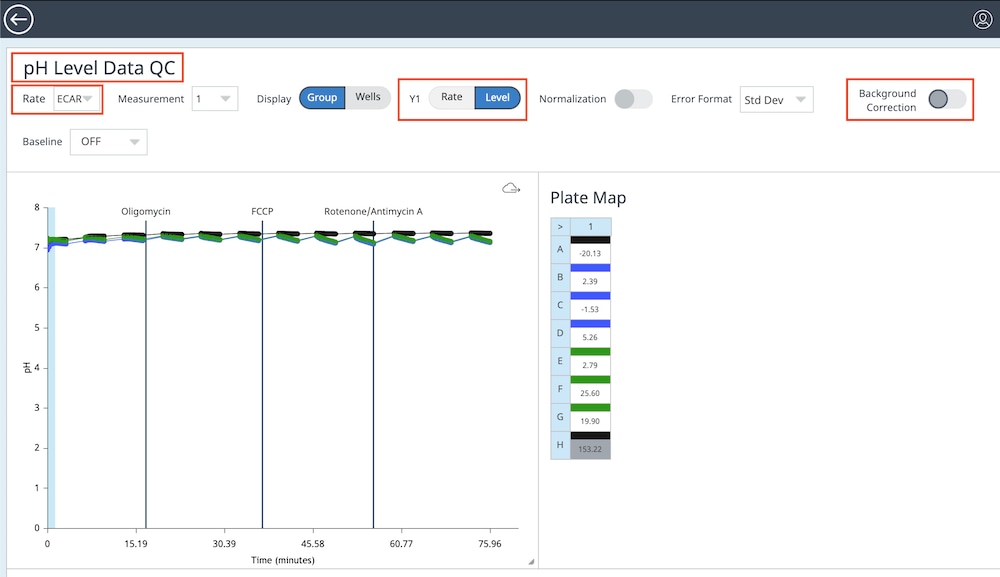
g. Click the back-arrow to return to the analysis view.
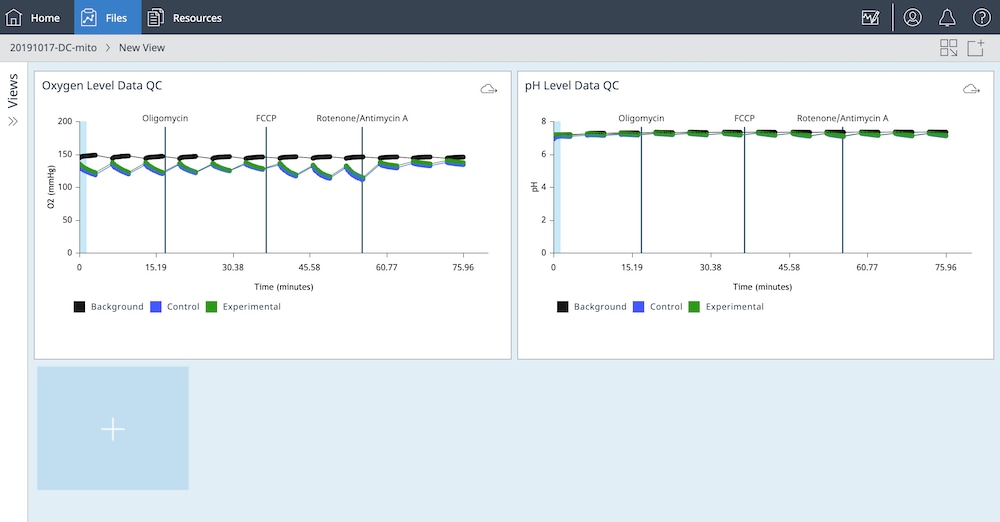
h. Expand the Views menu on the right-side of the analysis view and click the 3-dot button pictured to the right of the “New View” analysis view name.
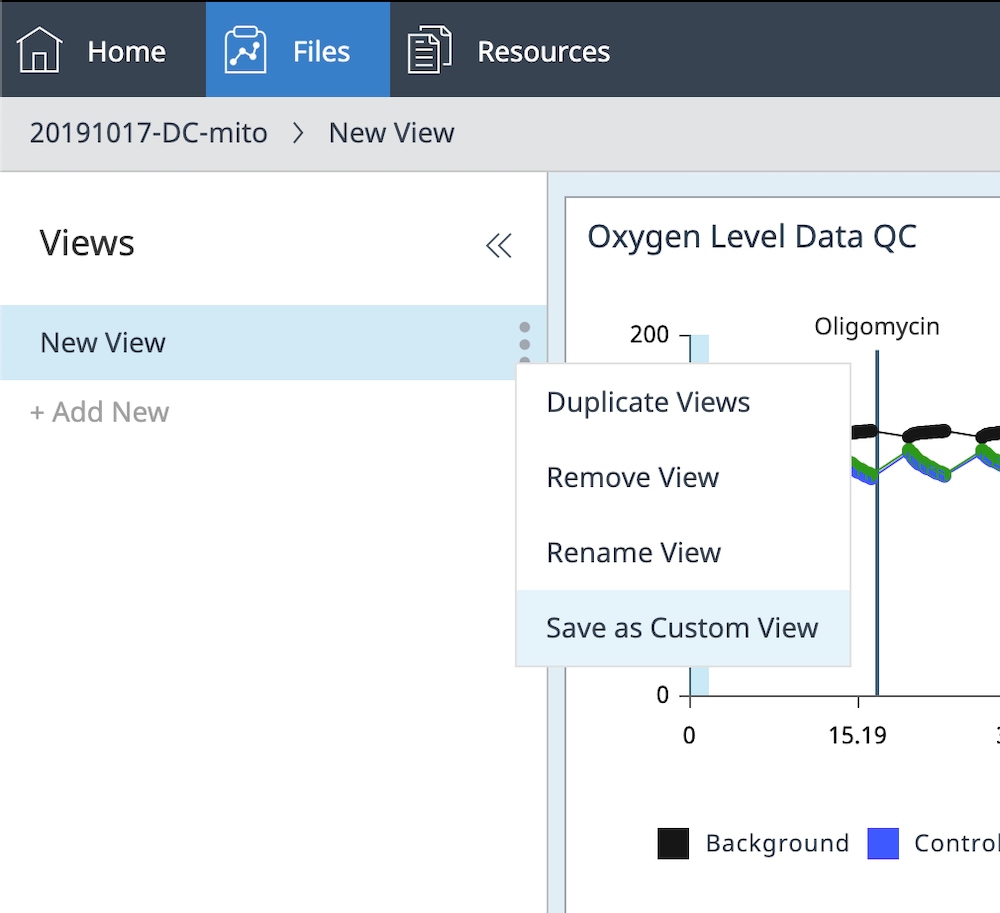
i. Click Save as Custom View and type in a custom view name (e.g. Data QC View)
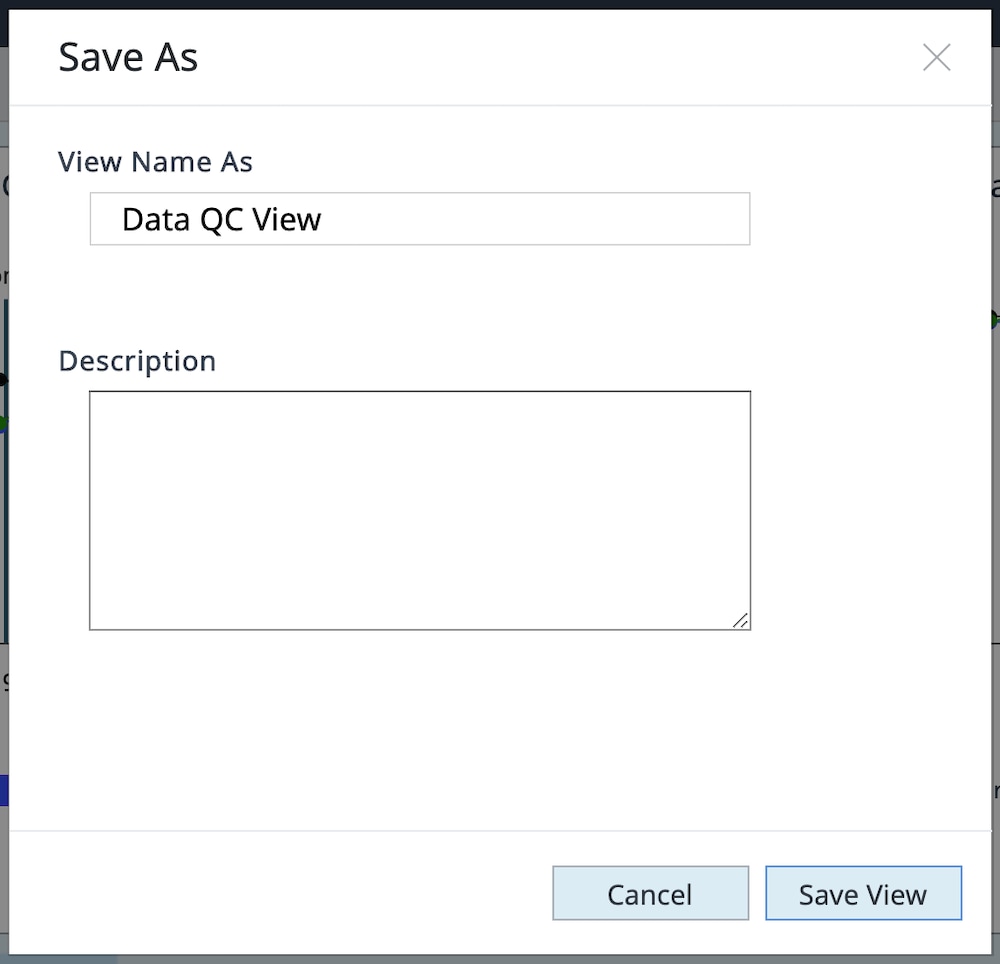
j. The next time you import a data file for analysis, you will be able to select your custom Data QC View, saving you time from creating the same analysis file for every new file you import.
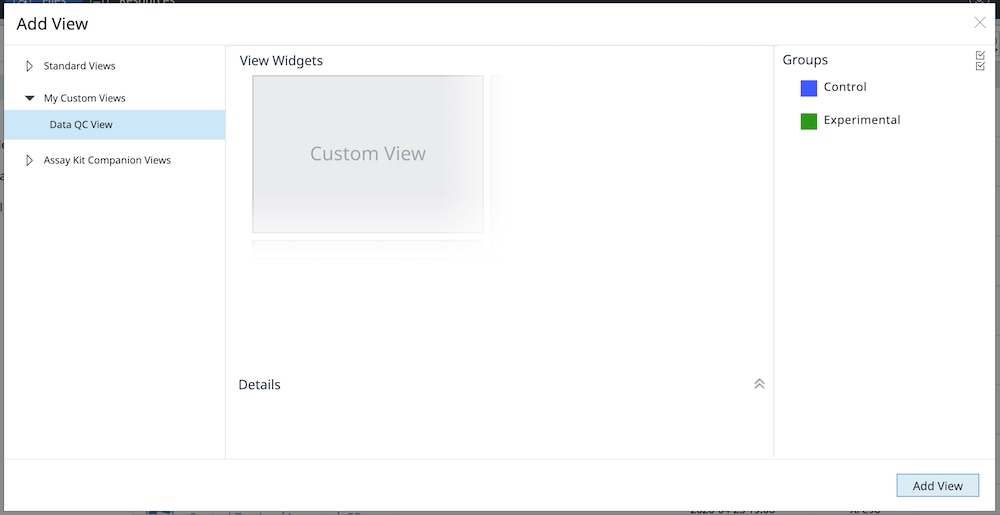
Assay Kit Companion Analysis View Information:
1. Assay Kit Companion Analysis View » XF Cell Mito Stress Test: To calculate and display the XF Cell Mito Stress Test assay parameters in a single analysis view:
- On the Add View window, click the Assay Kit Companion View list to expand the list of options.
- Click the XF Cell Mito Stress Test analysis view to display assay parameter widgets.
- Important: For XF Cell Mito Stress Test assays with 4 injections, you must identify the oligomycin injection using the drop-down menu seen above the widgets before you can add this analysis view. This oligomycin injection selection plays a critical role in correctly calculating assay parameters; incorrect oligomycin injection selection will result in incorrect widget calculations and graphs.
- Select the desired parameter widgets (e.g. basal respiration, maximal respiration, etc.) to add to your analysis view. A blue outline around the widget indicates it is selected. If the Acute Response widget is greyed-out, then it cannot be selected as this parameter can only be calculated for XF Cell Mito Stress Test assays with an acute injection.
- Turn OFF/ON groups in the group list if necessary, then click Add View
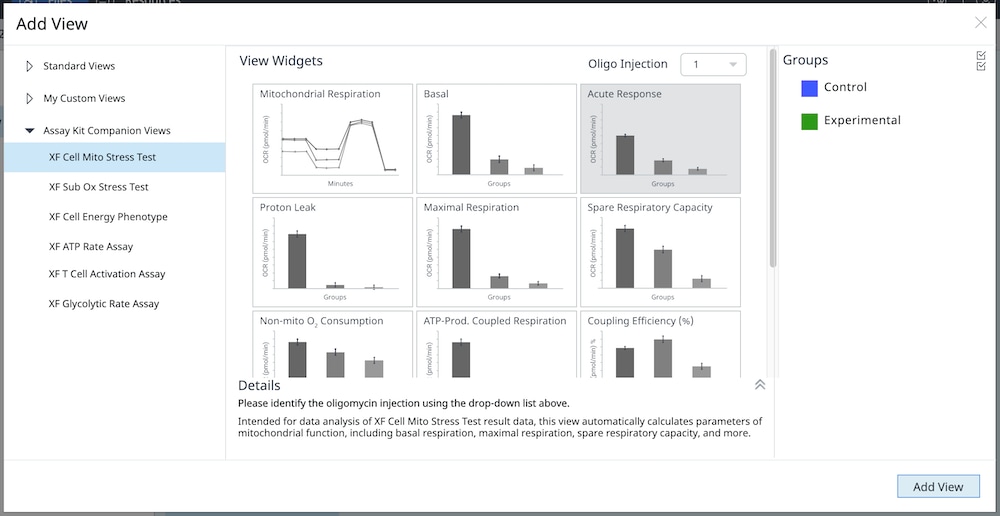
You can also add individual XF Cell Mito Stress Test assay parameter widgets (i.e. Spare Respiratory Capacity) to an existing analysis view:
a. Click the Add Widget button (pictured right outlined in red).
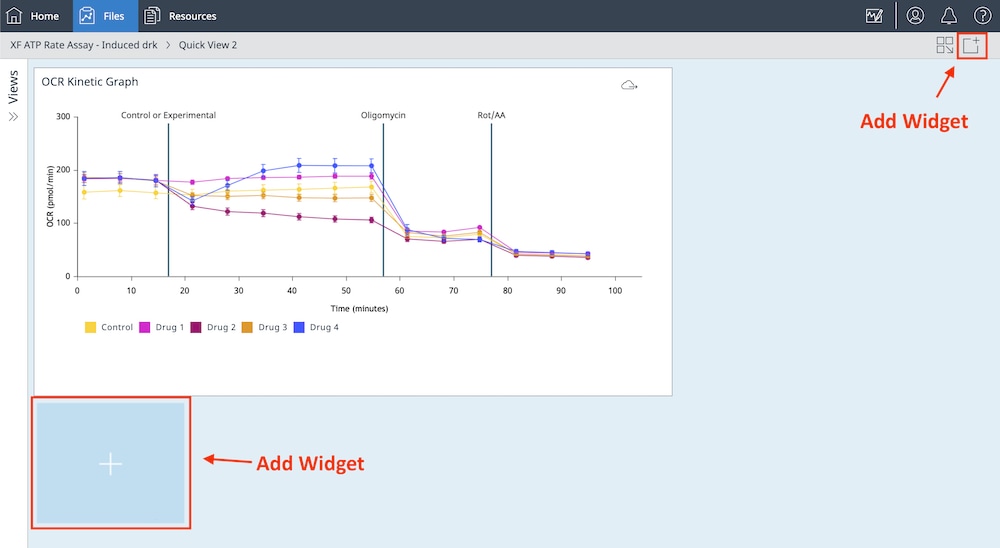
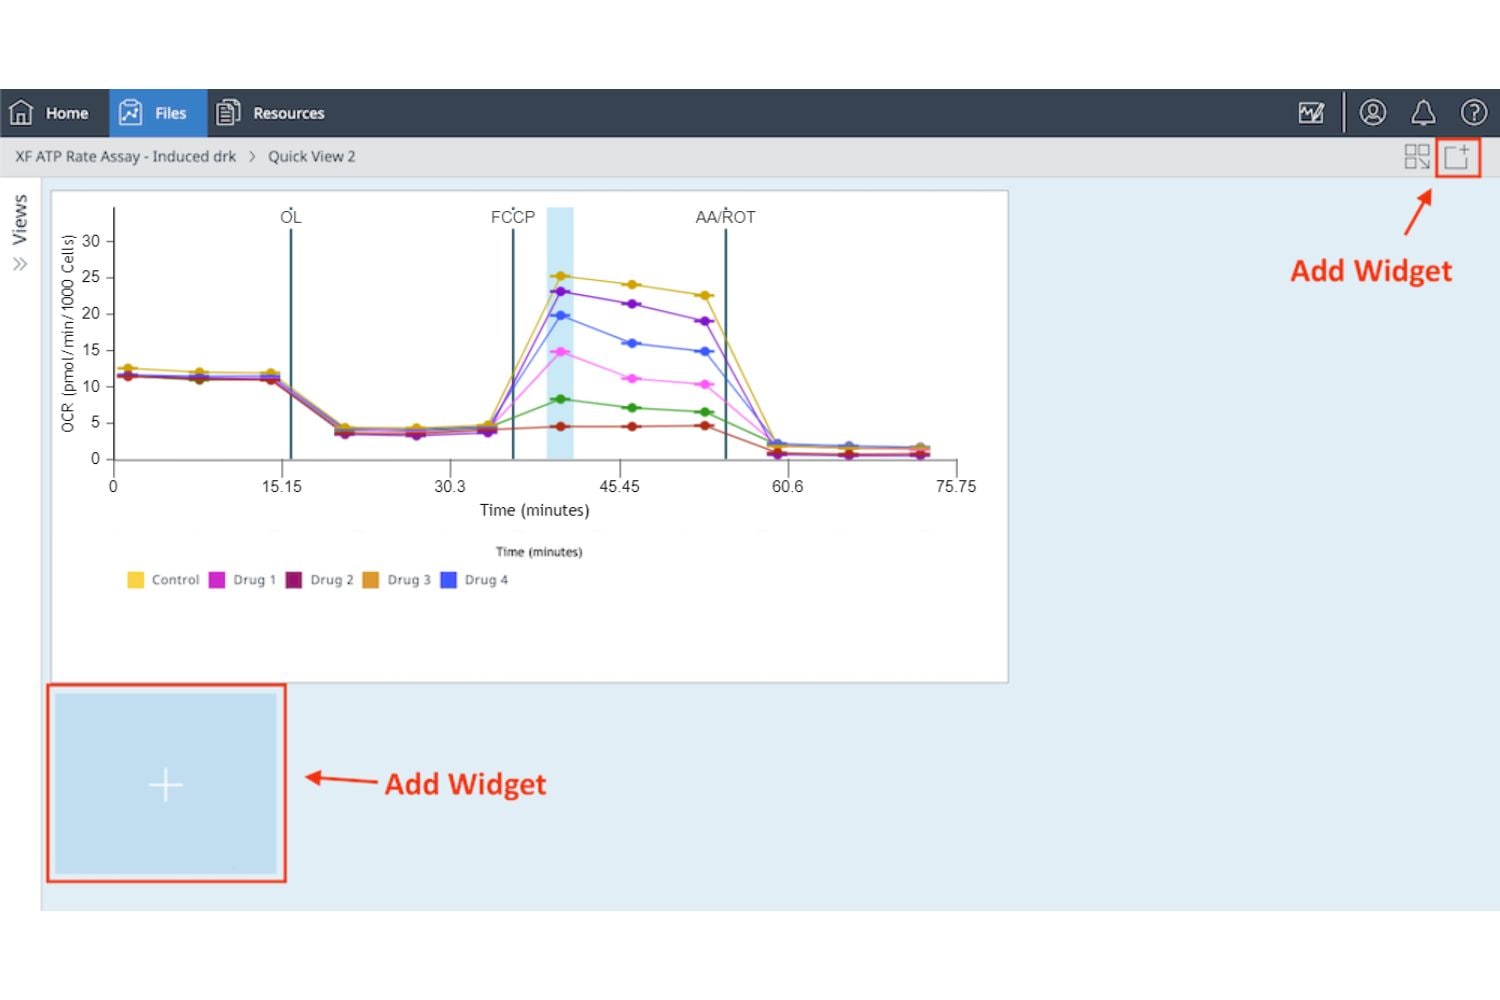
b. Expand the XF Cell Mito Stress Test widget list, select the desired widget and click Add Widget.
Important: For XF Cell Mito Stress Test assays with 4 injections, you must identify the oligomycin injection using the drop-down menu seen above the widget before you can add the selected widget to your analysis view. This oligomycin injection selection plays a critical role in correctly calculating assay parameters; incorrect oligomycin injection selection will result in incorrect widget calculations and graphs.
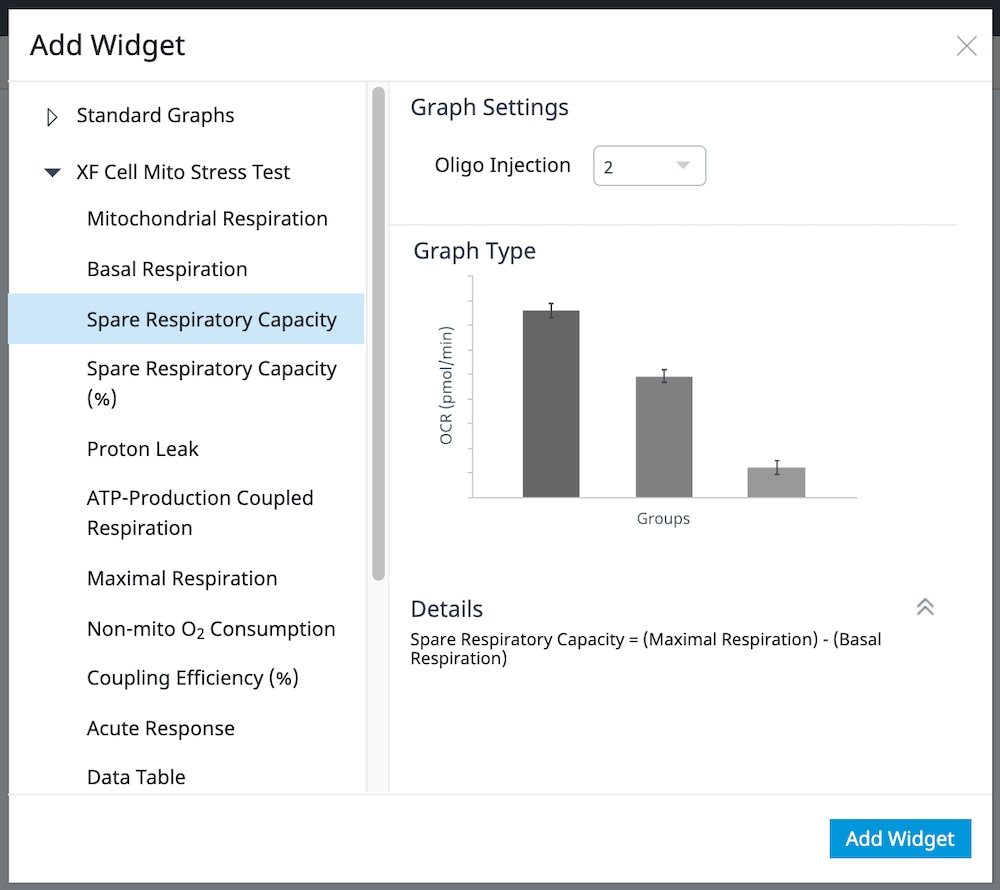
The table below describes the XF Cell Mito Stress Test assay parameter calculations:
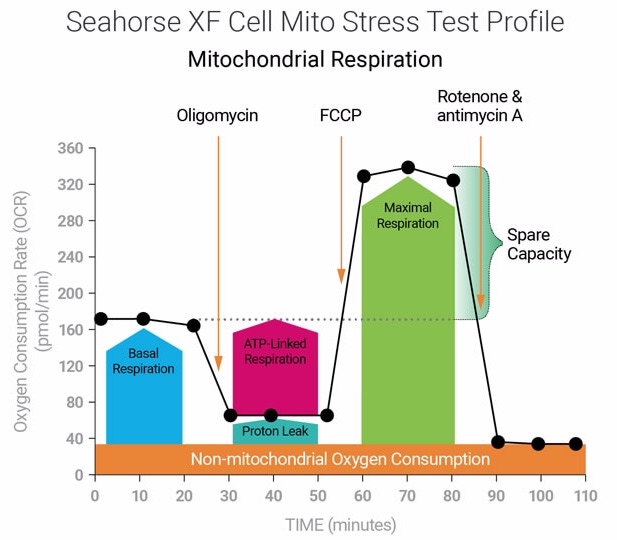
| Assay Parameter | Equation |
|---|---|
| Non-Mitochondrial Oxygen Consumption | Minimum rate measurement after Rotenone/antimycin A injection |
| Basal Respiration | (Last rate measurement before first injection) – (Non-Mitochondrial Oxygen Consumption) |
| Maximal Respiration | (Maximum rate measurement after FCCP injection) – (Non-Mitochondrial Oxygen Consumption) |
| Proton Leak | (Minimum rate measurement after Oligomycin injection) – (Non-Mitochondrial Oxygen Consumption) |
| ATP-Production Coupled Respiration | (Last rate measurement before Oligomycin injection) – (Minimum rate measurement after Oligomycin injection) |
| Spare Respiratory Capacity | (Maximal Respiration) – (Basal Respiration) |
| Spare Respiratory Capacity as a % | (Maximal Respiration) / (Basal Respiration) × 100% |
| Acute Response | (Last rate measurement before Oligomycin injection) – (Last rate measurement before acute injection) |
| Coupling Efficiency | (ATP-Production Coupled Respiration) / (Basal Respiration) × 100% |
2. Assay Kit Companion Analysis View » XF Substrate Oxidation Stress Test: To calculate and display the XF Substrate Oxidation Stress Test assay parameters in a single analysis view:
- On the Add View window, click the Assay Kit Companion View list to expand the list of options.
- Click the XF Sub Ox Stress Test analysis view to display assay parameter widgets.
- Select the desired parameter widgets to add to your analysis view. A blue outline around the widget indicates it is selected.
- Optional: The FCCP Max Rate drop-down allows you to choose which measurement point after FCCP injection to use for calculation of Maximal Respiration. Using the Default option, Seahorse Analytics will calculate Maximal Respiration on a per-group basis; the maximum response may be different across groups (i.e. group 1 maximal response is the first measurement after FCCP injection versus group 2 maximal response is the third rate measurement after FCCP injection).
You can also select a specific rate measurement for the calculation of Maximal Respiration and Seahorse Analytics will use the same post-FCCP injection rate measurement for each group. Using the example above, you can tell Seahorse Analytics to calculate Maximal Response for all groups using a specific post-FCCP injection rate measurement rather than calculating Max Respiration within groups. - Turn OFF/ON groups in the group list if necessary, then click Add View

You can also add individual XF Substrate Oxidation Stress Test assay parameter widgets (i.e. Maximal Respiration) to an existing analysis view:
a. Click the Add Widget button (pictured right outlined in red).
b. Expand the XF Sub Ox Stress Test widget list, select the desired widget and click Add Widget.
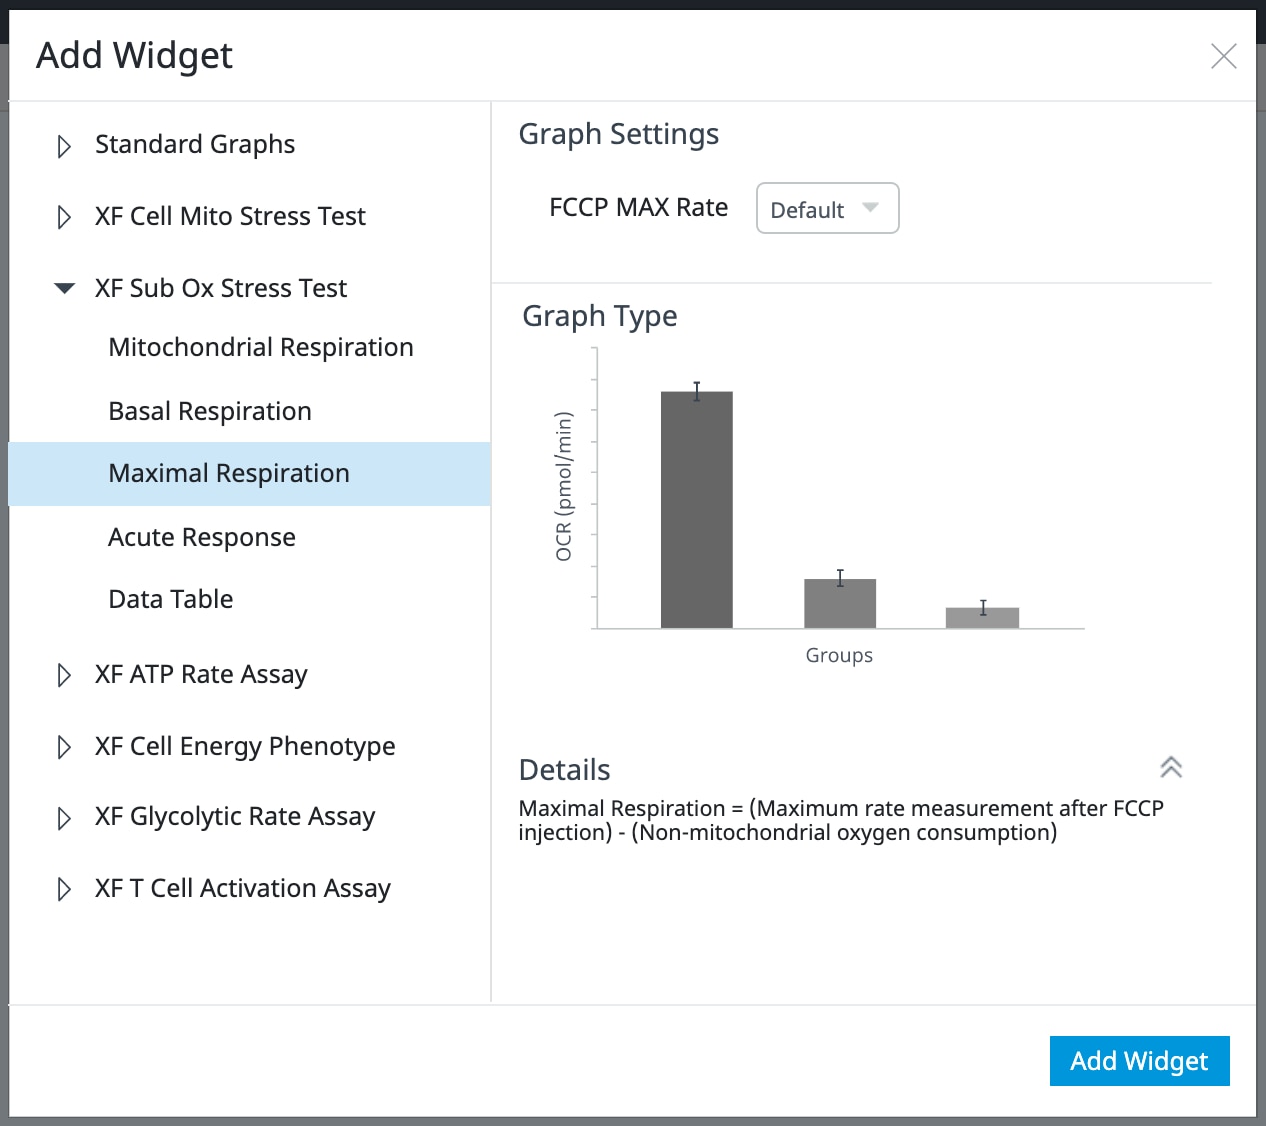
The table below describes the XF Substrate Oxidation Stress Test assay parameter calculations:
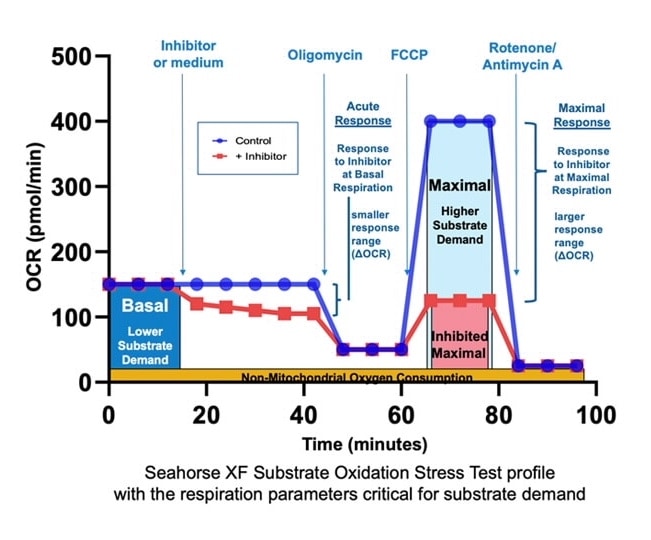
| Assay Parameter | Equation |
|---|---|
| Basal Respiration | (Last rate measurement before first injection) – (Non-Mitochondrial Oxygen Consumption*) |
| Maximal Respiration | (Maximum rate measurement after FCCP injection) – (Non-Mitochondrial Oxygen Consumption*) |
| Acute Response | (Last rate measurement before Oligomycin injection) – (Last rate measurement before acute injection) |
| * Non-Mitochondrial Oxygen Consumption | Minimum rate measurement after Rotenone/antimycin A injection |
| Please Note: The Substrate Oxidation Stress Test Assay protocol is identical to the assay protocol for the XF Cell Mito Stress Test Assay with an acute injection, therefore you can derive other XF Cell Mito Stress Test Assay parameters (e.g. proton leak, ATP linked OCR, spare respiratory capacity and non-mitochondrial OCR, etc.), from XF Substrate Oxidation Stress Test data files by choosing the desired assay parameter from the Add Widget > XF Cell Mito Stress Test widget list. | |
3. Assay Kit Companion Analysis View » XF Cell Energy Phenotype Test: To calculate and display the XF Cell Energy Phenotype Test assay parameters in a single analysis view:
- On the Add View window, click the Assay Kit Companion View list to expand the list of options.
- Click the XF Cell Energy Phenotype analysis view to display assay parameter widgets.
- Select the desired parameter widgets to add to your analysis view. A blue outline around the widget indicates it is selected.
- Turn OFF/ON groups in the group list if necessary, then click Add View
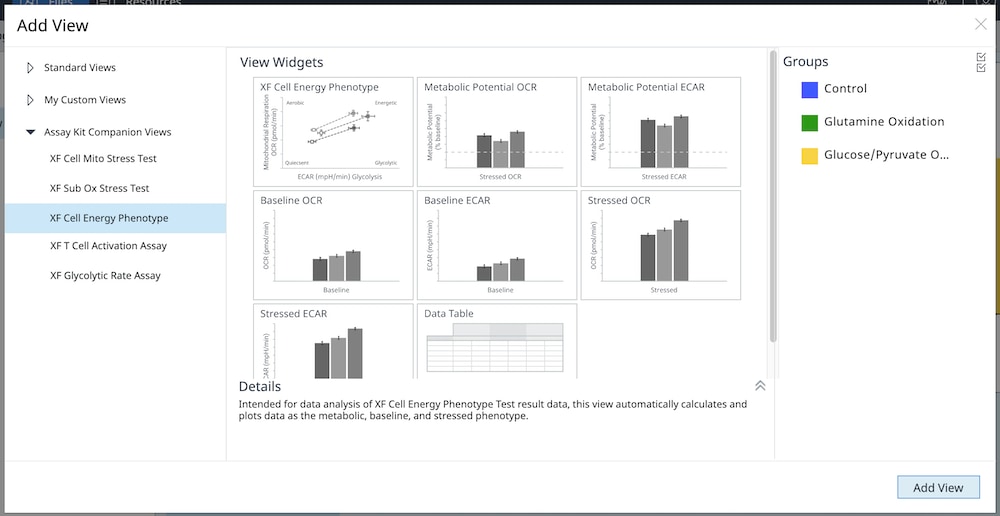
You can also add individual XF Cell Energy Phenotype Test assay parameter widgets (i.e. Metabolic Potential) to an existing analysis view:
a. Click the Add Widget button (pictured right outlined in red).
b. Expand the XF Cell Energy Phenotype Test, select the desired widget and click Add Widget.
The table below describes the XF Cell Energy Phenotype Test assay parameter calculations:
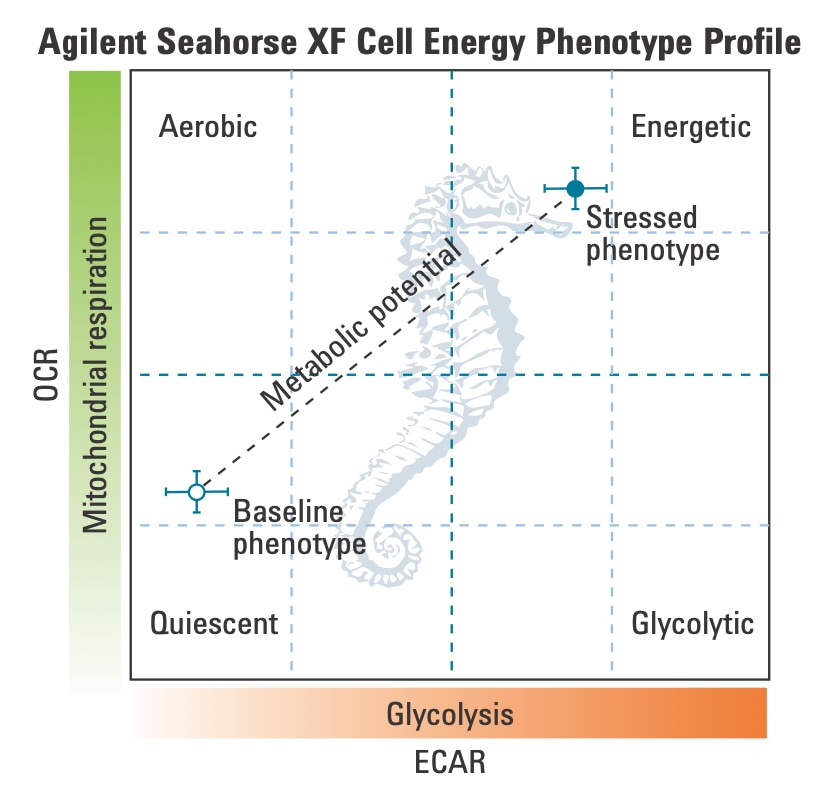
| Assay Parameter | Equation |
|---|---|
| Baseline OCR | Last OCR rate measurement before first injection |
| Baseline ECAR | Last ECAR rate measurement before first injection |
| Stressed OCR | Maximum OCR rate measurement after the first injection |
| Stressed ECAR | Maximum ECAR measurement after the first injection |
| Metabolic Potential (OCR) | (Stressed OCR/Baseline OCR) × 100% |
| Metabolic Potential (ECAR) | (Stressed ECAR/Baseline ECAR) × 100% |
4.2. Assay Kit Companion Analysis View » XF Real-Time ATP Rate Assay: Follow the steps below to calculate and display the XF Real-Time ATP Rate Assay parameters in a single analysis view. Please note, buffer factor must be properly configured to add this analysis view and widgets from this analysis view to your assay result file.
- On the Add View window, click the Assay Kit Companion View list to expand the list of options.
- Click the XF ATP Rate Assay analysis view to display assay parameter widgets.
- For Induced XF ATP Rate assays (1 or 2 injections prior to standard injections of oligomycin and rotenone/antimycin A), you must identify whether oligomycin injection was injection 2 or injection 3 using the drop-down menu seen above the widgets to add this analysis view. This oligomycin injection selection plays a critical role in correctly calculating assay parameters; incorrect oligomycin injection selection will result in incorrect widget calculations and graphs. For more information on these two workflows please consult the XF Real-Time ATP Rate Assay User Manual.
- Select the desired parameter widgets to add to your analysis view. A blue outline around the widget indicates it is selected. If widget(s) are greyed out, this means they cannot be selected as the assay file does not have the minimum number of injections required to calculate the parameter(s).
- Turn OFF/ON groups in the group list if necessary, then click Add View
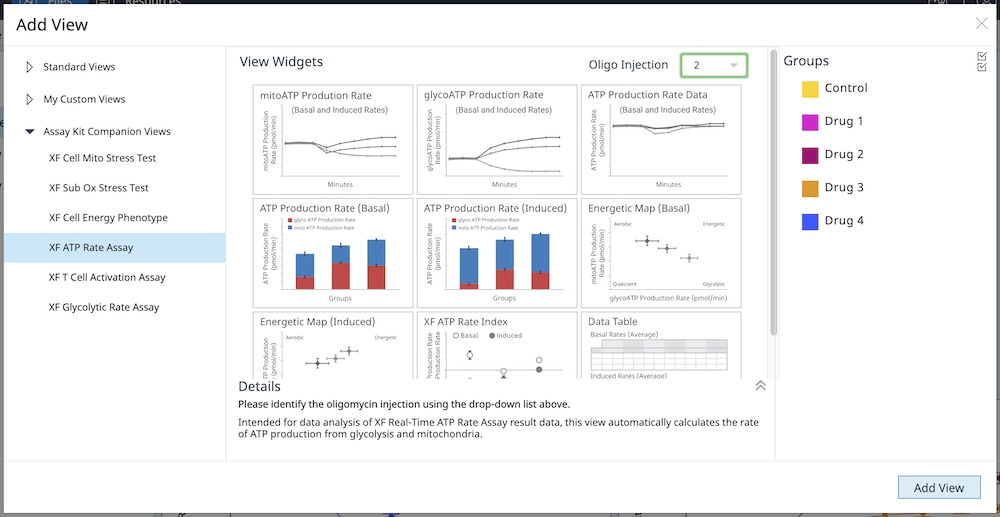
You can also add individual XF ATP Rate Assay parameter widgets (i.e. ATP Production Rate Basal) to an existing analysis view:
a. Click the Add Widget button (pictured right outlined in red).
b. Expand the XF ATP Rate Assay widget list, select the desired widget and click Add Widget.
Important: For Induced XF ATP Rate assays (1 or 2 injections prior to standard injections of oligomycin and rotenone/antimycin A), you must identify whether oligomycin injection was injection 2 or injection 3 using the drop-down menu seen above the widgets to add this analysis view. This oligomycin injection selection plays a critical role in correctly calculating assay parameters; incorrect oligomycin injection selection will result in incorrect widget calculations and graphs.
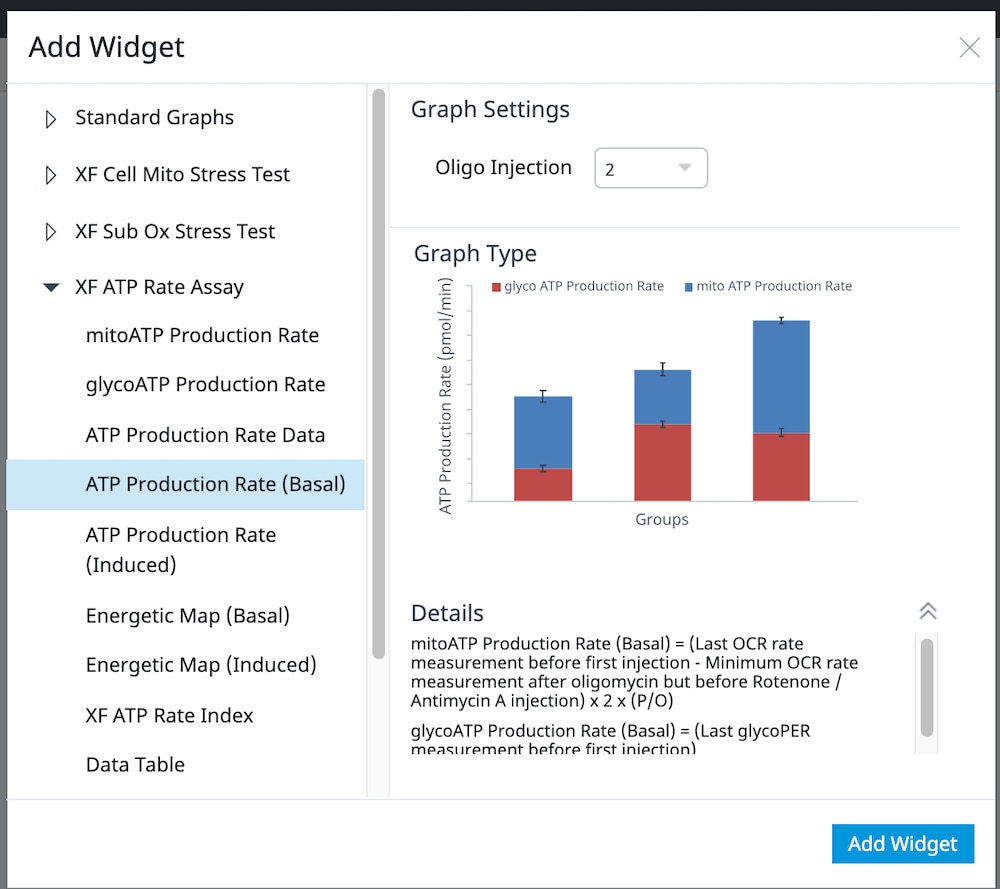
The table below describe the XF Real-Time ATP Rate Assay parameter calculations for both the standard and induced assay workflow:
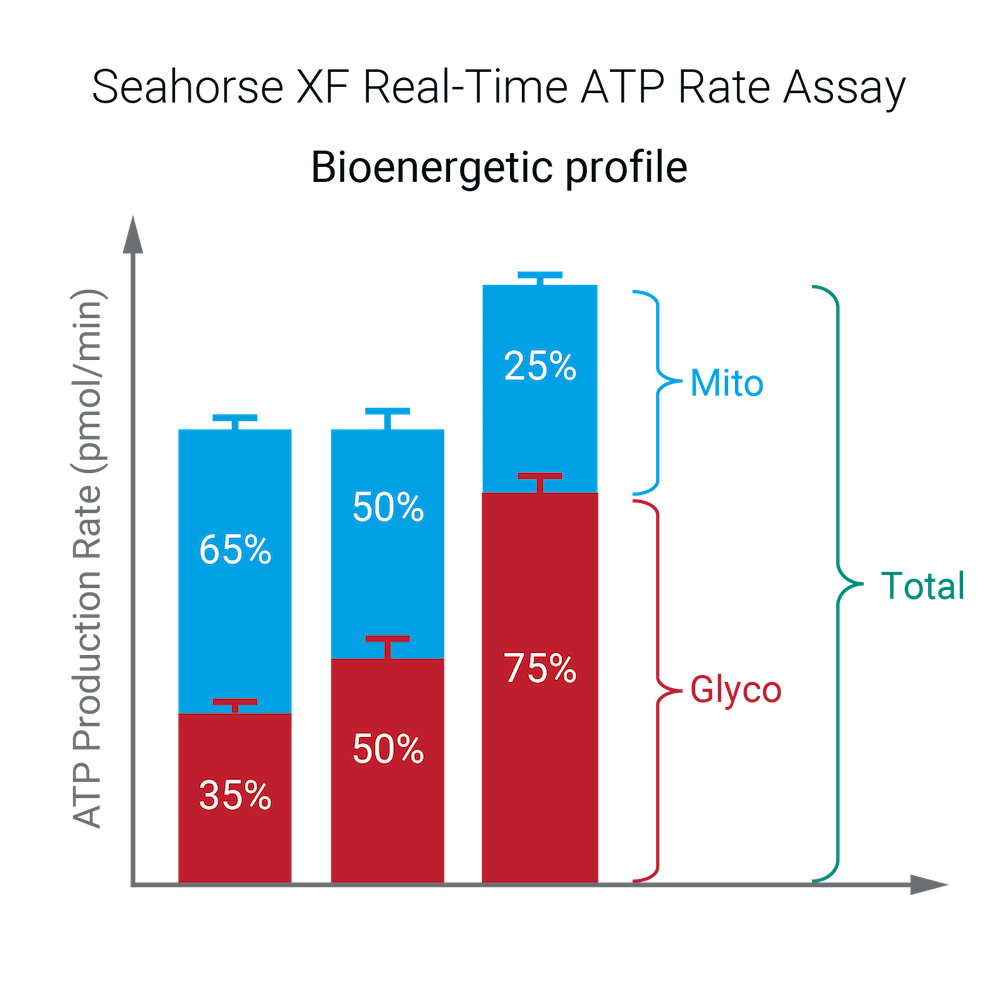
Standard XF Real-Time ATP Rate Assay
| Assay Parameter | Equation |
|---|---|
| mitoATP Production Rate (Basal) | [(Last OCR rate measurement before first injection - Minimum OCR rate measurement after oligomycin but before Rot/AA injection) x 2 x (P/O)] |
| glycoATP Production Rate (Basal) | Last glycoPER measurement before first injection |
| Total ATP Production Rate (Basal) | (mitoATP Production Rate) + (glycoATP Production Rate) |
| XF ATP Rate Index (Basal) | (mitoATP Production Rate) / (glycoATP Production Rate) |
Induced XF Real-Time ATP Rate Assay:
| Assay Parameter | Equation |
|---|---|
| mitoATP Production Rate (Basal) | [(Last OCR rate measurement before first injection - Minimum OCR rate measurement after oligomycin but before Rot/AA injection) x 2 x (P/O)] |
| glycoATP Production Rate (Basal) | Last glycoPER measurement before first injection |
| Total ATP Production Rate (Basal) | (mitoATP Production Rate) + (glycoATP Production Rate) |
| XF ATP Rate Index (Basal) | (mitoATP Production Rate) / (glycoATP Production Rate) |
| mitoATP Production Rate (Induced) | (Average OCR rate measurement after acute injection and before oligomycin injection) - (Minimum OCR rate measurement after oligo & before Rot/AA injection)] x 2 x (P/O) |
| glycoATP Production Rate (Induced) | Average of the glycoATP Production Rate measurements after the acute injection and before next injection. |
| Total ATP Production Rate (Induced) | mitoATP Production Rate (Induced) + glycoATP Production Rate (Induced) |
| XF ATP Rate Index (Induced) | mitoATP Production Rate (Induced) / glycoATP Production Rate (Induced) |
5.3. Assay Kit Companion Analysis View » XF T Cell Activation Assay: To calculate and display the XF T Cell Activation assay parameters in a single analysis view:
- On the Add View window, click the Assay Kit Companion View list to expand the list of options.
- Click the XF T Cell Activation Assay analysis view to display assay parameter widgets.
- Check the Baseline checkbox to calculate PER data displayed in each widget as a percent (%) of the baseline rate measurement, which is the last rate measurement before the activator injection. For quantitative data, leave the Baseline checkbox unchecked to calculate PER in units of (pmol/min).
- Ensure the correct injection position is selected in the Activator Injection drop-down menu.
- Select the desired parameter widgets to add to your analysis view. A blue outline around the widget indicates it is selected.
- Turn OFF/ON groups in the group list if necessary, then click Add View
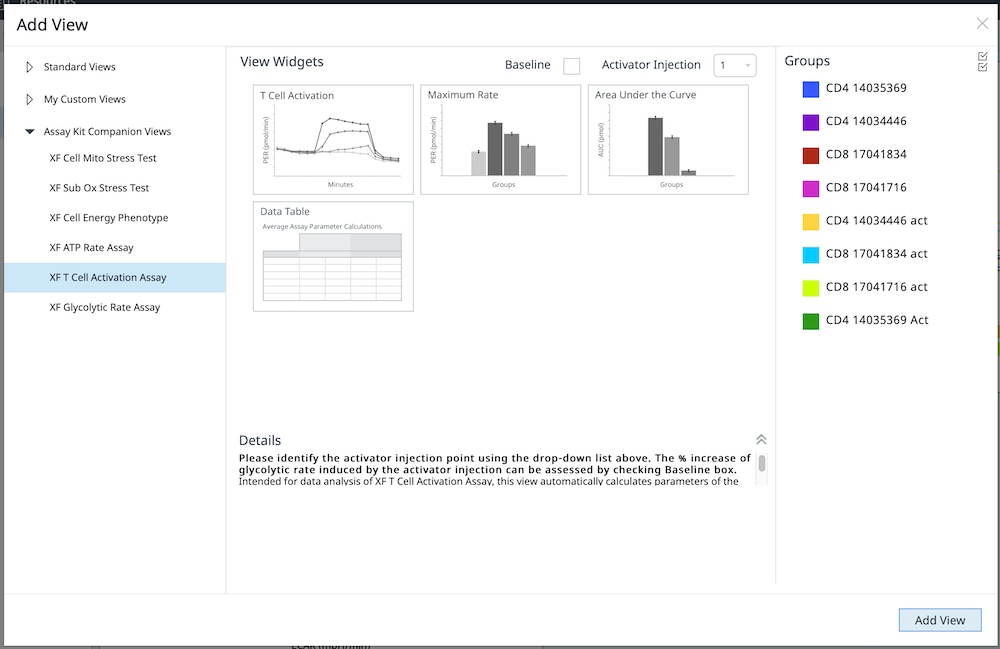
You can also add individual XF T Cell Activation Assay parameter widgets (i.e. Maximum Rate) to an existing analysis view:
c. Click the Add Widget button (pictured right outlined in red).
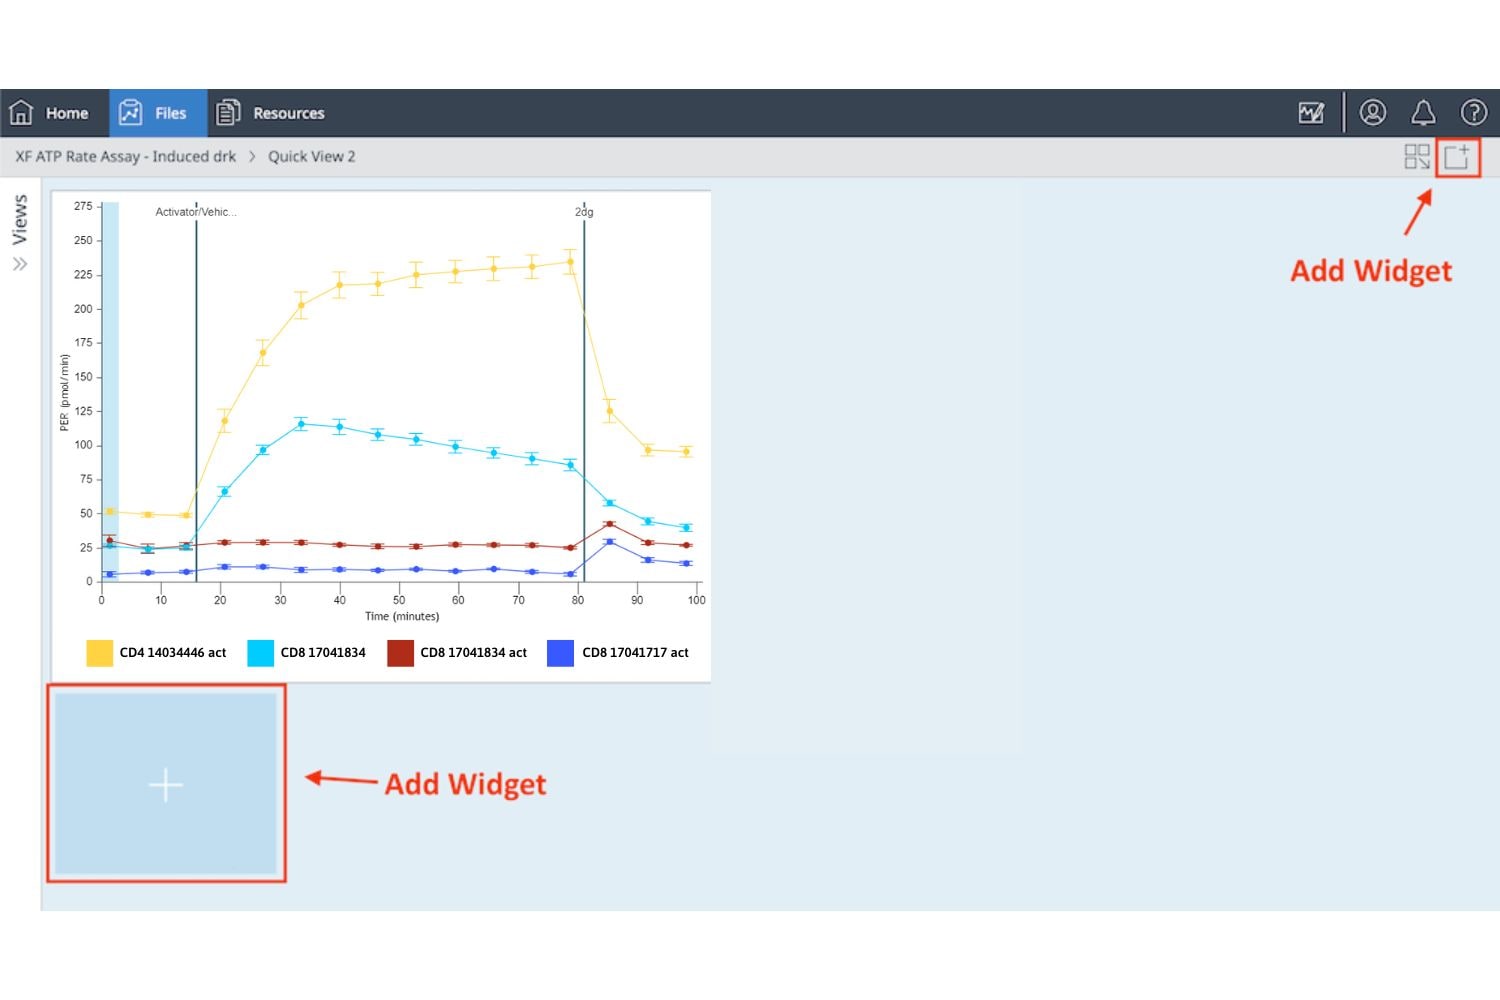
d. Expand the XF T Cell Activation Assay, select the desired widget and click Add Widget.
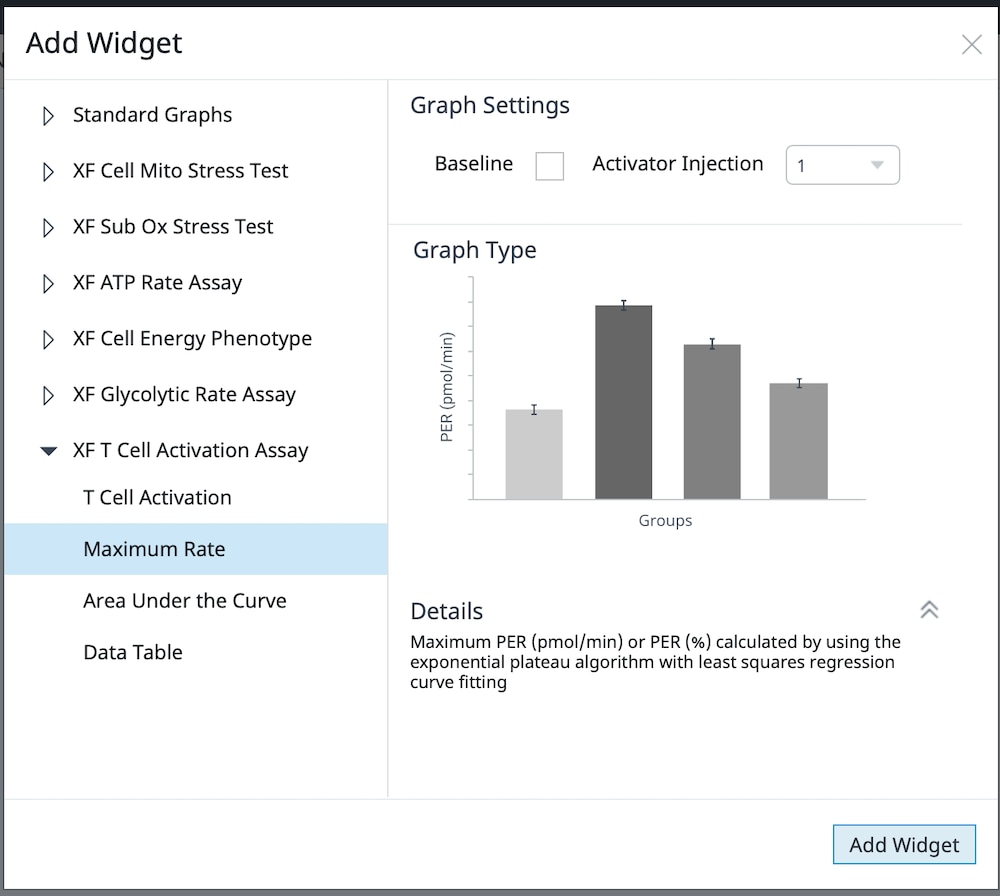
The table below describes the XF T Cell Activation Assay parameter calculations:
| Assay Parameter | Equation |
|---|---|
| T Cell Activation | PER (proton efflux rate) data displayed as a kinetic graph |
| Maximum Rate | Calculated in Seahorse Analytics using a nonlinear least-squares curve fitting algorithm using rate measurement data after the activator injection and before the 2-DG injection. For more information regarding this calculation method, please refer to: H. J. Motulsky, "Exponential plateau", GraphPad Curve Fitting Guide. Accessed 20 May 2020. 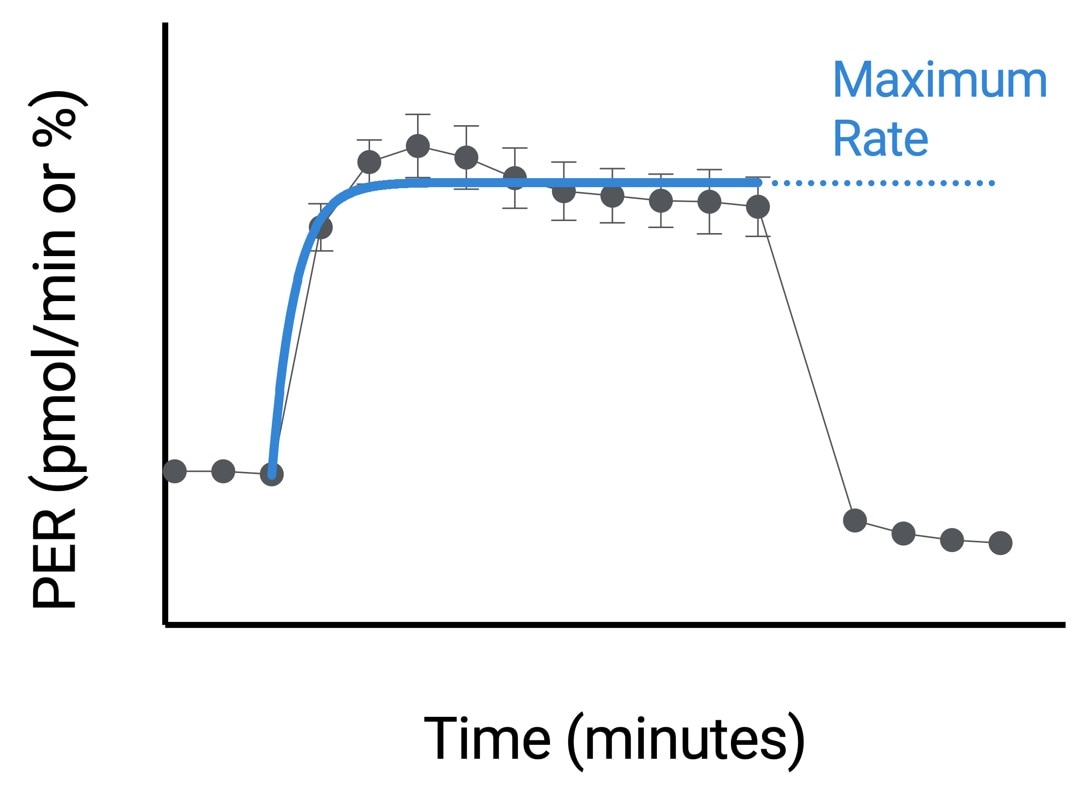 |
| Area Under the Curve | Calculated in Seahorse Analytics using rate measurement data after the activator injection and before the 2-DG injection. AUC values only include peak values above baseline. For more information regarding this calculation method, please refer to: H. J. Motulsky, "How to: Area under the curve", GraphPad Statistics Guide. Accessed 20 May 2020. https://www.graphpad.com/guides/prism/8/statistics/stat_area_under_the_curve.htm 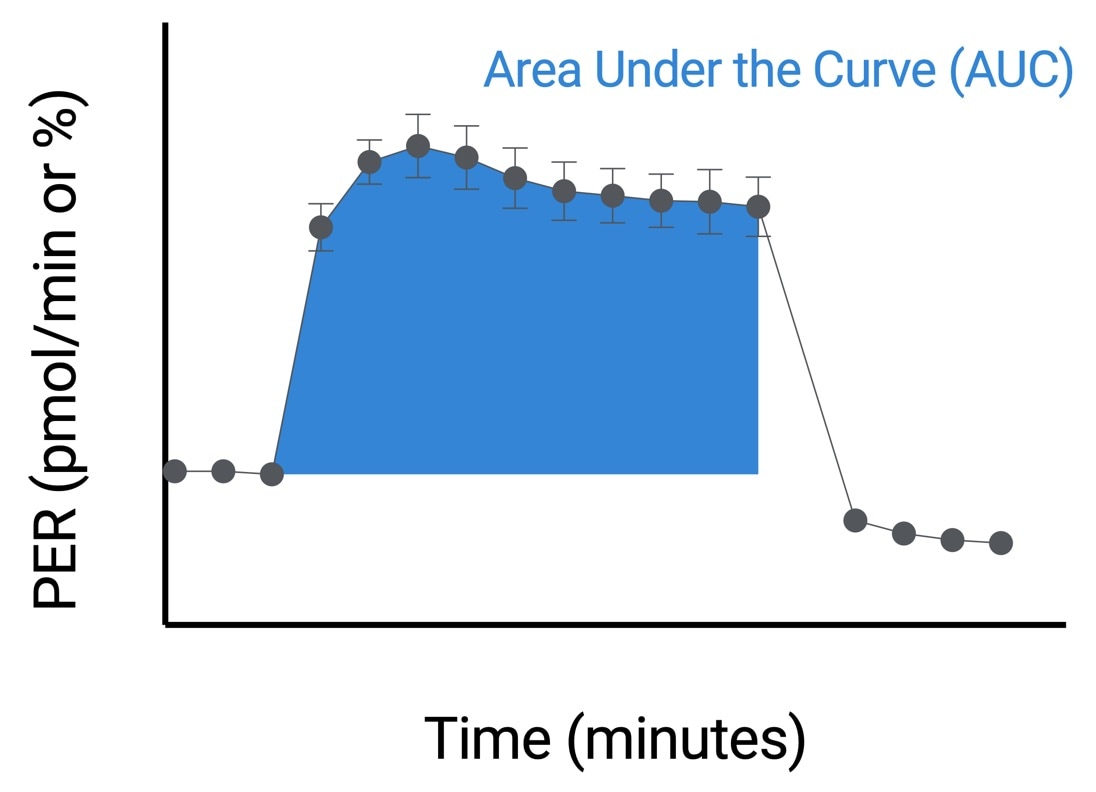 |
6.4. Assay Kit Companion Analysis View » XF Glycolytic Rate Assay: Follow the steps below to calculate and display the XF Glycolytic Rate Assay parameters in a single analysis view. Please note, buffer factor must be properly configured to add this analysis view and widgets from this analysis view to your assay result file.
- On the Add View window, click the Assay Kit Companion View list to expand the list of options.
- Click the XF Glycolytic Rate Assay analysis view to display assay parameter widgets.
- For Induced XF Glycolytic Rate Assay (1 or 2 injections prior to standard injections of rontenone/antimycin A and 2-DG), you must identify the Rotenone/Antimycin-A injection using the drop-down menu seen above the widgets before you can add this analysis view. This Rotenone/Antimycin-A injection selection plays a critical role in correctly calculating assay parameters; incorrect Rotenone/Antimycin-A injection selection will result in incorrect widget calculations and graphs. For more information about these 2 workflows, please consult the XF Glycolytic Rate Assay User Manual.
- Select the desired parameter widgets to add to your analysis view. A blue outline around the widget indicates it is selected. If widget(s) are greyed out, this means they cannot be selected as the assay file does not have the minimum number of injections required to calculate the parameter(s).
- Turn OFF/ON groups in the group list if necessary, then click Add View
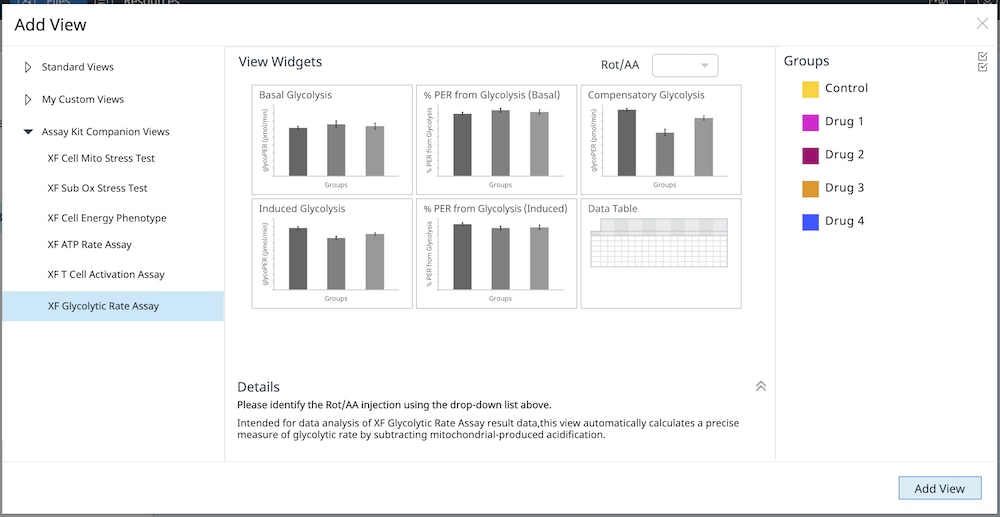
You can also add individual XF Glycolytic Rate Assay parameter widgets (i.e. Basal Glycolysis) to an existing analysis view:
a. Click the Add Widget button (pictured right outlined in red).
b. Expand the XF Glycolytic Rate Assay widget list, select the desired widget and click Add Widget.
Important: For Induced XF Glycolytic Rate Assay (1 or 2 injections prior to standard injections of rontenone/antimycin A and 2-DG),, you must identify the Rotenone/Antimycin-A injection using the drop-down menu seen above the widget before you can add this analysis view. This Rotenone/Antimycin-A injection selection plays a critical role in correctly calculating assay parameters; incorrect Rotenone/Antimycin-A injection selection will result in incorrect widget calculations and graphs.
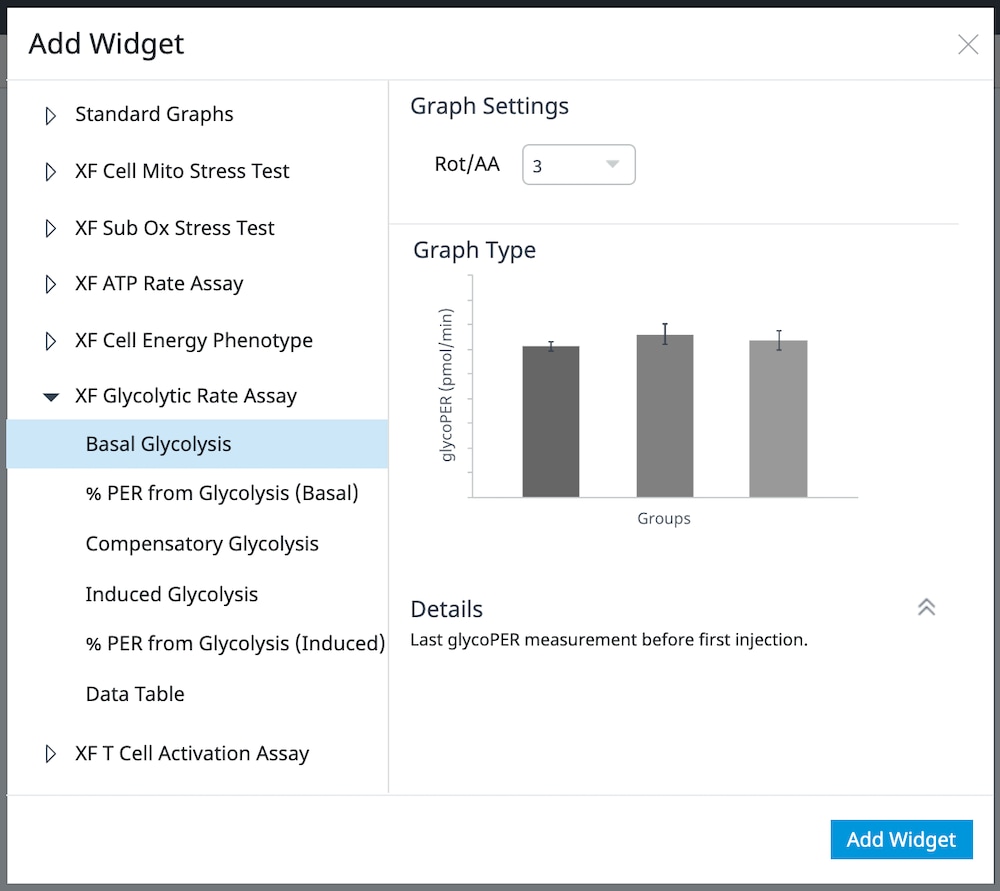
The table below describes the XF Glycolytic Rate Assay parameter calculations for both the standard and induced assay workflow:.
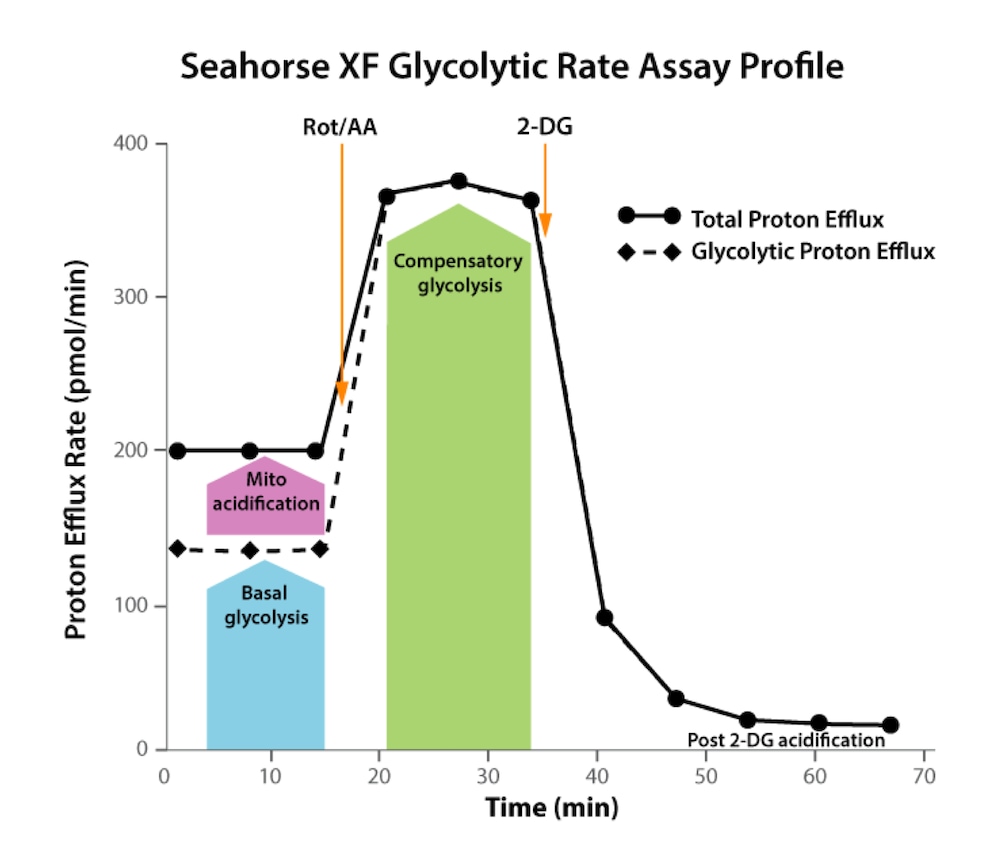
Standard XF Glycolytic Rate Assay
| Assay Parameter | Equation |
|---|---|
| Basal Glycolysis | Last glycoPER measurement before first injection |
| Basal Proton Efflux Rate (PER)* | Last PER measurement before first injection |
| % PER from Glycolysis (Basal) | (Basal Glycolysis) / (Basal PER) x 100% |
| * Denotes this parameter is not reported individually in Seahorse Analytics but used to calculate other reported parameter values. | |
Induced XF Glycolytic Rate Assay
| Assay Parameter | Equation |
|---|---|
| Basal Glycolysis | Last glycoPER measurement before first injection |
| Basal Proton Efflux Rate (PER)* | Last PER measurement before first injection |
| % PER from Glycolysis (Basal) | (Basal Glycolysis) / (Basal PER) x 100% |
| Compensatory Glycolysis | Maximum glycoPER measurement after Rot/AA injection |
| Induced Glycolysis | Average of the glycoPER measurements after the induced assay injection and before Rot/AA injection |
| Induced PER* | Average of the PER measurements after the induced assay injection and before next injection |
| % PER from Glycolysis (Induced) | (Induced Glycolysis) / (Induced PER) x 100% |
| * Denotes this parameter is not reported individually in Seahorse Analytics but used to calculate other reported parameter values. | |
Editing graphed widget data: To customize the data graphed for a widget, double-click the widget to open the widget-editor view. There are different ways you can customize the data graphed for a specific widget. It is important to remember the plate maps for each widget are independent, meaning the changes you make on the widget-editor view will ONLY be applied to that respective widget.
The functions in the ribbon above each graph provides editing functions specific for that widget type, such as changing the rate data type, toggling normalization on/off, or looking at data well-by-well rather than as group averages. Refer to the different widget descriptions for more information on these functions and how to use them.

The plate map to the right of the graph allows you to include or exclude specific assay wells from calculations and graphed data for the selected widget type.
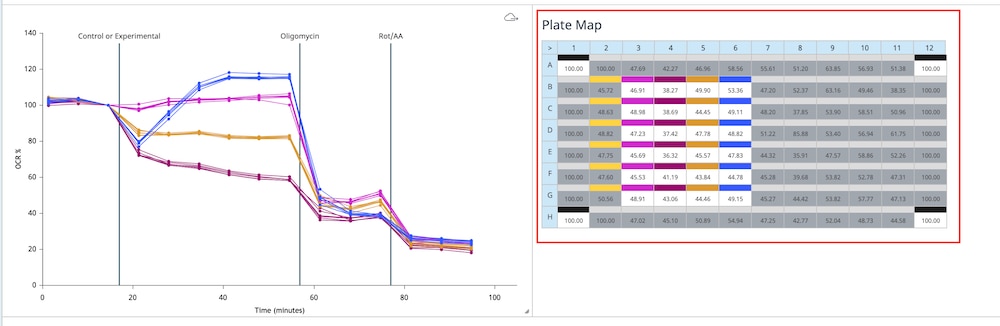
The group list below the widget shows you group average and error data for the selected widget type. You can double-click a group name to show or hide all data in that group from the widget graph. Assay wells turned off on the plate map are not included in the values seen in the group list. When a group is excluded from the graphed data, the group will appear grayed-out as seen in the “Control” group in the image below.
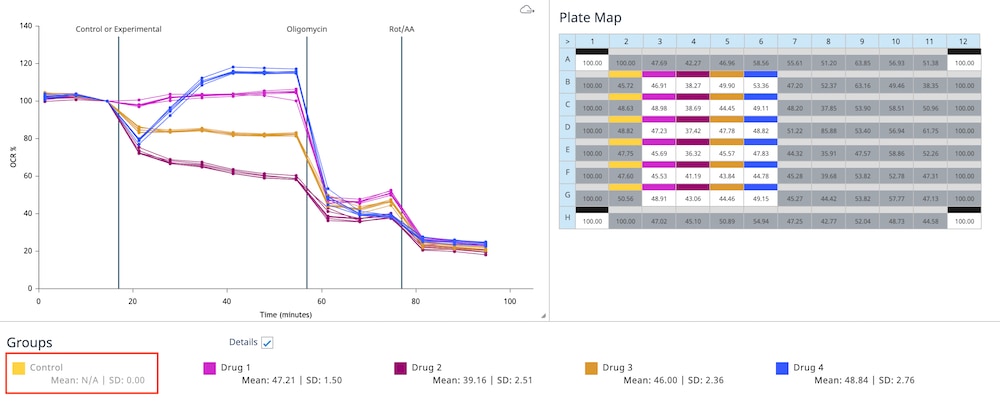
Define Buffer Factor
A common analysis workflow is to define buffer factor for your assay media and background wells in an assay result file. This information is required to calculate Proton Efflux Rate (PER), which is calculated and displayed in many widgets on several assay kit companion analysis views in Seahorse Analytics (i.e. XF T Cell Activation assay). Attempting to add an analysis view to an assay result file that does not have buffer factor properly configured will result in an error message (pictured below). Once buffer factor is properly assigned to your the media and background wells in the assay result file, the desired widgets and/or analysis views can be opened.
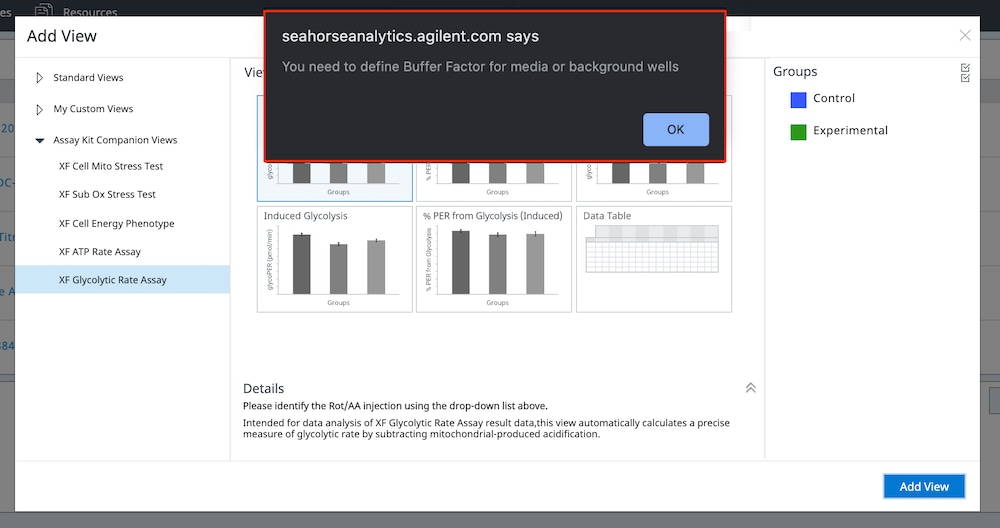
Steps to resolve the buffer factor error – If you see the error pictured above when adding the first analysis view to a data file, start at step 1 below. If you already have an analysis view open in the data file, start from step 3.
- Click OK to dismiss the error dialog.
- On the Add View window, select Standard Views > Quick View and choose the OCR kinetic graph widget.
- From the analysis view, click Modify (upper-right corner of the dark blue ribbon at the top of the application).
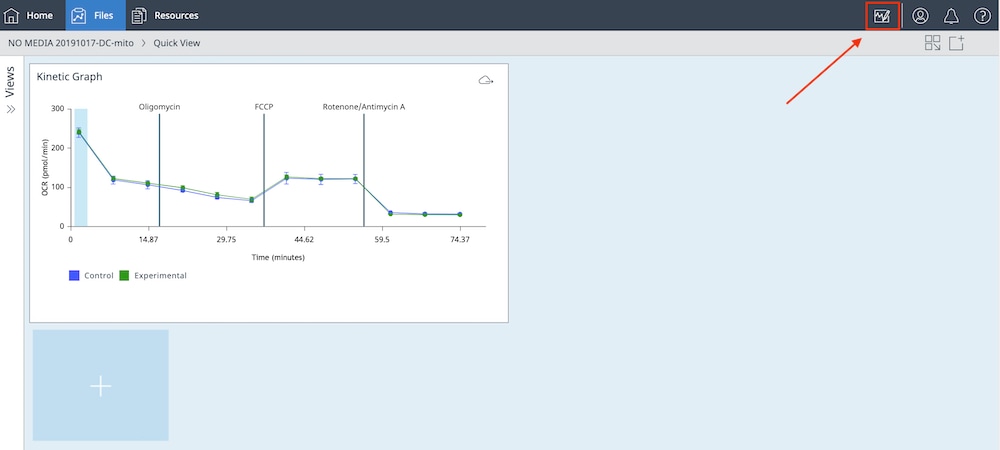
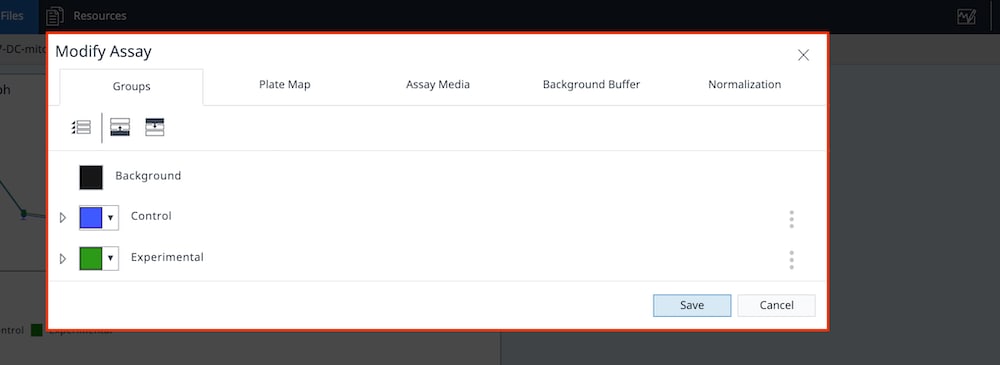
- Click the Assay Media tab to confirm buffer factor is assigned to your assay media group definitions. If you don’t see a buffer factor value here, you can use the Media Type drop-down menu to select the correct Agilent Seahorse XF Assay Medium.
Both the Seahorse XF RPMI and DMEM Medium, pH 7.4 options will automatically assign buffer factor to your media. If you are using a custom assay media, you will need to input the buffer factor of your custom media.
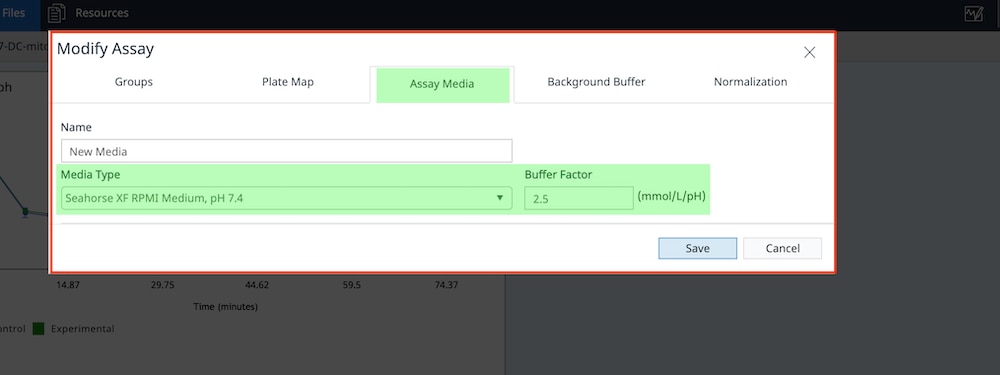
- Click the Background Buffer tab to confirm buffer factor is assigned to your background wells. If you check the Use Default BF box to confirm the use of Seahorse XF RPMI and DMEM Medium, pH 7.4 and a buffer factor value will be automatically imported. If you are using a custom assay media, you will need to input the buffer factor of your custom media.
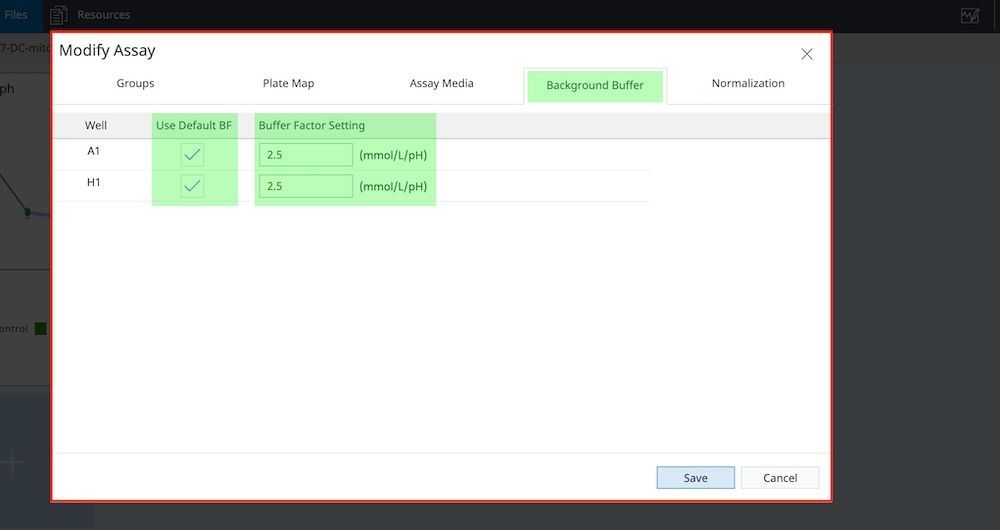
- Click the Groups tab to confirm the assay medium is assigned to each assay group.
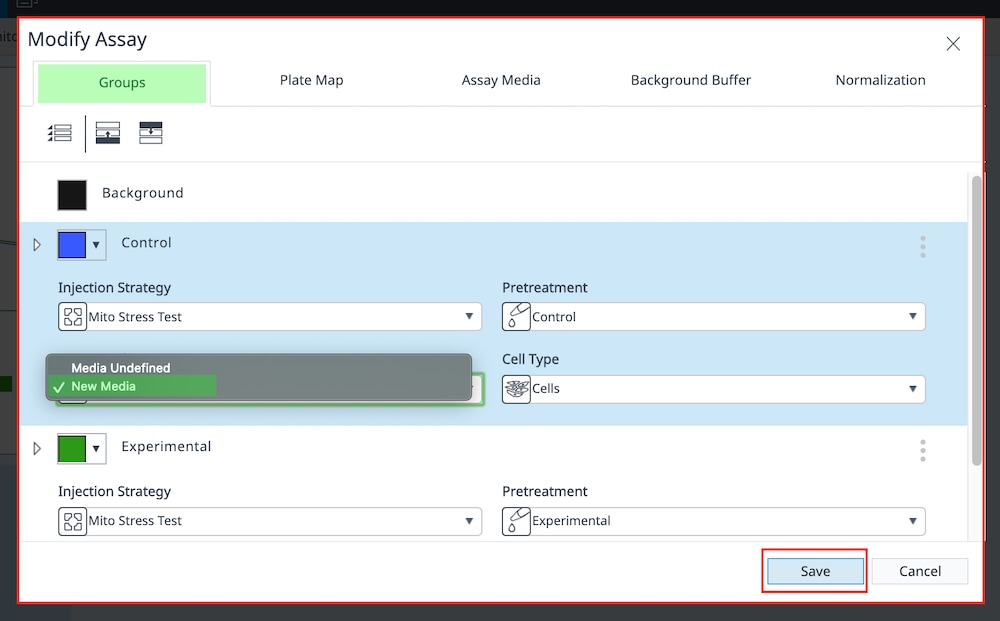
- Once finished click Save. Once you have performed (or corrected) the above steps you should be able to add your analysis view (or widget) to the data file. If you still are seeing the “you need to define buffer factor for media or background groups” after performing these steps, please contact Agilent Cell Analysis Support at: cellanalysis.support@agilent.com
Related Support Material
Reference Material
Cellular oxygen (O2) consumption (respiration) and proton (H+) release (glycolysis) cause rapid, measurable changes to the concentrations of extracellular oxygen and protons in the surrounding assay media. Agilent Seahorse XF Analyzers measure changes in the concentration of extracellular oxygen and protons in real-time. Using Seahorse Analytics or Wave Pro software, one can access & review the following types of data:
1. Rate Data is the primary output of Seahorse XF analyzers. The primary types of rate data calculated and reported in Seahorse Analytics or Wave Pro are:
Oxygen Consumption Rate (OCR): A quantitative measurement of oxygen consumption by the sample in the well. Reported in units of picomole/minute (pmol/min) vs. time.
Reflects cellular and mitochondrial respiration over time.
Oxygen Consumption Rate (OCR) data displayed in Rate mode (A).
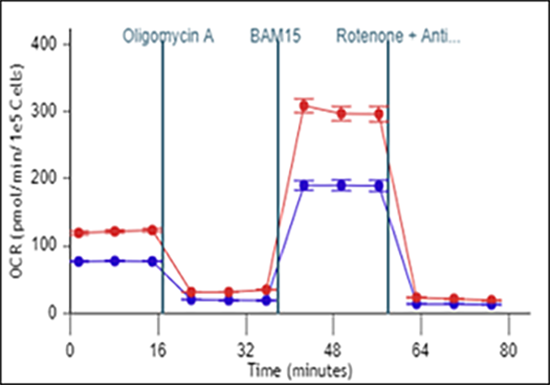
Extracellular Acidification Rate (ECAR): A qualitative measurement of proton release into the extracellular medium over time, reported as milli-pH/minute (mpH/min) vs. time.
Reflects total proton release from the cell over time, including acidification due to glycolysis AND mitochondrial respiration.
Extracellular Acidification Rate (ECAR) data displayed in Rate mode (B).
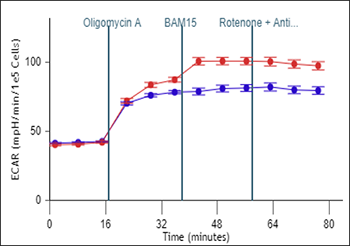
Proton Efflux Rate (PER): Derived from ECAR, PER is A quantitative measure of total extracellular acidification that is reported in picomole/minute (pmol/min) vs. time. Calculation of PER accounts for assay media buffering capacity and XF plate geometry.
As with ECAR, PER reflects total proton release from the cell, including acidification due to glycolysis AND mitochondrial respiration.
In certain cases (specific XF Kits), PER data may be further transformed to glycoPER and mitoPER, which are quantitative measurements of PER due to glycolytic and mitochondrial activity, respectively.
Note that PER is not calculated during assay runtime. PER is only available in post-run assay result analysis
Proton Efflux Rate (PER) data displayed in Rate mode (C).
Note: See Data Analysis section for information on transformed data, including ATP Production Rates.
For recommended ranges of OCR, ECAR and PER, including U/LLOD, please see
Agilent Seahorse XF Pro Instrument performance specification sheet
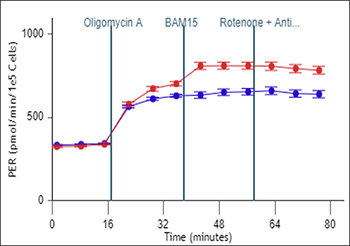
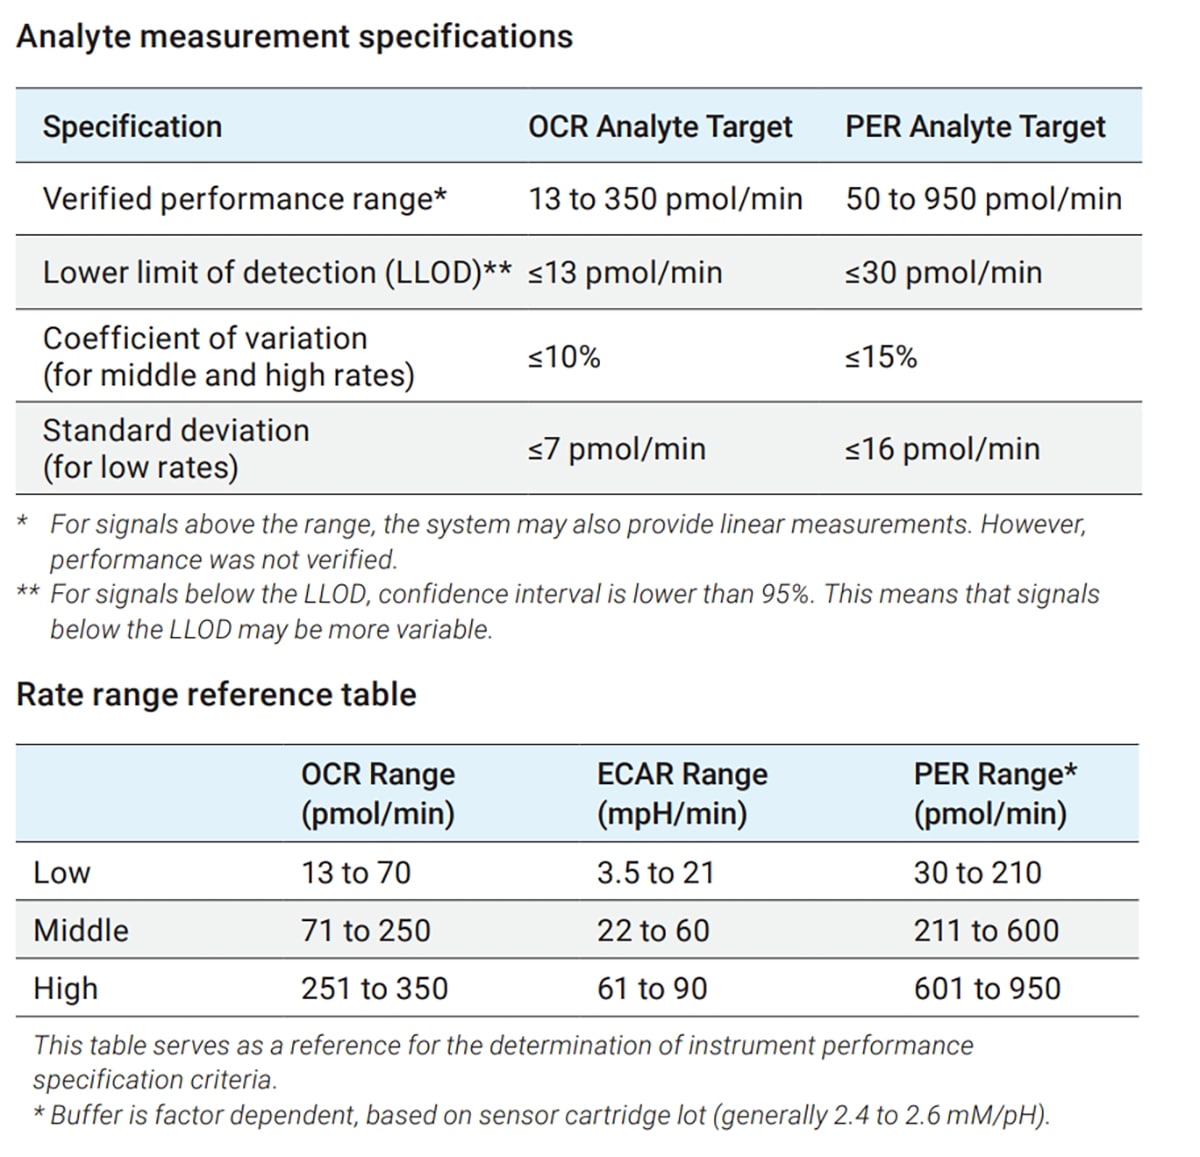
Level Data O2 and pH, are used to calculate rate data, OCR and ECAR, respectively.
Oxygen Concentration (O2 tension in mmHg): Level O2 data correlates to changes in oxygen concentration (reported as O2 tension in mmHg) vs. time. As cells (or other biological material) consume oxygen during a rate measurement cycle, the oxygen concentration in the assay media will decrease.
This decrease in oxygen concentration is used to calculate the rate of oxygen consumption, OCR in pmol/min.
Oxygen tension (O2) data displayed as mmHg vs. time (pictured right).
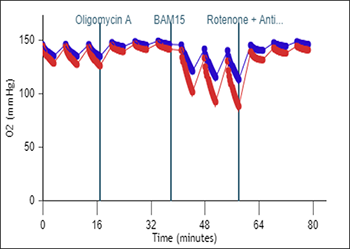
Proton Concentration (pH): Level pH data correlates to changes in H+ concentration (reported as pH) vs. time. As cells (or other biological material) release protons during a rate measurement cycle, the concentration of H+ in the assay media will increase.
This increase in proton concentration is used to calculate the rate of extracellular acidification consumption, ECAR in mpH/min.
Proton concentration (pH) data is displayed as pH vs. time (pictured right).
In general: Background and Sample wells (37°C, normoxia, ATM = 760 mmHg
Starting O2 = 160 mmHg +/- 10 mmHg
Should not go below 40 mm Hg
Starting pH = 7.4 +/- 0.1
Should not go below pH 6.5
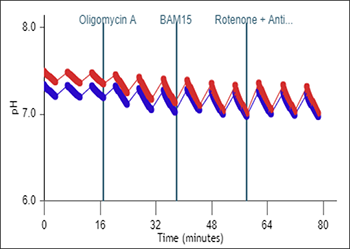
Data QC feature will provide the user warning/error if the O2 or pH level data shows deviations from acceptable ranges or values.
For recommended ranges of O2 and pH level data please see
The Data Quality Analysis View in Agilent Seahorse Wave Pro and Agilent Seahorse Analytics software
5.3 Types of Data
5.3 Data Quality Review
Cellular oxygen consumption (respiration) and proton excretion (glycolysis) cause rapid, easily measurable changes to the concentrations of extracellular oxygen and protons. Agilent Seahorse XF Analyzers measure changes in concentration of extracellular oxygen and protons in real-time. Using Seahorse Analytics, you can easily access & review the following types of data:
1. Rate Data is the primary output of all Seahorse XF analyzers. The 3 types of rate data calculated & reported in Seahorse Analytics are:
Oxygen Consumption Rate (OCR): A quantitative measurement of oxygen consumption by the sample in the well, and thus a measure of cellular and mitochondrial respiration over time. Reported in units of picomole/minute (pmol/min) vs. time. Oxygen Consumption Rate (OCR) data is displayed in Rate mode (pictured right). When you add a kinetic graph to your analysis view using the Add Widget function, the rate displayed by default is OCR.
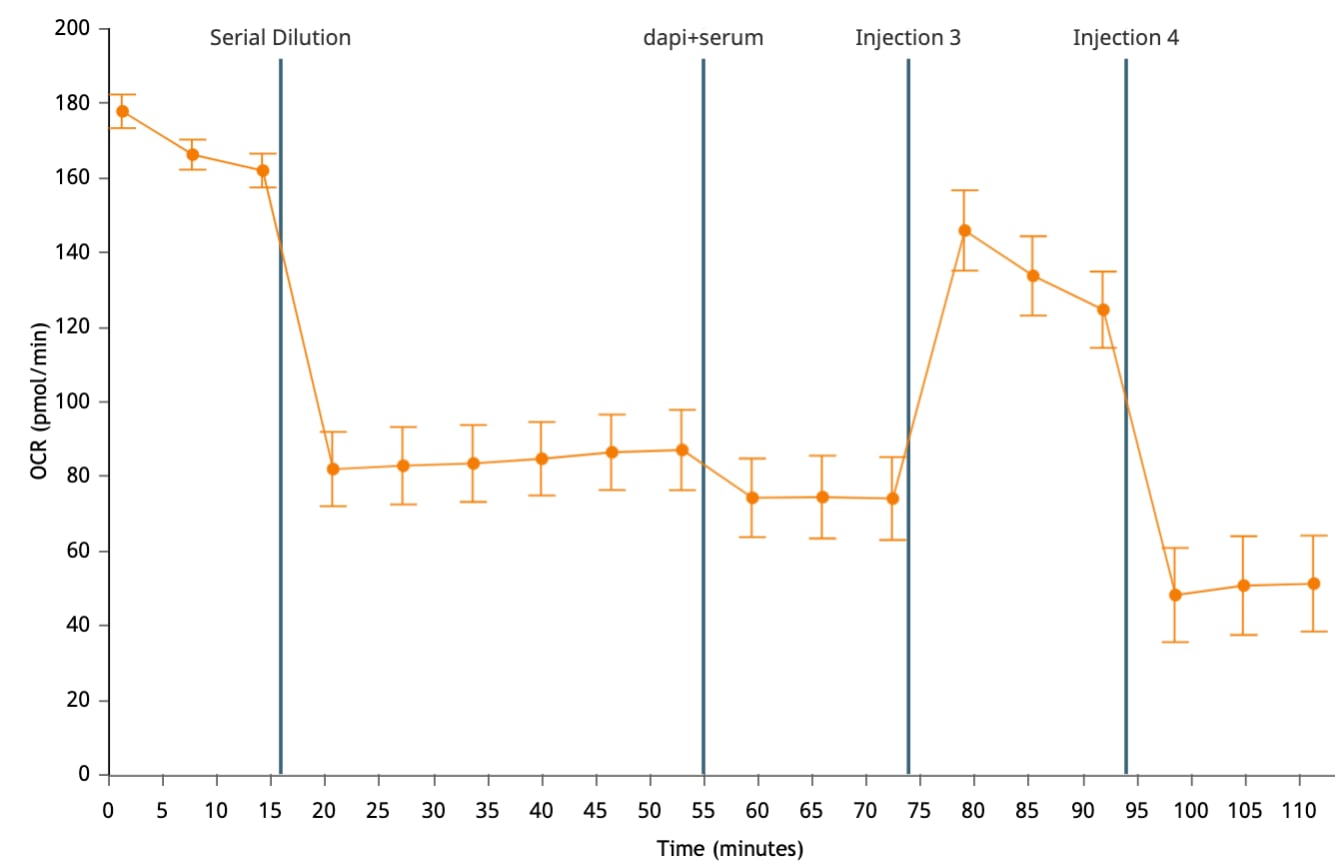
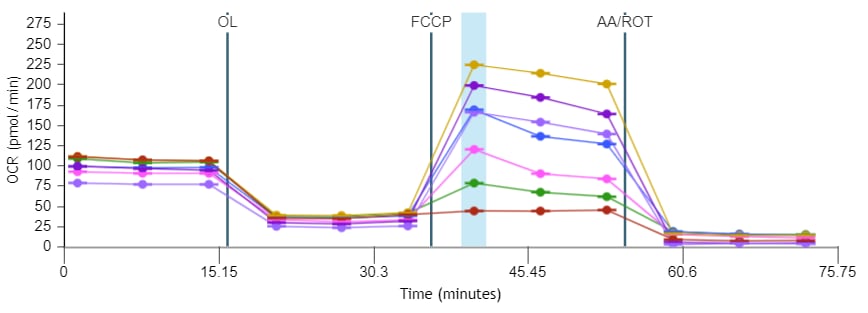
Important! For un-coated cell plates, the recommended general OCR data range for the (XFe96, XFe24, XFp, XF HS Mini) is:
- Background Wells: 0 ± 20 (pmol/min) at 37 °C
- Assay Wells: 20-160 / 50-400 (pmol/min) at 37 °C for baseline measurements.
Please note these values are general recommendations and can differ based on assay and/or cell type analyzed.
Extracellular Acidification Rate (ECAR): A qualitative measurement of proton extrusion in the extracellular medium over time, reported as milli-pH/minute (mpH/min) vs. time. Extracellular Acidification Rate (ECAR) data is displayed in Rate mode (pictured right). You can display ECAR data on the kinetic graph widget-editor view using Rate drop-down menu control above the kinetic graph.
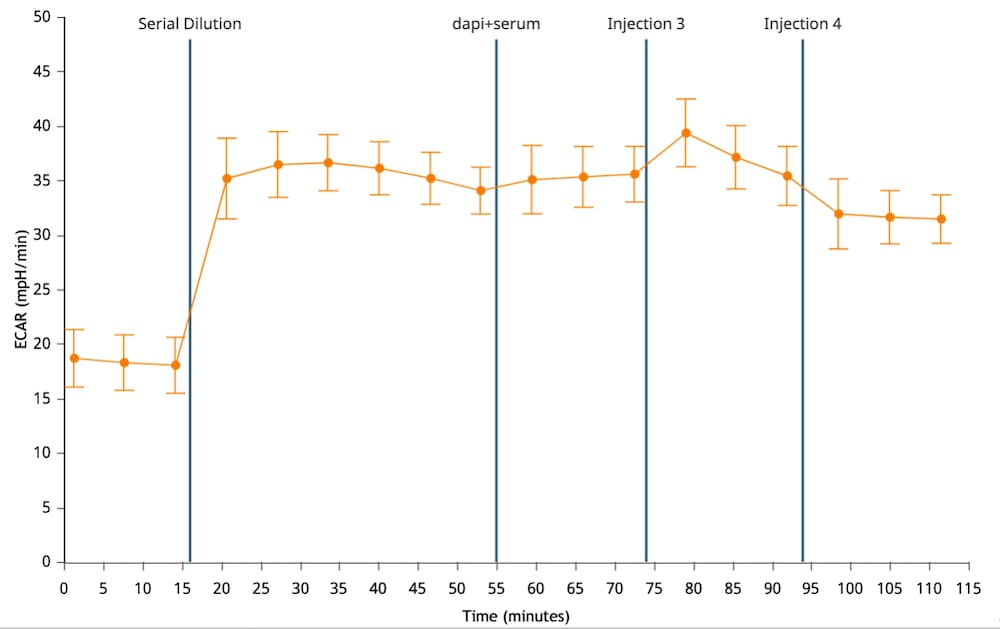
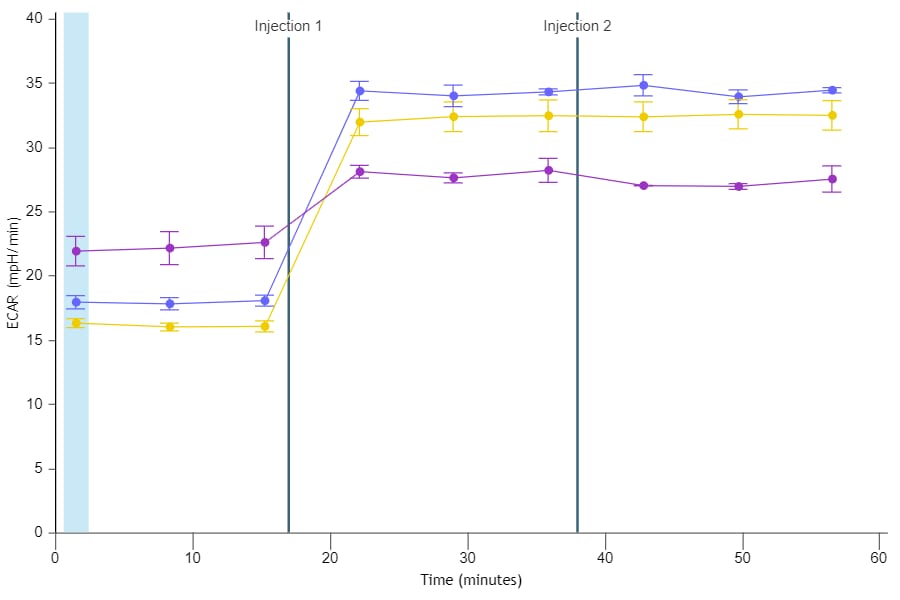
Important! For un-coated cell plates, the general range for ECAR data for the (XFe96, XFe24, XFp, XF HS Mini) is:
- Background Wells: 0 ± 10 (mpH/min) at 37 °C
- Assay Wells: 10-90 / 20-120 (mpH/min) at 37 °C for baseline measurements.
Please note these values are general recommendations and can differ based on assay and/or cell type analyzed.
Proton Efflux Rate (PER): A quantitative measure of extracellular acidification that accounts for media buffering capacity and plate geometry. Reported in picomole/minute (pmol/min) vs. time. Only available in post-run assay result analysis. PER is not calculated during assay runtime. You can display PER data on the kinetic graph widget-editor view using Rate drop-down menu control above the kinetic graph.
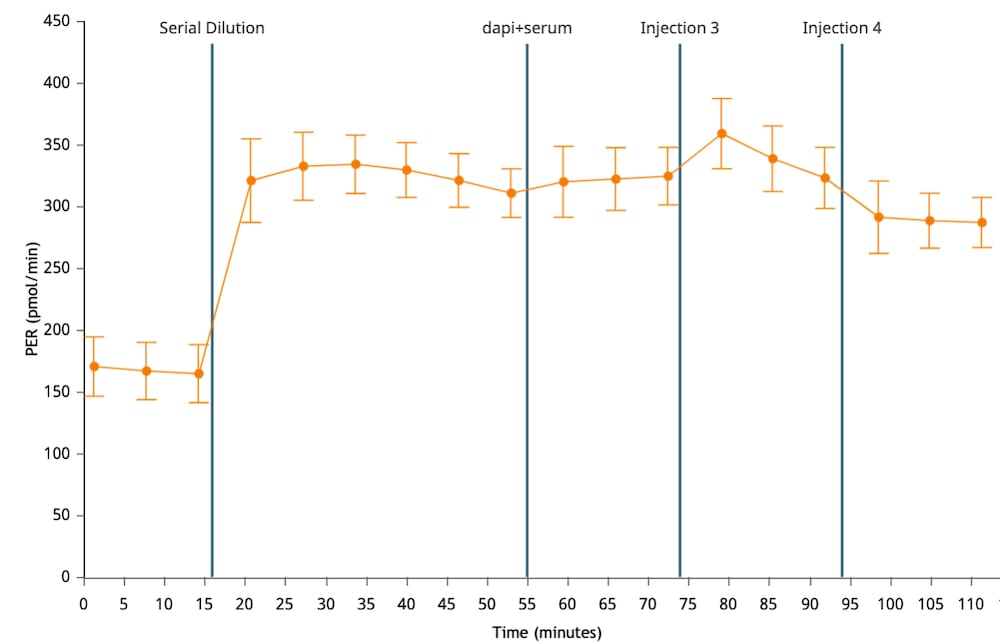
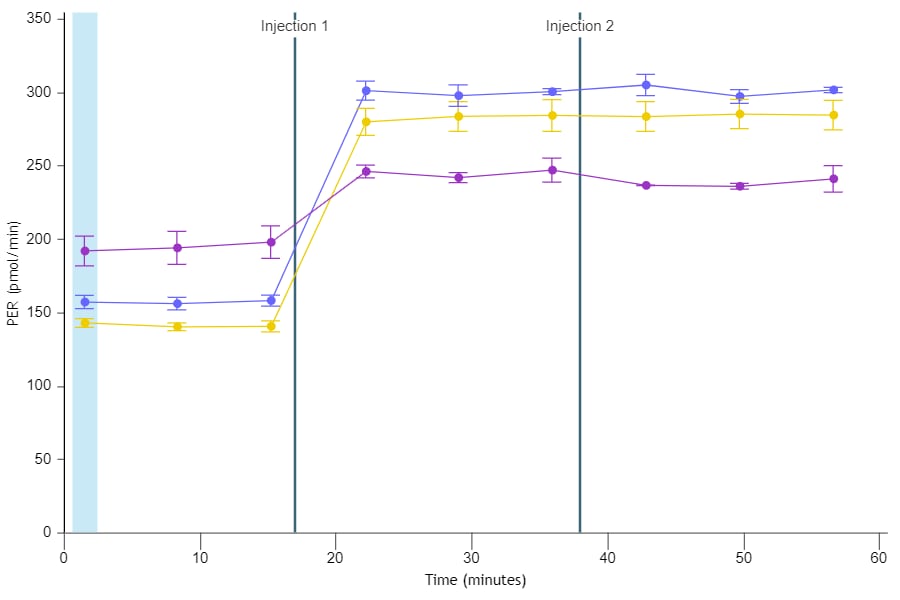
2. Level Data is used to calculate rate data and used for data quality assessment – typically the first step of the XF analysis workflow.
Oxygen Concentration (O2 tension in mmHg): As cells (or other biological material) consume oxygen during a rate measurement cycle, oxygen concentration in the assay media will decrease. This decrease in oxygen concentration is used to calculate the rate of oxygen consumption (OCR in pmol/min). You can display oxygen tension level data on the kinetic graph widget-editor view by toggling Level for Y1 located above the kinetic graph. Oxygen tension (O2) data is displayed as mmHg vs. time (pictured right).
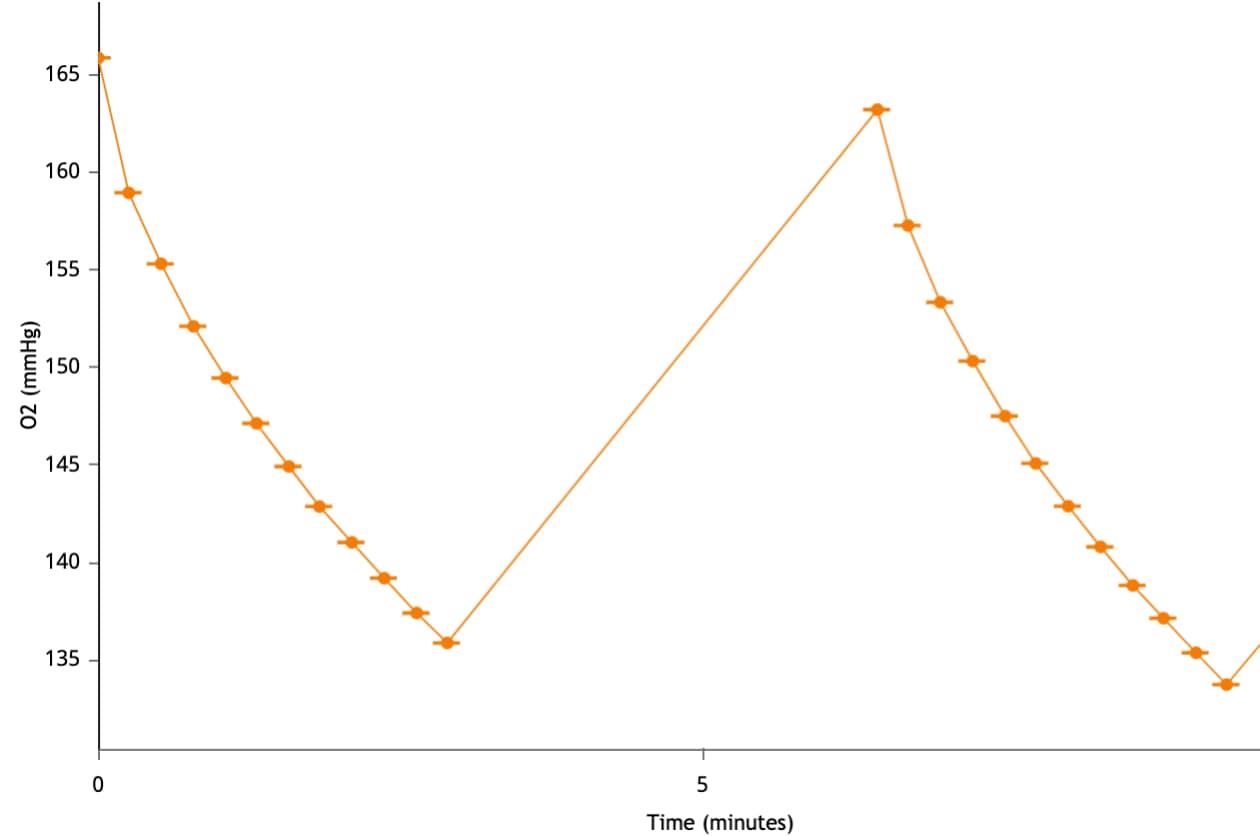
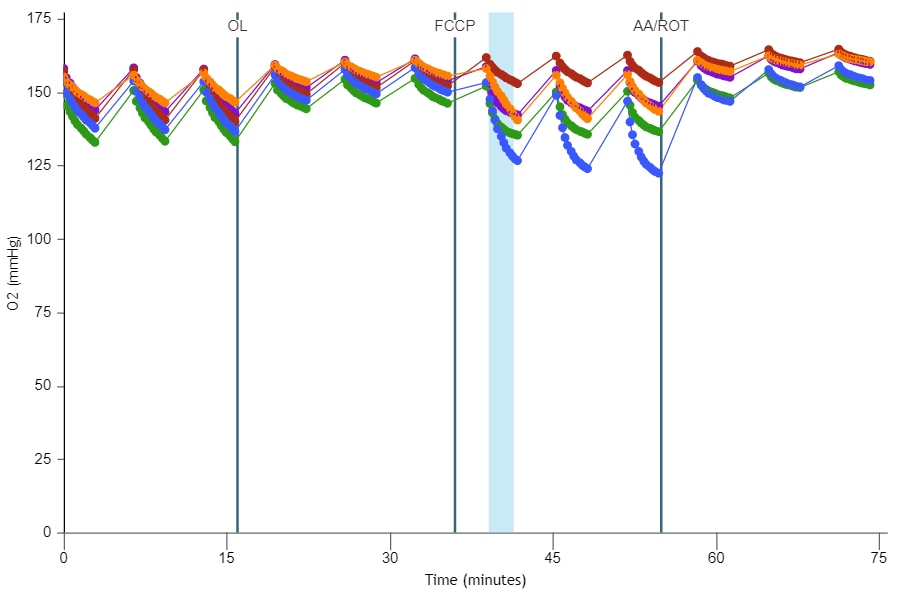
Important! It is recommended to examine the oxygen tension (O2) level data for each assay result file. Using un-coated cell plates, the starting recommended oxygen tension (O2) level data is:
- Background Wells: 152 ± 10 (mmHg) at 37 °C
- Assay Wells: 152 ± 10 (mmHg) at 37 °C
- Oxygen tension at the end of a measurement cycle should not go below 2040 mmHg
- Oxygen tension at the beginning of the next measurement cycle should be equivalent to the starting oxygen tension of the previous measurement(s).
Please note these values are general recommendations and can differ based on assay and/or cell type analyzed.
Proton Concentration (pH): As cells (or other biological material) extrude protons during a rate measurement cycle, proton concentration in the assay media will increase. The concentration of protons in the microchamber is measured throughout an XF assay and calculated as the rate of extracellular acidification (ECAR in mpH/min). You can display proton concentration level data on the kinetic graph widget-editor view by first selecting ECAR using the Rate drop-down menu, then toggling Level for Y1. using the control above the kinetic graph. Proton concentration (pH) data is displayed as pH vs. time (pictured right).
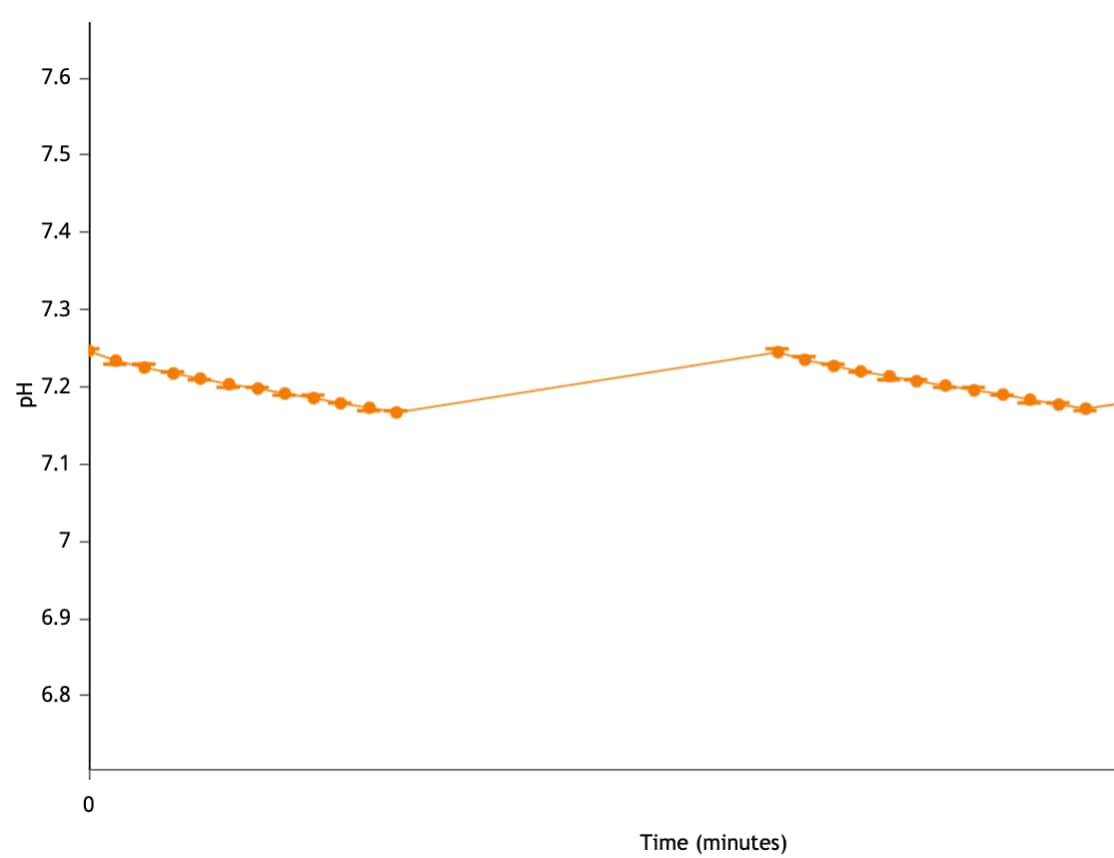
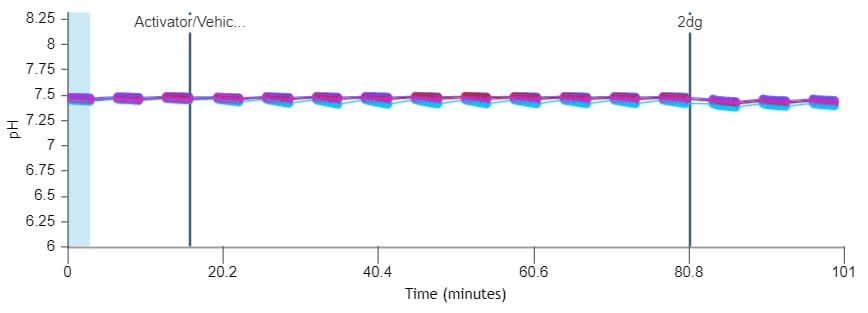
Important! It is recommended to examine the proton concentration (pH) level data for each assay result file. Using un-coated cell plates, and the Agilent Seahorse XF DMEM or XF RPMI medium, pH 7.4, the starting recommended proton concentration (pH) level data range is:
- Background Wells: 7.4 ± 0.1 [pH] at 37 °C
- Assay Wells: 7.4 ± 0.1 [pH] at 37 °C
- The pH value at the end of a measurement cycle should not go below pH 6.4
- The pH value at the beginning of the next measurement cycle should be equivalent to the starting pH value of the previous measurement(s).
Please note these values are general recommendations and can differ based on assay and/or cell type analyzed.
Related Support Material
Reference Material
Prior to XF data analysis and/or transformation, it is recommended to first review the data file with respect to data quality and technical accuracy.
The Data Quality analysis view is an analysis feature available in Agilent Seahorse Analytics Web-based software and Agilent Seahorse Wave Pro software. This software feature automatically inspects data acquired during an XF assay for potential outliers or issues.
There are more than 25 different data quality tests performed; wells that contain data that exceed the warning and/or error test threshold values will be flagged for review and can be addressed directly from the Data Quality analysis view (e.g., unassign a well from a group, or flag for additional data review downstream).
The Data QC includes several primary and subsequent tests for
- Temperature Range
- Proper Calibration
- Accurate Background
- O2 and pH Level Data
- OCR, ECAR and PER Data
- Injection performance
The Data Quality analysis view is intended for analysis of data files generated following standard XF assay workflow parameters– 37 °C operation, normoxia conditions, etc. The Data Quality analysis view is not intended for the analysis of data files generated at temperatures other than 37 °C, in hypoxic conditions, 3D biomaterial.
For a full list of Data QC tests performed and instructions for using the Data QC feature, please see:
The Data Quality Analysis View in Agilent Seahorse Wave Pro and Agilent Seahorse Analytics software
5.4 Data Display Options
5.4 Data Analysis
Seahorse Analytics analysis view is a collection of widgets (graphs) in a single page. It is recommended to work with assay kit companion analysis views corresponding to the supported Agilent Seahorse XF assay workflows and protocols.
Assay Kit Companion Analysis View » XF Real-Time ATP Rate Assay: Follow the steps below to calculate and display the XF Real-Time ATP Rate Assay parameters in a single analysis view. Please note, buffer factor must be properly configured to add this analysis view and widgets from this analysis view to your assay result file.
- On the Add View window, click the Assay Kit Companion View list to expand the list of options.
- Click the XF ATP Rate Assay analysis view to display assay parameter widgets.
- For Induced XF ATP Rate assays (1 or 2 injections prior to standard injections of oligomycin and rotenone/antimycin A), you must identify whether oligomycin injection was injection 2 or injection 3 using the drop-down menu seen above the widgets to add this analysis view. This oligomycin injection selection plays a critical role in correctly calculating assay parameters; incorrect oligomycin injection selection will result in incorrect widget calculations and graphs. For more information on these two workflows please consult the XF Real-Time ATP Rate Assay User Manual.
- Select the desired parameter widgets to add to your analysis view. A blue outline around the widget indicates it is selected. If widget(s) are greyed out, this means they cannot be selected as the assay file does not have the minimum number of injections required to calculate the parameter(s).
- Turn OFF/ON groups in the group list if necessary, then click Add View
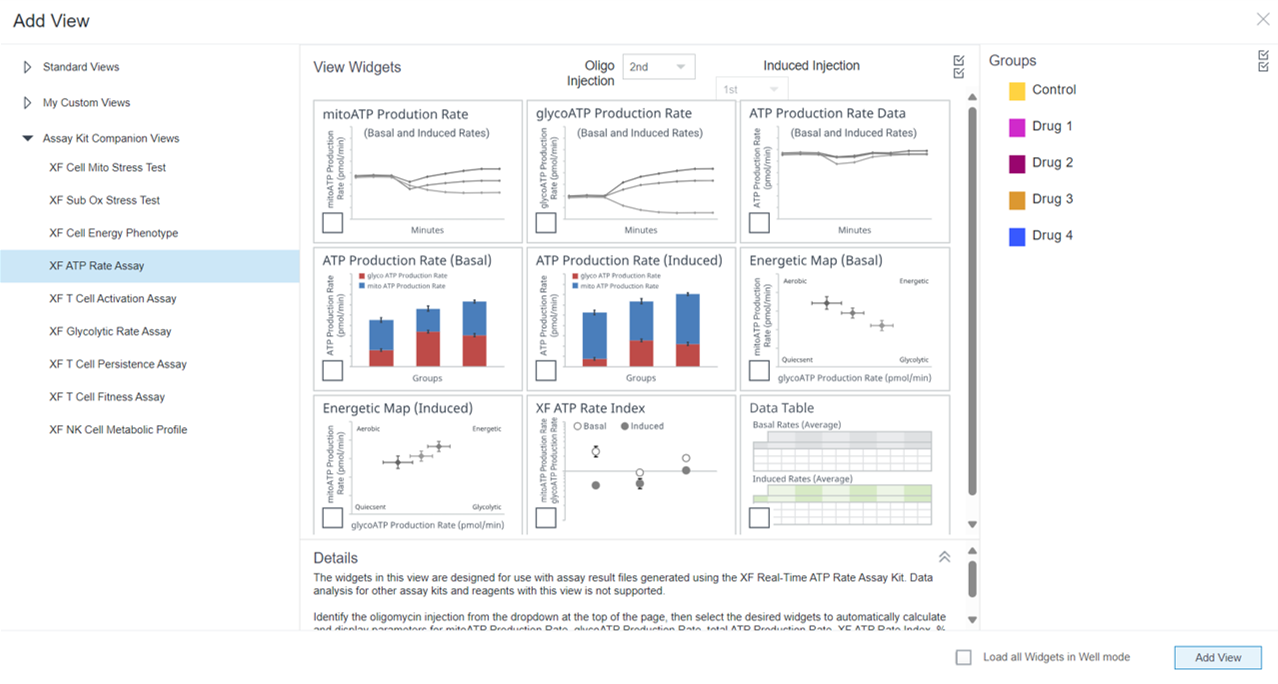
Assay Kit Companion Analysis View » XF Cell Mito Stress Test: To calculate and display the XF Cell Mito Stress Test assay parameters in a single analysis view:
- On the Add View window, click the Assay Kit Companion View list to expand the list of options.
- Click the XF Cell Mito Stress Test analysis view to display assay parameter widgets.
- Important: For XF Cell Mito Stress Test assays with 4 injections, you must identify the oligomycin injection using the drop-down menu seen above the widgets before you can add this analysis view. This oligomycin injection selection plays a critical role in correctly calculating assay parameters; incorrect oligomycin injection selection will result in incorrect widget calculations and graphs.
- Select the desired parameter widgets (e.g. basal respiration, maximal respiration, etc.) to add to your analysis view. A blue outline around the widget indicates it is selected. If the Acute Response widget is greyed-out, then it cannot be selected as this parameter can only be calculated for XF Cell Mito Stress Test assays with an acute injection.
- Turn OFF/ON groups in the group list if necessary, then click Add View
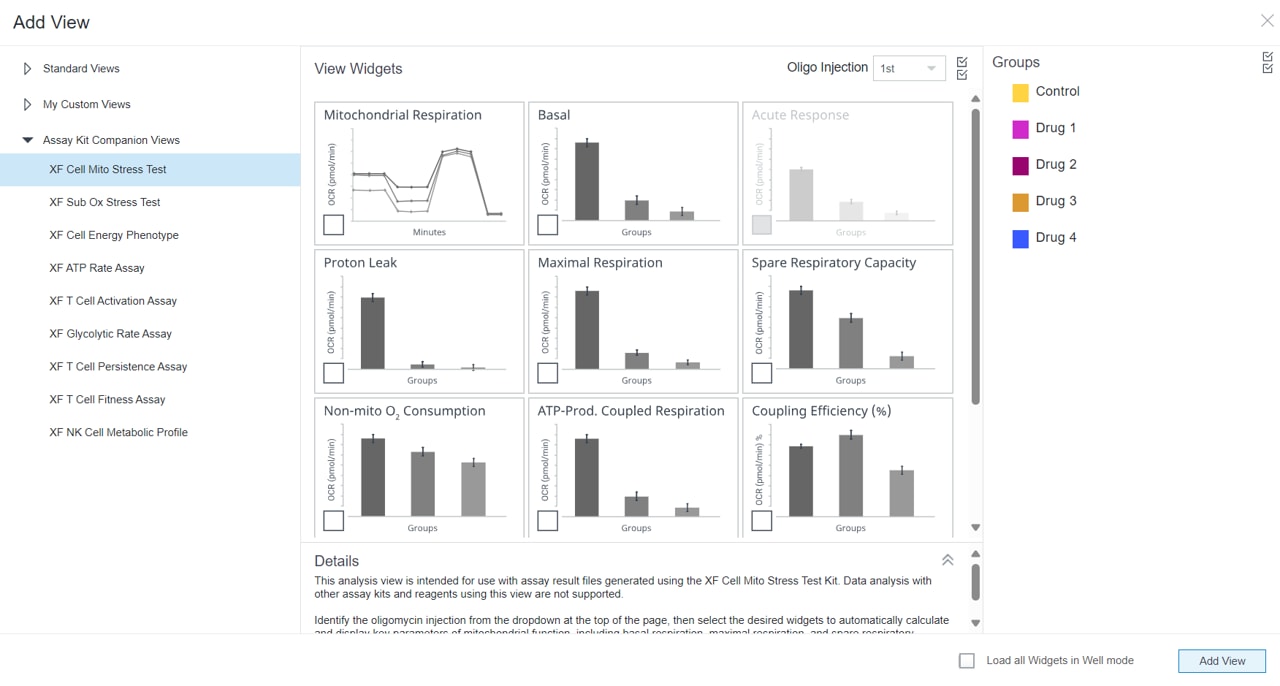
Assay Kit Companion Analysis View » XF Glycolytic Rate Assay: Follow the steps below to calculate and display the XF Glycolytic Rate Assay parameters in a single analysis view. Please note, buffer factor must be properly configured to add this analysis view and widgets from this analysis view to your assay result file.
- On the Add View window, click the Assay Kit Companion View list to expand the list of options.
- Click the XF Glycolytic Rate Assay analysis view to display assay parameter widgets.
- For Induced XF Glycolytic Rate Assay (1 or 2 injections prior to standard injections of rontenone/antimycin A and 2-DG), you must identify the Rotenone/Antimycin-A injection using the drop-down menu seen above the widgets before you can add this analysis view. This Rotenone/Antimycin-A injection selection plays a critical role in correctly calculating assay parameters; incorrect Rotenone/Antimycin-A injection selection will result in incorrect widget calculations and graphs. For more information about these 2 workflows, please consult the XF Glycolytic Rate Assay User Manual.
- Select the desired parameter widgets to add to your analysis view. A blue outline around the widget indicates it is selected. If widget(s) are greyed out, this means they cannot be selected as the assay file does not have the minimum number of injections required to calculate the parameter(s).
- Turn OFF/ON groups in the group list if necessary, then click Add View
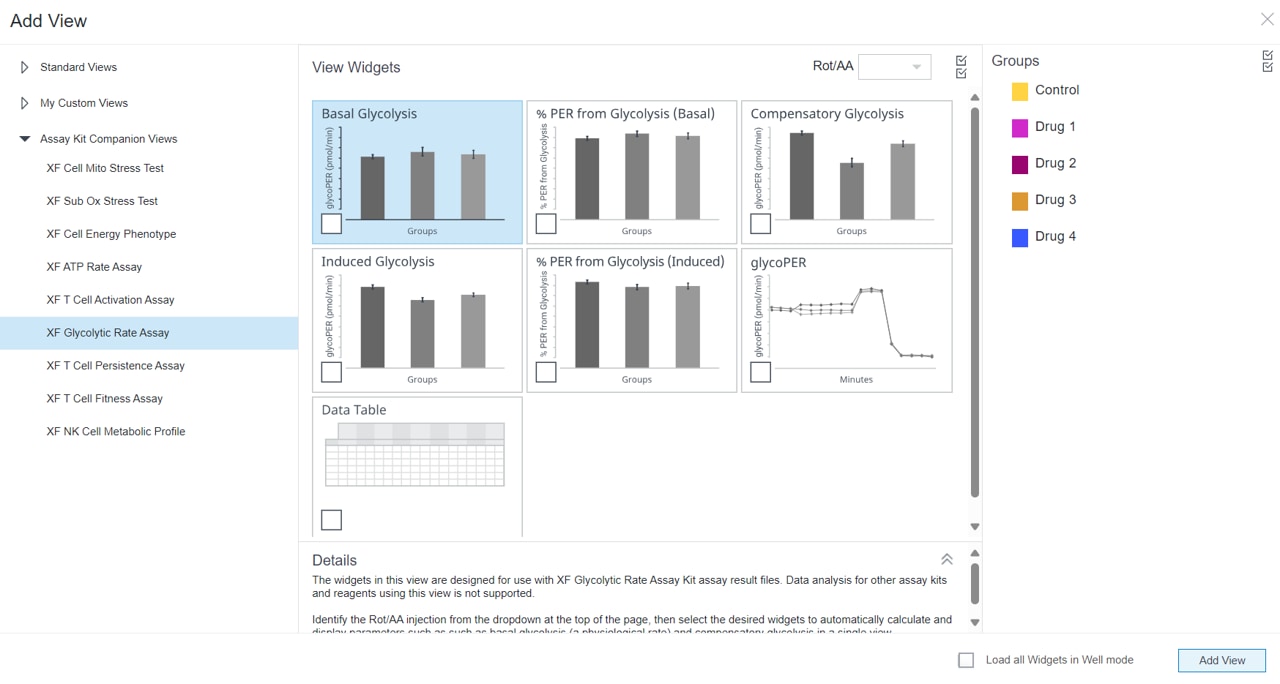
Agilent Seahorse Analytics provides a selection of graph types to analyze & interpret assay result data depending on the type of analysis view preferred. For more information about creating and customizing analysis views, please see the Analysis Views section.
1. Widget Types – Kinetic Graph: A kinetic graph is the most common way to display XF result data, where your x-axis is time (in minutes) and your y-axis is the rate of change in concentration of the analyte measured (O2 or H+). The two types of data you can display on the y-axis of the kinetic graph widget are (1) Rate data – as oxygen consumption (OCR), extracellular acidification (ECAR), proton efflux (PER) and (2) Level Data – as oxygen tension (mmHg), or proton concentration [mpH].
- Add Widget > Standard Graphs » Kinetic Graph:
Use the Standard Graphs » Kinetics Graph to create a bar chart of a selected rate type (OCR, ECAR, PER) and measurement.
You can add a kinetic graph widget to any analysis view in Seahorse Analytics by clicking the Add Widget button (pictured right outlined in red) and selecting Kinetic Graph (found in the Standard Graphs list).
Note: There are also several specialized kinetic graphs you can add to a custom view that are specific for analysis of XF Real-Time ATP Rate Assay result data – mitoATP production rate, glycoATP production rate, and total ATP production rate. You can find these widgets by clicking Add Widget and expanding the widget option list for the XF ATP Rate Assay (pictured right). For more information on the data calculated in these kinetic graphs, please review this white paper.
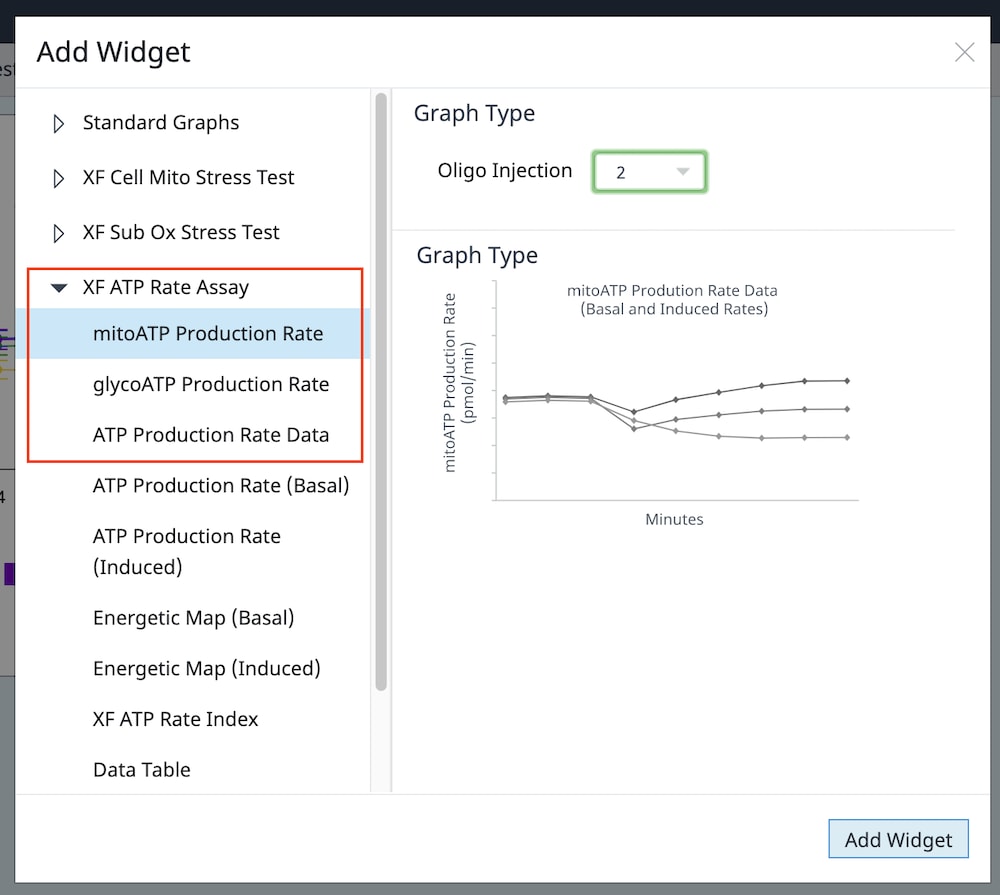
2. Widget Types – Bar Chart: A bar chart is another common way to present XF data, aiding users in routine XF analysis such as determining optimal FCCP concentration and cell seeding density. Seahorse Analytics provides a wide variety of bar chart options to add to an analysis view, and many are assay specific. For more information about specific bar chart widgets please refer to the specific assay kit companion analysis view here or in Seahorse Analytics.
- Add Widget > Standard Graphs » Bar Chart:
Use the Standard Graphs » Bar Chart widget to create a bar chart of a selected rate type (OCR, ECAR, PER) and measurement.
For example, to show OCR data from rate measurement 10 for all groups:
- Click the Add Widget button
- Expand the Standard Graphs list
- Select Bar Chart
- Click Add Widget
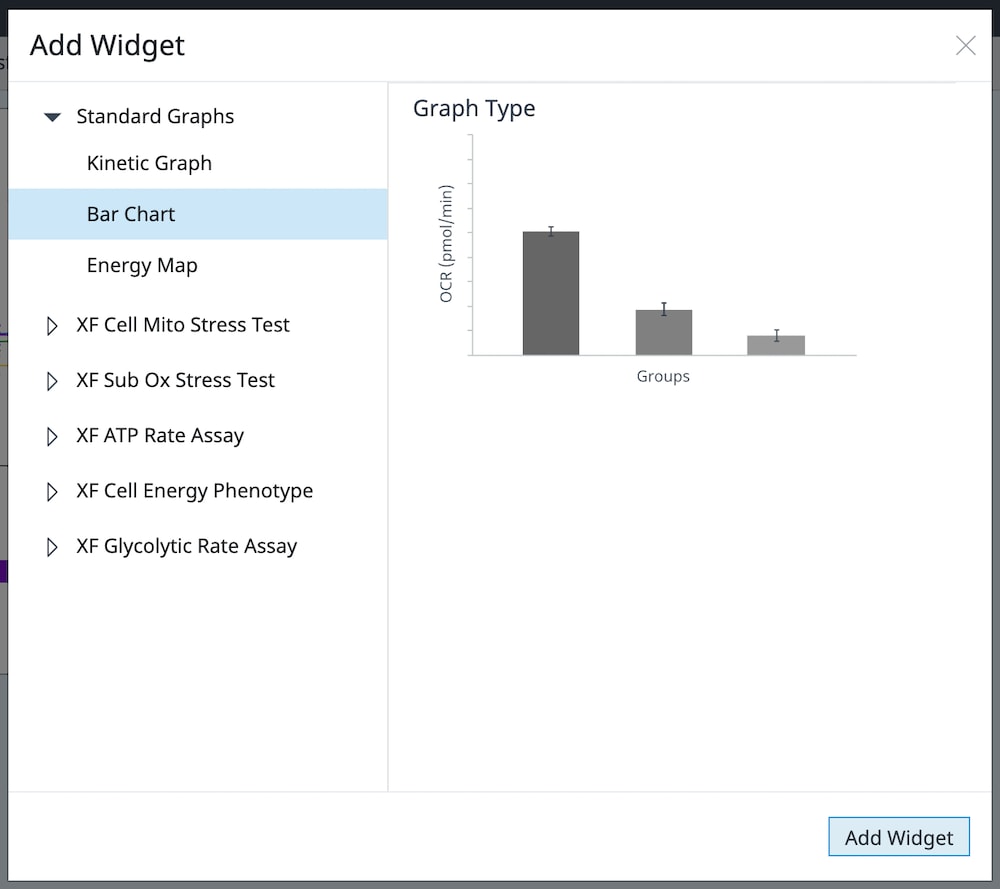
On the widget editor view, use the Rate drop-down menu to select rate measurement 10, then click the back arrow (upper-left corner of the widget editor view) to return to the analysis view.

3. Widget Types – Energy Map: An Energy Map widget is an X & Y scatter plot, allowing comparison of two types of rate data for a selected rate measurement for all or selected groups. In addition to the Energy Map widget described below, there are several additional scatter plot widget options you can add to your analysis views that are assay type dependent and defined in the Analysis Views section.
- Add Widget > Standard Graphs » Energy Map:
Use the Standard Graphs » Energy Map widget to create a scatter plot of oxygen consumption rate data (OCR) on the y-axis, and acidification rate data (ECAR or PER) is on the x-axis, depicting the relative pathway utilization for each group for the selected rate measurement.
Use the Measurement drop-down menu to display group data for another rate measurement in the assay.
Use the Rate drop-down menu to change the acidification rate on the x-axis to PER (or ECAR); OCR is always displayed on the y-axis.
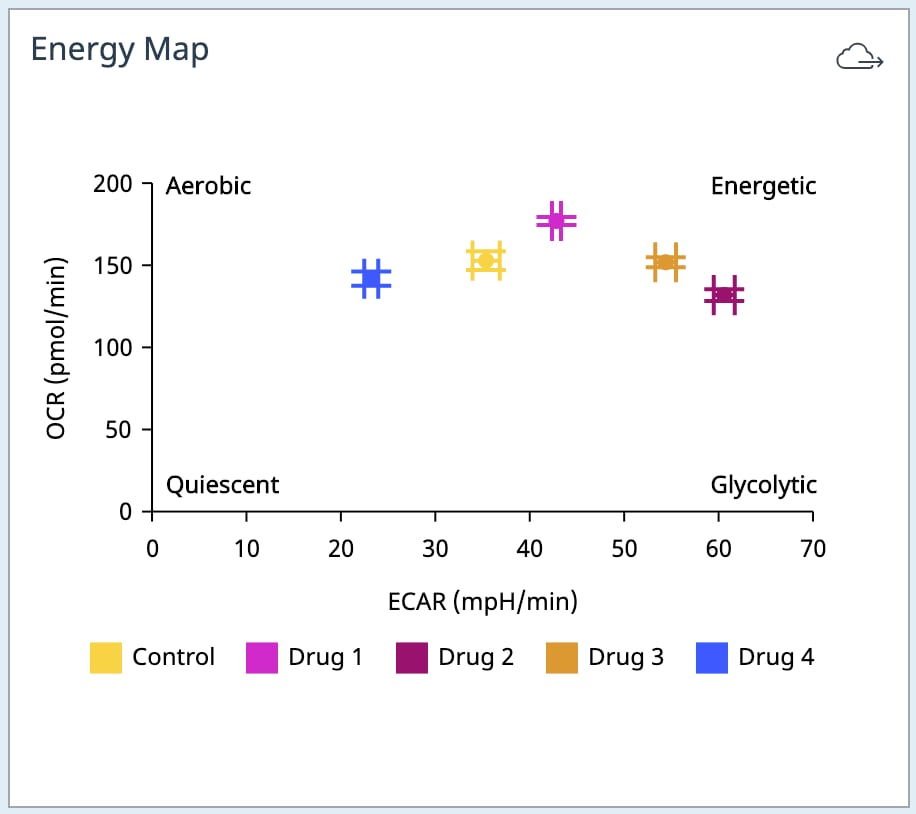
- Add Widget > XF ATP Rate Assay » Energetic Map (Basal) widget:
The Energetic Map (Basal) data widget is found in the XF ATP Rate Assay widget list and can be applied for analysis of both the standard and induced workflows for the Agilent Seahorse XF Real-Time ATP Rate assay. For more information on these two workflows please consult the XF Real-Time ATP Rate Assay User Manual. Please also note that buffer factor must be properly assigned to the assay media, background wells, and assay groups to calculate this widget data.
The Energetic Map (Basal) widget plots the basal mitoATP production rate on the y-axis, and the basal glycoATP production rate on the x-axis (pictured below, left). Calculations used for this widget can be found in the details on the Add Widget dialog (pictured right).
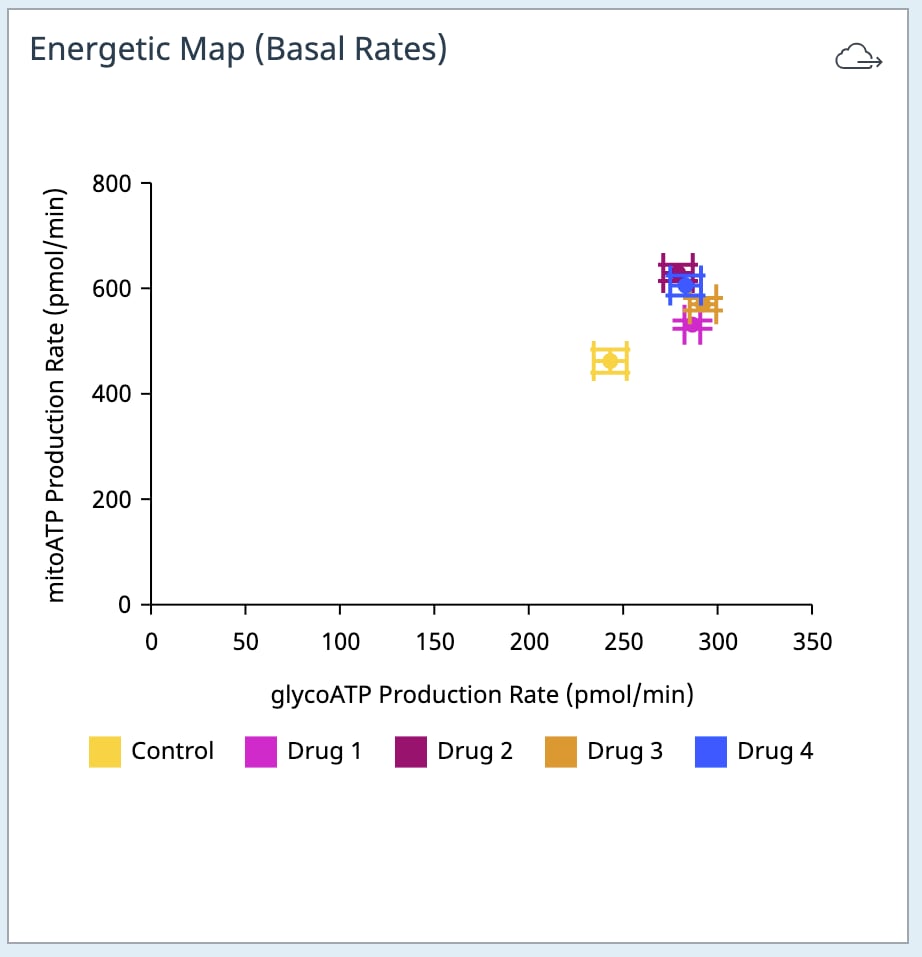
For XF ATP Rate assays with more than 2 injections, you must identify the oligomycin injection using the drop-down menu seen on the Add Widget (pictured right) before you can add this widget to your analysis view. Why? This oligomycin injection selection plays a critical role in calculating the correct Basal ATP production rates that you will see on the widget. Incorrect selection of the oligomycin injection will result in incorrect calculations and data.
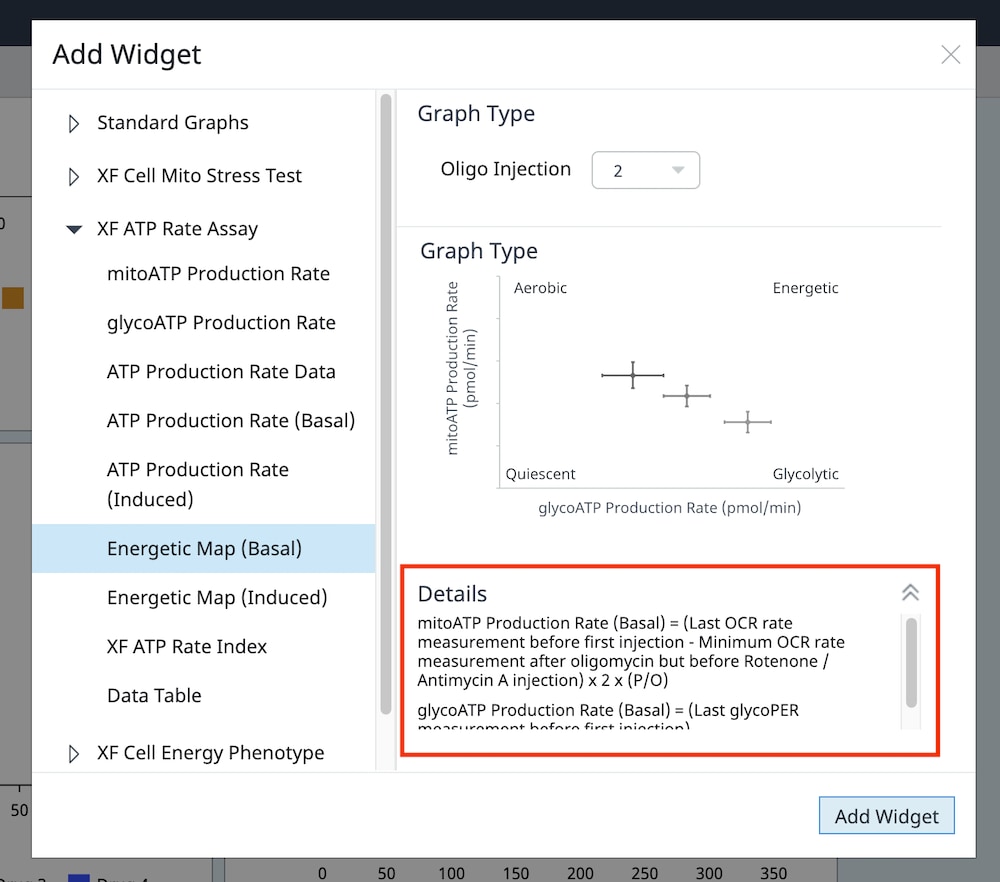
- Add Widget > XF ATP Rate Assay » Energetic Map (Induced) widget:
The Energetic Map (Induced) data widget is also found in the XF ATP Rate Assay widget list but can only be applied to the induced assay workflow for the Agilent Seahorse XF Real-Time ATP Rate assay. For more information about the induced assay workflow please consult the XF Real-Time ATP Rate Assay User Manual. Please also note that buffer factor must be properly assigned to the assay media, background wells, and assay groups before you can calculate this widget data.
The Energetic Map (Induced) widget plots the induced mitoATP production rate on the y-axis, and the induced glycoATP production rate on the x-axis (pictured right). Calculations used for this widget can be found in the details on the Add Widget dialog (pictured below, right).
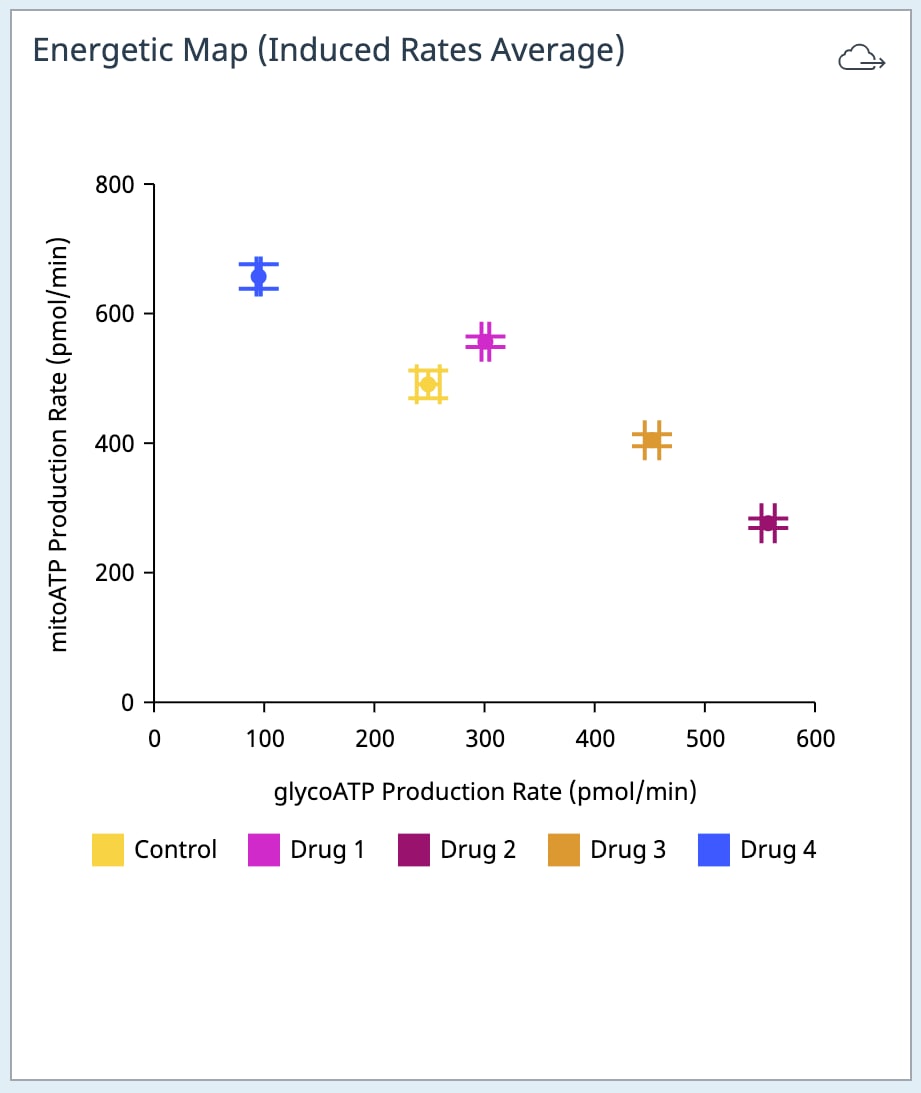
For XF ATP Rate assays with 3+ injections, you must identify the oligomycin injection using the drop-down menu seen on the Add Widget (pictured right) before you can add this widget to your analysis view. Why? The oligomycin injection selection plays a critical role in calculating the correct induced ATP production rates that you will see on the widget. Incorrect selection of the oligomycin injection will result in incorrect calculations and data.
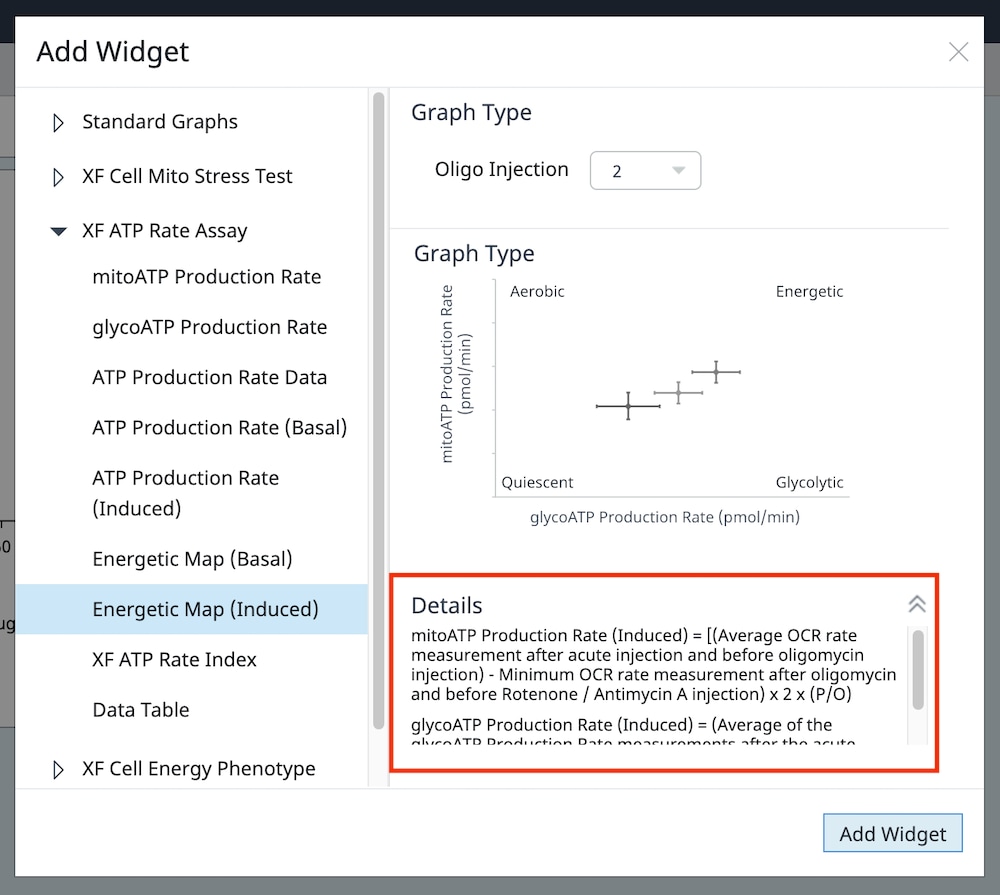
- Add Widget > XF Cell Energy Phenotype Test » XF Cell Energy Phenotype widget: The XF Cell Energy Phenotype data widget is found in the XF Cell Energy Phenotype widget list and is used for analysis of XF Cell Energy Phenotype Test data.
- This is a unique widget compared to the other scatter plot widget options in Seahorse Analytics as it plots 2 data points per group – the baseline phenotype and the stressed phenotype, connected by a dashed line called the metabolic potential – and the y-axis is always OCR and the x-axis is always ECAR (pictured below).
- For more information about the calculations performed in this widget, please see the Add Widget Details display or the XF Cell Energy Phenotype Test Kit User Manual.
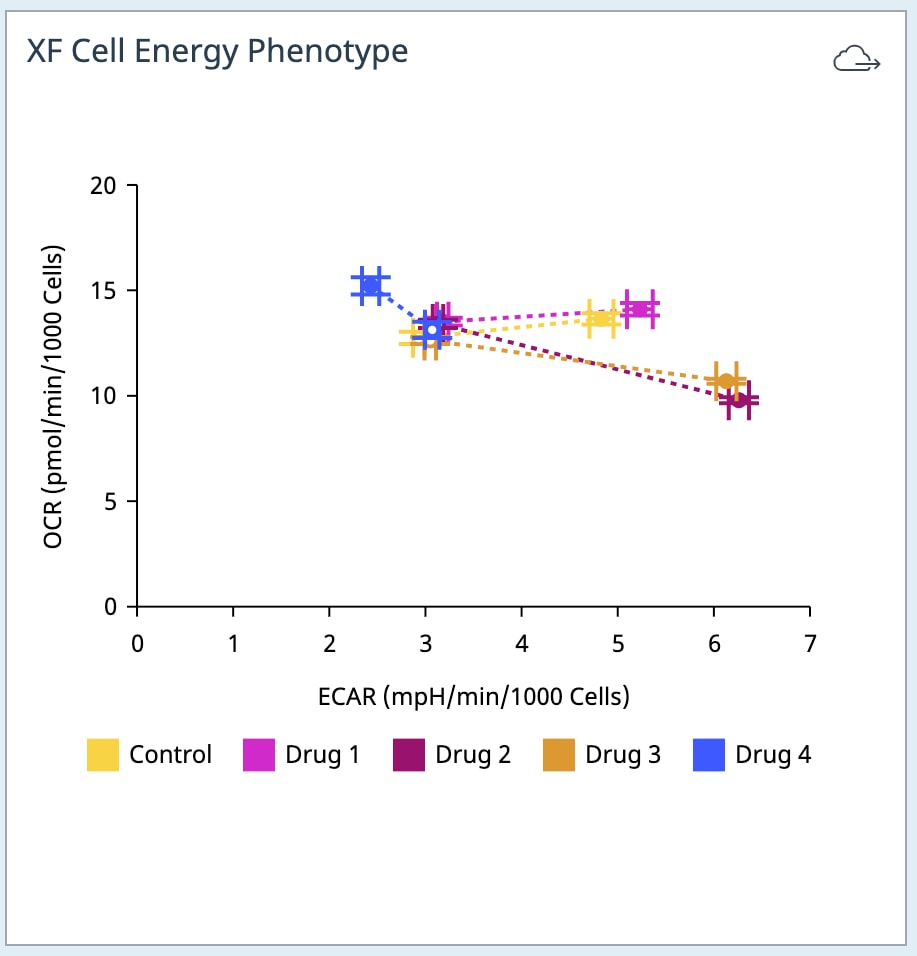
- Widget Types – Other: In addition to kinetic graph, bar chart, and scatter plot widgets, Seahorse Analytics features two additional widgets that are unique to the standard and/or induced XF Real-Time ATP Rate assay workflows. For more information on these two workflows please consult the XF Real-Time ATP Rate Assay User Manual. Please also note that buffer factor must be properly assigned to the assay media, background wells, and assay groups before you can calculate this widget data.
For XF ATP Rate assays with more than 2 injections, you must identify the oligomycin injection using the drop-down menu seen on the Add Widget dialog before you can add the widget to your analysis view. Why? The oligomycin injection selection plays a critical role in calculating the correct ATP production rates reported in the widget. Incorrect selection of the oligomycin injection will result in incorrect calculations and data.- Add Widget > XF ATP Rate Assay » Stacked bar chart: The stacked bar chart widget is currently found in the XF ATP Rate Assay widget list. The ATP Production Rate (Basal) widget creates a stacked bar chart of basal glycoATP production rate (upper blue bar) and basal mitoATP production rate (bottom red bar) for each group (pictured below, left). This widget applies to both the standard and induced assay workflows.
The ATP Production Rate (Induced) widget creates a stacked bar chart of the average of the induced glycoATP production rates (upper blue bar) and the average of the induced mitoATP production rates (bottom red bar) for each group (pictured below, right). This widget applies to the induced assay workflow only.
- Add Widget > XF ATP Rate Assay » Stacked bar chart: The stacked bar chart widget is currently found in the XF ATP Rate Assay widget list. The ATP Production Rate (Basal) widget creates a stacked bar chart of basal glycoATP production rate (upper blue bar) and basal mitoATP production rate (bottom red bar) for each group (pictured below, left). This widget applies to both the standard and induced assay workflows.
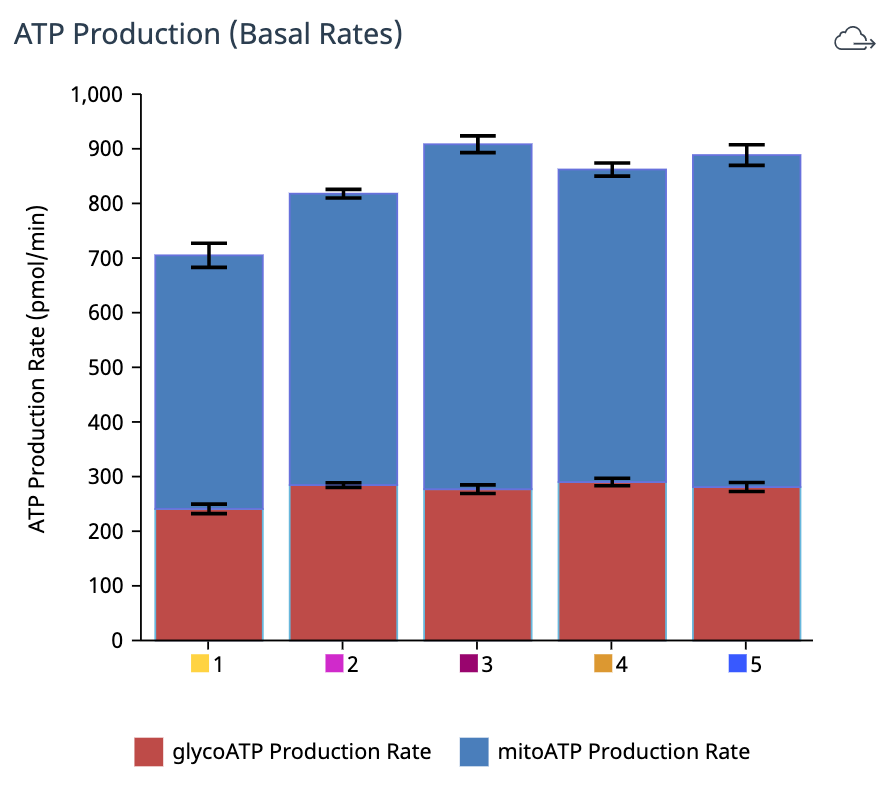
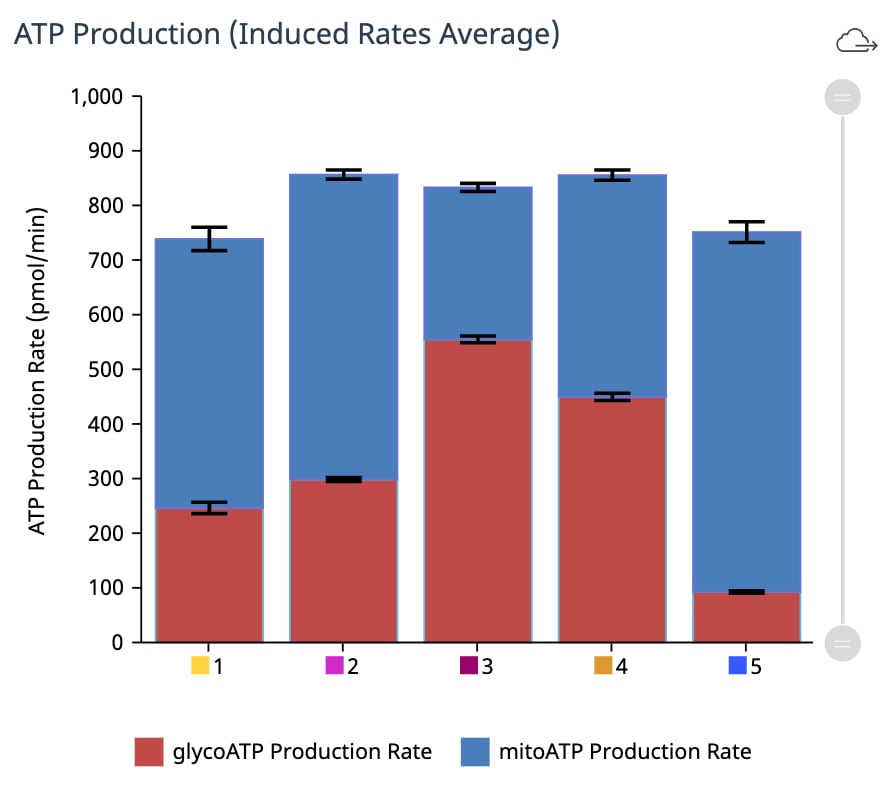
- Add Widget > XF ATP Rate Assay » XF ATP Rate Index: The XF ATP Rate Index is currently found in the XF ATP Rate Assay widget list. The XF ATP Rate Index widget plots the ratio of basal mitoATP production rate to basal glycoATP production rate as an empty circle marker, and plots the ratio of the average of the induced mitoATP production rates to the average of the induced glycoATP production rates for each group as a filled circle marker (only when applied to an induced assay result file – widget pictured below shows data from an induced XF ATP rate assay). Please also note that buffer factor must be properly assigned to the assay media, background wells, and assay groups before you can calculate this widget data.
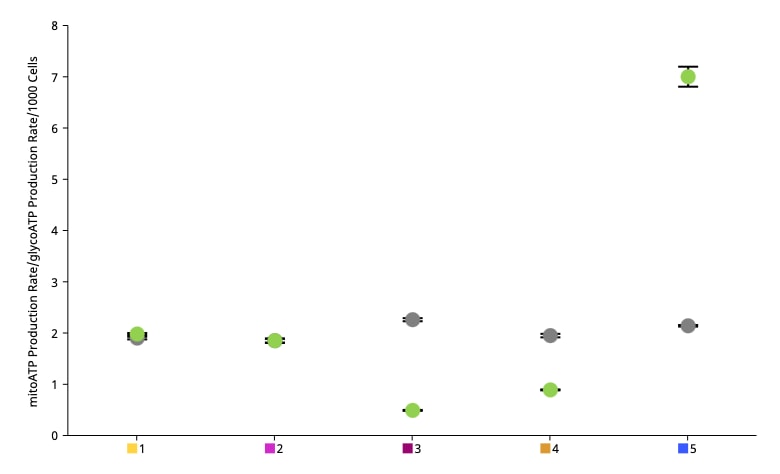
Related Support Material
Reference Material
5.5 Export & Share Data
5.5 Export & Share Data
Export your data to a Microsoft Excel or GraphPad Prism file or share your result data and insight with a collaborator directly using Seahorse Analytics.
Data Export:
There are several ways you can export data from Seahorse Analytics to a Microsoft Excel, GraphPad Prism, or image file.
Export all rate data
You can create an Excel and Prism file containing all rate data for the selected file. This export will not include any parameter calculations (i.e. Spare Respiratory Capacity) that you have calculated in an analysis view, you will need to export that data individually from each widget.
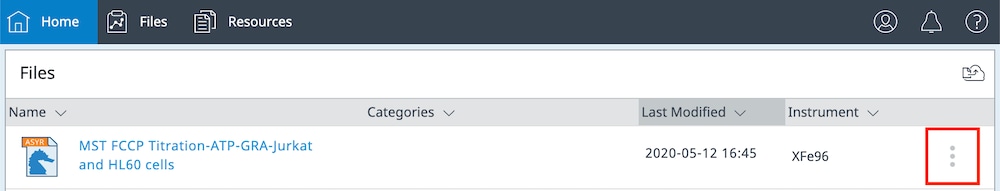
How to export all rate data:
- Go to the Files or Home view.
- Click the 3-dot button seen on the right of the file column to display the menu.
- Click Export to Excel or Export to Prism to create the desired file.
- Use the Export to Excel and Export to Prism options found under the menu for individual files on the Home and Files views (green highlight, pictured right).
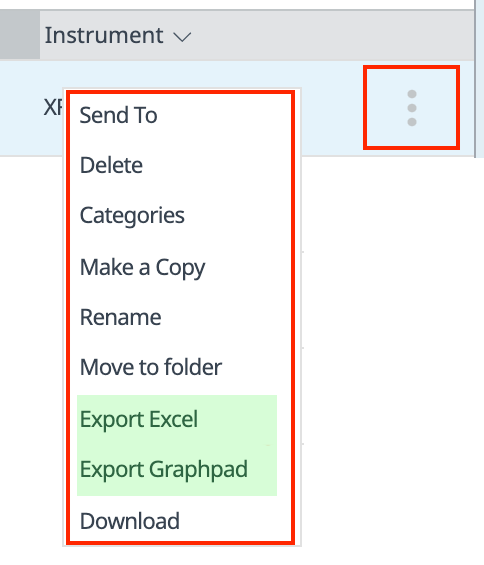
How is this export feature used? This type of data export allows users to easily transfer all rate data (for OCR, ECAR, and PER) data into Prism or Excel to create high-quality or customized figures, perform statistical analysis, and other analytical functions not offered in Seahorse Analytics.
Export select data from individual widgets: You can export individual widget data to an Excel and Prism file containing data for the selected widget. The data in the export file will match exactly how you formatted the widget. For example, if you configure a widget to display basal respiration in well mode, the Prism export file will contain individual well values for basal respiration data for each group. If you configure a widget to display basal respiration in group mode, the Prism export file will show the average group value and error value, not individual well values.
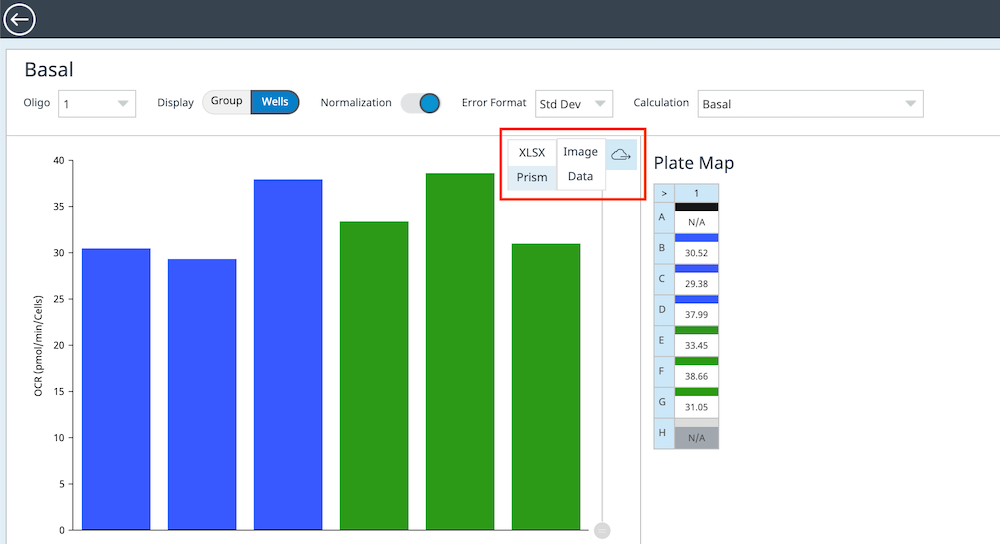
How to export all rate data:
- From any analysis view or widget editor view, look for the small cloud button in the upper-right corner of the widget.
- Move your mouse cursor over the cloud button to display the Image and Data export options.
- Slide your cursor over Image to export your widget as a PNG or JPG file, or Data to export your widget as an Excel or Prism file.
- Data in the export file will exactly match how you formatted your widget. In this example, the Prism export file contains basal respiration values per well for both groups on the plate.
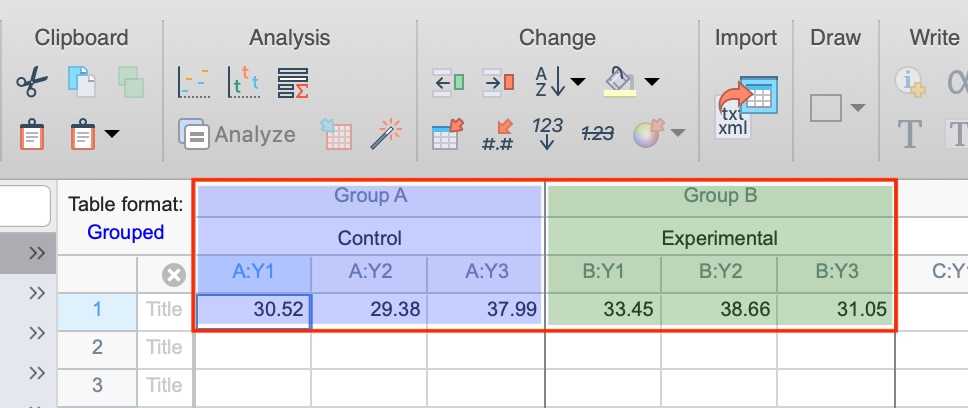
How is this export feature used? This type of data export allows users to easily export select rate or parameter data as an image file, or as a Prism or Excel file. The Prism and Excel export allow you to get exactly the data you want to further analyze (i.e. create high-quality or customized figures, perform statistical analysis, and other analytical functions that are not offered in Seahorse Analytics) rather than exporting all data and trying to find the specific information you need.
File Sharing:
You can share individual assay result files with collaborators or your team using the built-in file share feature. The share feature is found under the small 3-dot menu to the right of each assay result file on the Home and Files views (pictured right).
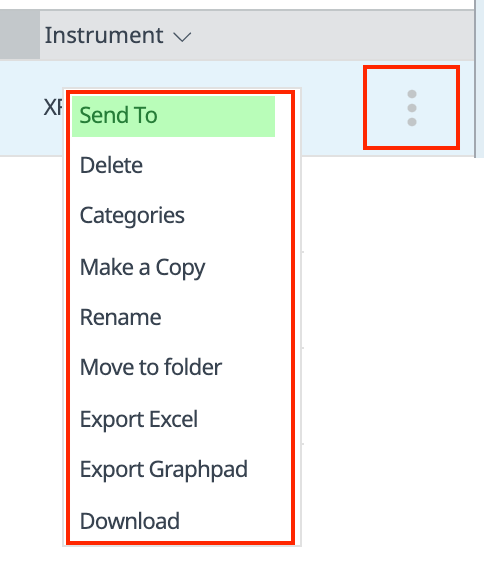
Click Send to to display a dialog, type the recipient’s email address, and click Send to send your data file. If the recipient does not have a Seahorse Analytics account, they must create one to view the data file. If the recipient has an account, they will receive an email notifying them a file was shared with them. They will also see a notification in Seahorse Analytics (bell icon in the upper-right corner) where they will accept (or reject) the shared file.
How is this sharing feature used? The share feature allows you to send an assay result file to someone with, or without, a Seahorse Analytics account directly through the application. The assay result file you choose to share will create a copy of that data file in the recipient’s account, and the widget layout, selection and analysis views will appear exactly how you formatted them prior to the file share. The recipient can make modifications to the shared file, but your copy of the file will remain unchanged.
Export your data to a Microsoft Excel or GraphPad Prism file or share your result data and insight with a collaborator directly using Seahorse Analytics.
Data Export from Analysis View:
- Click Export View.
- Choose your desired export file type.
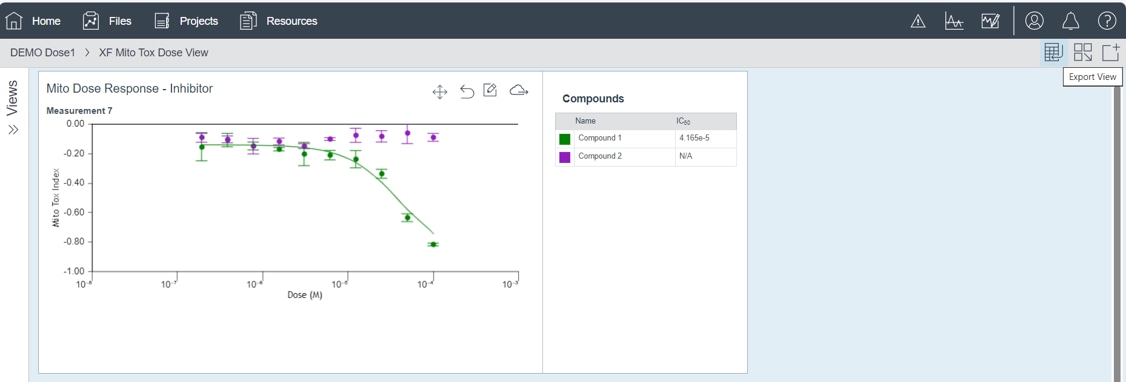
Data Export from Files View:
- Select the desired file(s) using the checkboxes next to the file names.
- Click the Exportbutton.
- Choose your desired export file type.
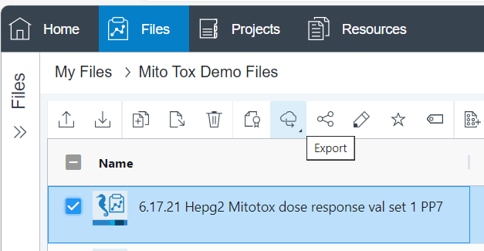
File Sharing from Files View:
- Select the desired file(s) using the checkboxes next to the file names.
- Click the Send To button.
- Enter recipient email address(es) and an optional message before clicking Send.
Note: If the recipient does not have a Seahorse Analytics account, they must create one to view the data file.
Related Support Material
Reference Material
Showing only information for the Seahorse Seahorse XF Pro
Change instrument typeThis section focuses on viewing & analyzing assay result data using Wave Desktop and Report Generator software. To display help content for Seahorse Analytics, click here.
Wave Desktop is the data analysis software for result files generated from any XF, XFe and XFp Analyzer. Transform complex cellular metabolism data into publishable results using Wave Desktop's flexible analysis views, embedded reporting tools, and other powerful analytical capabilities.
XF Report Generators are Microsoft Excel macro files that automatically calculate the parameters of each Seahorse XF Assay Kit and present result data in a one-page, customizable Summary Report.
Select a topic below to learn more:
5.1 PC Specs & Compatibility
Wave Desktop is the assay design & data analysis software for all Seahorse Analyzers and supports:
- Analysis of data files from all Seahorse Analyzers (XFe96, XFe24, XFp, XF96 and XF24).
- Create and customize assay templates for XFe96, XFe24 & XFp Analyzers.
- Export data to (1) Microsoft Excel, (2) GraphPad Prism, or (3) XF Report Generators.
- Supports Microsoft Excel (32 & 64-bit) for both Windows and Macintosh PCs.
It is always encouraged to update to the latest version of Wave Desktop software. The latest release of Wave Desktop software is version 2.6.1 (April 2019). Wave Desktop software can be installed on any PC with Windows 7 Operating Systems or later.
Below you will find the PC specs and compatibility detail for Wave Desktop 2.6 software:
| Computer | Specifications |
|---|---|
| Windows PC | Operating System: Windows 7, 8.1, and 10 |
| Processor: Intel Core i3 (or better) | |
| Hard Disk Space: 175 GB | |
| System Memory (RAM): 4 GB (minimum*) | |
| Screen Resolution: 1280 x 800 (minimum) | |
| Supported Excel Versions: 2010, 2013 & 2016 | |
| Macintosh PC (requires use of a virtual machine) | Operating System: Mac OSx 10.11 or higher |
| Virtual Machine: Parallels 12 & Windows 7, 8.1 and 10 | |
| Processor: Intel Core i3 (or better) | |
| Hard Disk Space: 175 GB | |
| System Memory (RAM): 4 GB (minimum*) | |
| Screen Resolution: 1280 x 800 (minimum) | |
| Supported Excel Versions: 2011 & 2016 |
* For the optimal software experience, 8 GB (or higher) System Memory (RAM) is recommended.
Related Support Material
Reference Material
5.2 Types of Data
Cellular oxygen consumption (respiration) and proton excretion (glycolysis) cause rapid, easily measurable changes to the concentrations of dissolved oxygen and free protons. Agilent Seahorse XF Analyzers measure concentrations of dissolved oxygen and free protons in real-time by isolating an extremely small volume (about 2 μL) of medium above a monolayer of cells within a microplate then calculate the OCR and ECAR, respectively.
Using Wave Desktop software, you can easily access & review these data:
Rate Data is the primary output of the XF analyzer.
Oxygen Consumption Rate (OCR): A quantitative measurement of oxygen consumption in the well, an indicator of mitochondrial respiration, reported in picomole/minute (pmol/min) vs. time.
Oxygen Consumption Rate (OCR) data displayed in Rate mode (right)
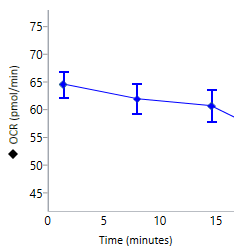
Extracellular Acidification Rate (ECAR): A qualitative measurement of proton extrusion in the extracellular medium, reported as milli-pH/minute (mpH/min) vs. time.
Extracellular Acidification Rate (ECAR) data displayed in Rate mode (right)
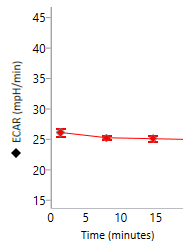
Proton Efflux Rate (PER): A quantitative measure of extracellular acidification that accounts for media buffering capacity and plate geometry. Reported in picomole/minute (pmol/min) vs. time. Only available in post-run assay results, not during assay runtime.
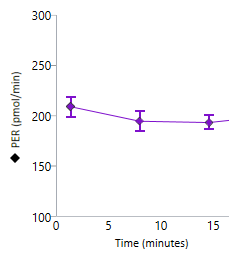
See chapter 3 in the Wave User Guide for more information about the types of data available in Wave software.
Level Data is used to calculate rate data and can also be used for diagnostic purposes.
Oxygen Concentration (mmHg): As cells (or other biological material) consumes oxygen during a measurement, oxygen tension will decrease. This decrease in oxygen tension is used to calculate the rate of oxygen consumption (OCR). You can view oxygen tension level data on the Overview analysis view using the Y1 drop-down menu.
Oxygen tension (O2) data displayed as mmHg vs. time in Level mode (right)
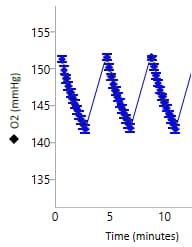
Proton Concentration (mpH): As cells (or other biological material) generate protons during a measurement, proton concentration will increase. The concentration of free protons in the microchamber is measured throughout an XF assay and calculated as the rate of extracellular acidification (ECAR). You can view mpH level data on the Overview analysis view using the Y1 drop-down menu.
Proton Concentration (mpH) data displayed in Level mode (right)
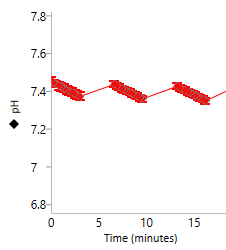
Related Support Material
- White Paper: Improving quantification of cellular glycolytic rate using Seahorse XF technology
- Quick Reference Guide - Calculating Proton Efflux Rate (PER) Data
- Agilent Seahorse XF Real Time ATP Rate Assay Templates
- How to analyze Agilent XF Real-Time ATP Rate Assay result data
- Technical Overview: Characterizing Your Cells - Using OCR Values to Determine Optimal Seeding Density
Reference Material
5.3 Data Display Options
Wave provides a standard set of graphing options to view & interpret assay result data. Depending on the type of analysis view selected, Wave automatically calculates and graphs result data as one of the following:
Kinetic Graph
A Kinetic Graph is the most common way to display rate data from XF Analyzers. A kinetic graph displays the rate on the y-axis, and time on the x-axis. During an assay, data is acquired and plotted in real-time as a kinetic graph. Kinetic graphs can be found in the Quick View and Overview analysis views in Wave software.
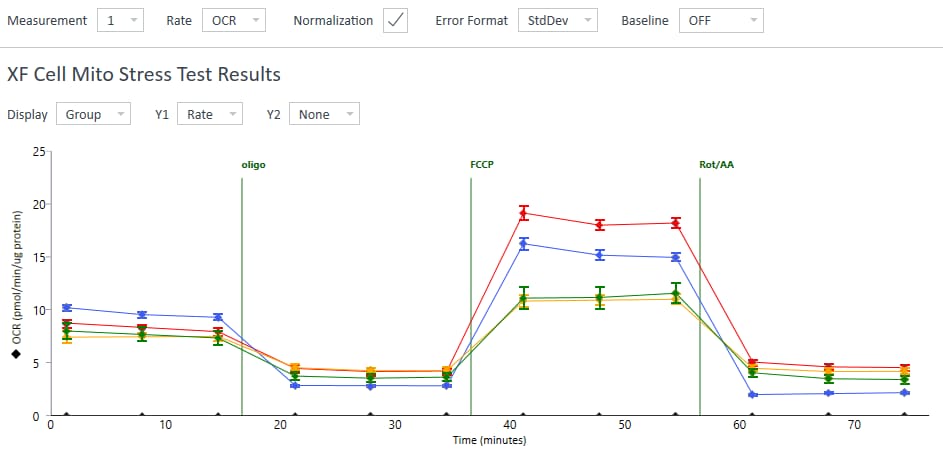
Energy Map
Another common way to graph XF result data is an Energy Map (scatter plot), where Oxygen Consumption Rate (OCR) is always plotted on the y-axis, and acidification data (ECAR or PER) is always plotted on the x-axis. Use the Measurement drop-down menu to select a rate measurement to display on the energy map for each group. Use the Rate drop-down menu to change the x-axis rate to PER. The energy map graph option can be found in the Quick View and OCR vs. ECAR analysis views.
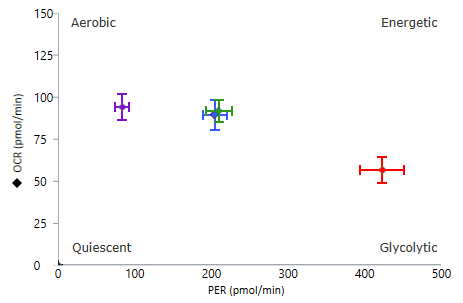
Plate Map
The Plate Map displays rate data for the selected rate measurement of each assay well. Plate Maps are always displayed in the upper right corner of Wave while running an assay, and on the Quick View, Overview, and OCR vs. ECAR analysis views. The Quick View has a button to display the Plate Map, which is hidden by default.
The Plate Map in the Quick View and OCR vs. ECAR analysis views displays two rates: Oxygen Consumption Rate (OCR - top) and acidification data (either ECAR or PER - bottom). The Plate Map on the Overview analysis view displays 1 rate - OCR, ECAR, or PER.
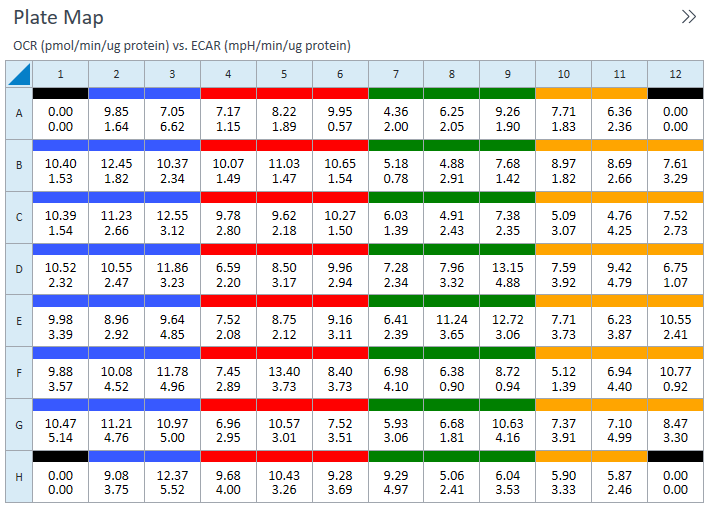
When opening a new analysis view, the Plate Map shows data for rate measurement 1 by default. Use the Rate drop-down menu to display data for another rate measurement during the assay.
Bar Graph
The Bar Graph is available on the Overview analysis view only (below the Plate Map), and displays the average rate for each group for the selected measurement. Use the Display drop-down menu to change the rate display from Group (average) to Well (individual well) mode.
The Bar Graph can be used for identifying outliers, optimal FCCP concentration, optimal cell seeding density, or other trends that may not be apparent when measurement data is plotted as a kinetic graph or scatter plot.
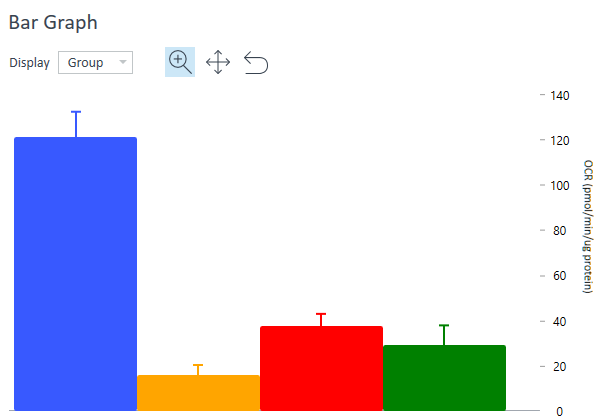
Group List
The Group List is the legend for the data plotted in the kinetic graph or scatter plot.
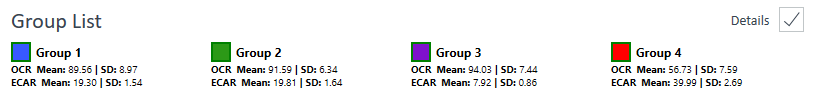
Use the Group List to:
- Hide or show groups from the graphed data by double-clicking the group name.
- Check the Details box in the upper-right corner of the Group List to display group statistics. Statistics are displayed as average and error for the selected rate measurement. Select a different rate measurement to display group statistics for that rate.
- Assay wells that have been turned OFF on the Plate Map are not included in the calculated group statistics.
- When a group is hidden, the mean and standard deviation of the group will be: Mean: 0.00; Standard Deviation: 0:00.
See chapter 3 in the Wave User Guide for more information about the types of data available in Wave software.
Related Support Material
Reference Material
5.4 Analysis Views
There are 4 customizable analysis views that can be added to an assay result file in Wave Desktop. Each analysis view can be added to an assay result file multiple times using the Add View button in the top-level ribbon menu.
Quick View
Quick View is the default analysis view displayed when opening a new assay result file. Quick View simultaneously displays a kinetic graph of OCR vs time, ECAR vs time, and an energy map of OCR vs. ECAR.
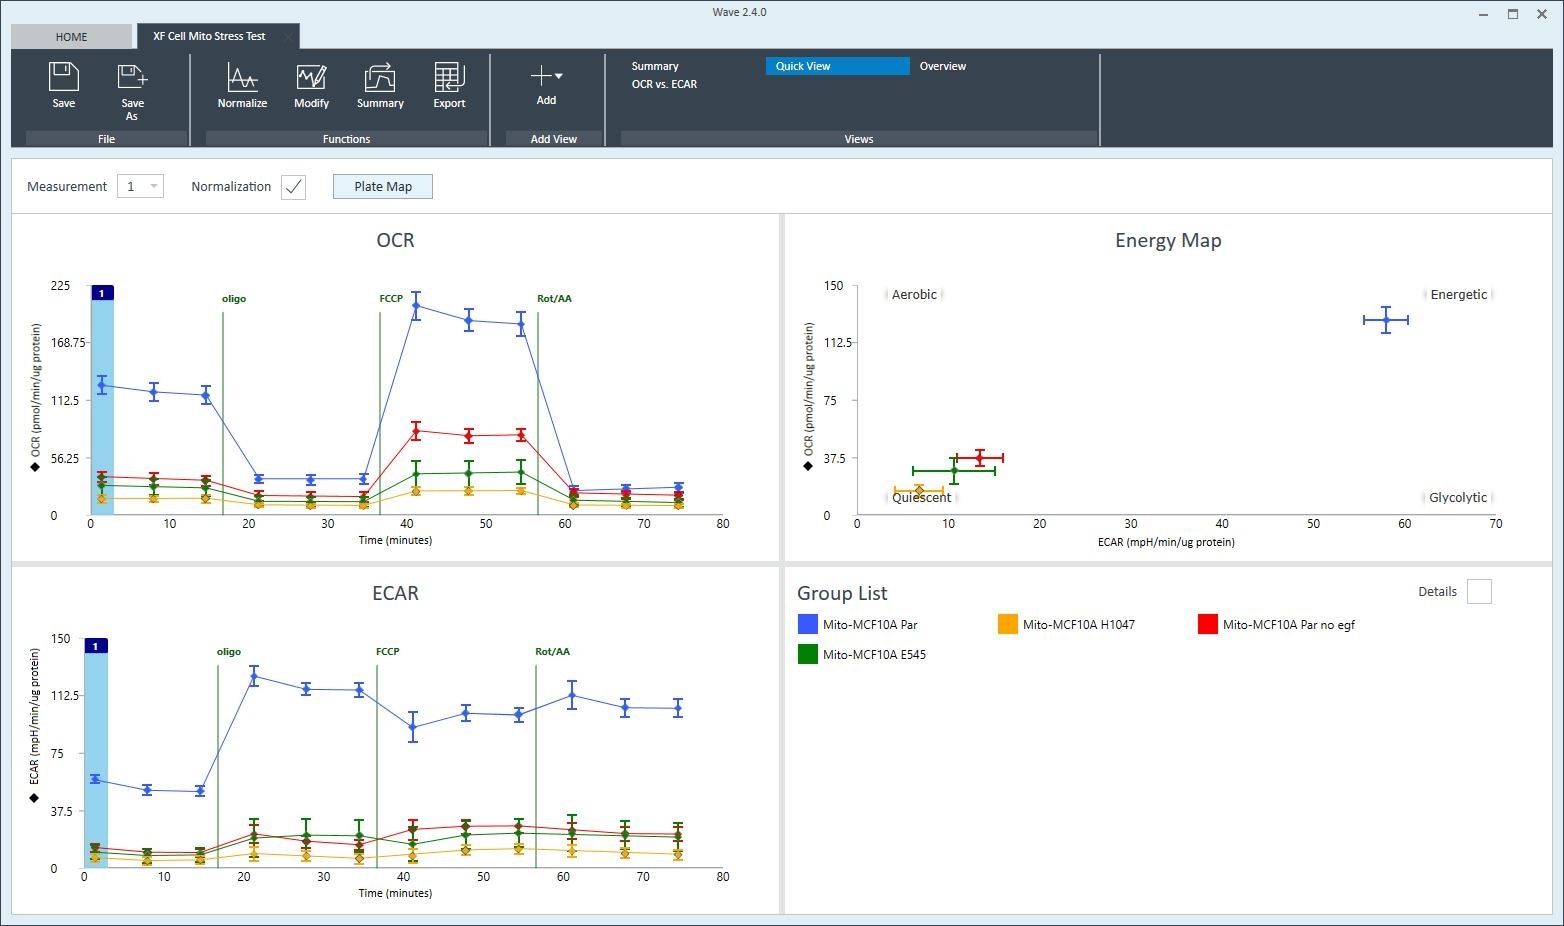
Overview
Overview displays a kinetic graph of rate (OCR, ECAR, PER, or PPR) versus time. The selected rate is displayed on the y-axis, and time is displayed on the x-axis. Group statistics (average rate and error) for each measurement can be displayed by checking the Details box in the Group List below the kinetic graph. Overview is the most versatile analysis view in Wave software for routine analysis functions. To display Overview, click Add View and select Overview from the list of views.
Tip: Add multiple Overview analysis views by repeating the process of Add View > Overview. This gives greater flexibility for tailoring your result data presentation to show specific groups, responses, or comparisons between groups.
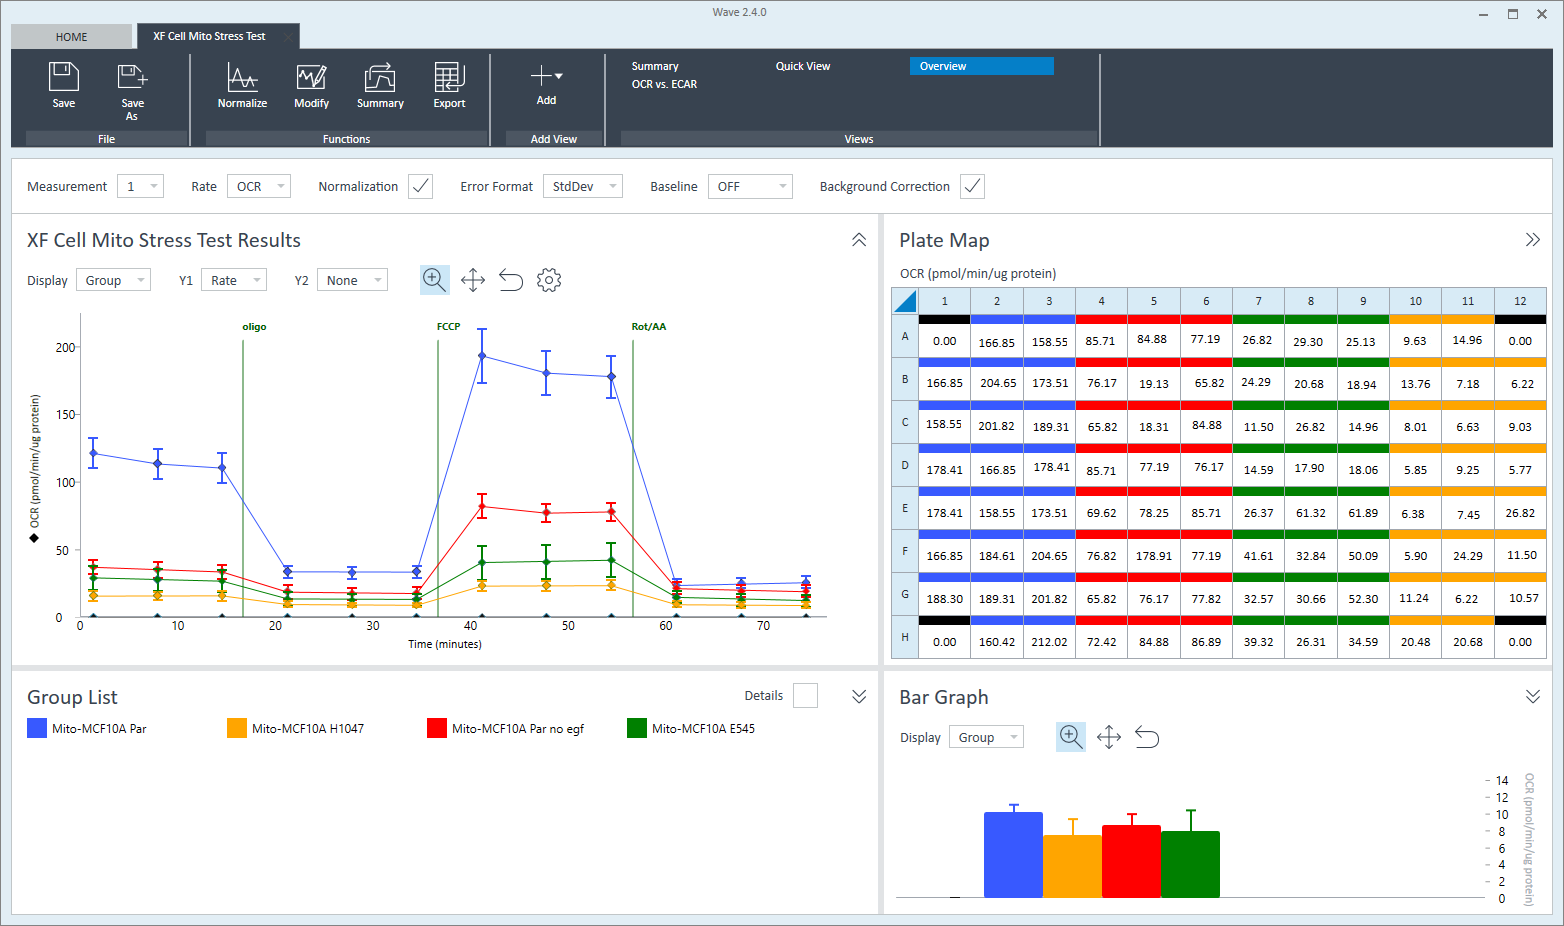
OCR vs. ECAR
The OCR vs. ECAR view displays an energy map with the OCR on the y-axis and (by default) ECAR on the x-axis. Use the Rate drop-down menu to change the rate displayed on the x-axis to either PER or PPR. OCR is always displayed on the y-axis, and cannot be changed. To display OCR vs. ECAR, click Add View and select OCR vs. ECAR from the list of views.
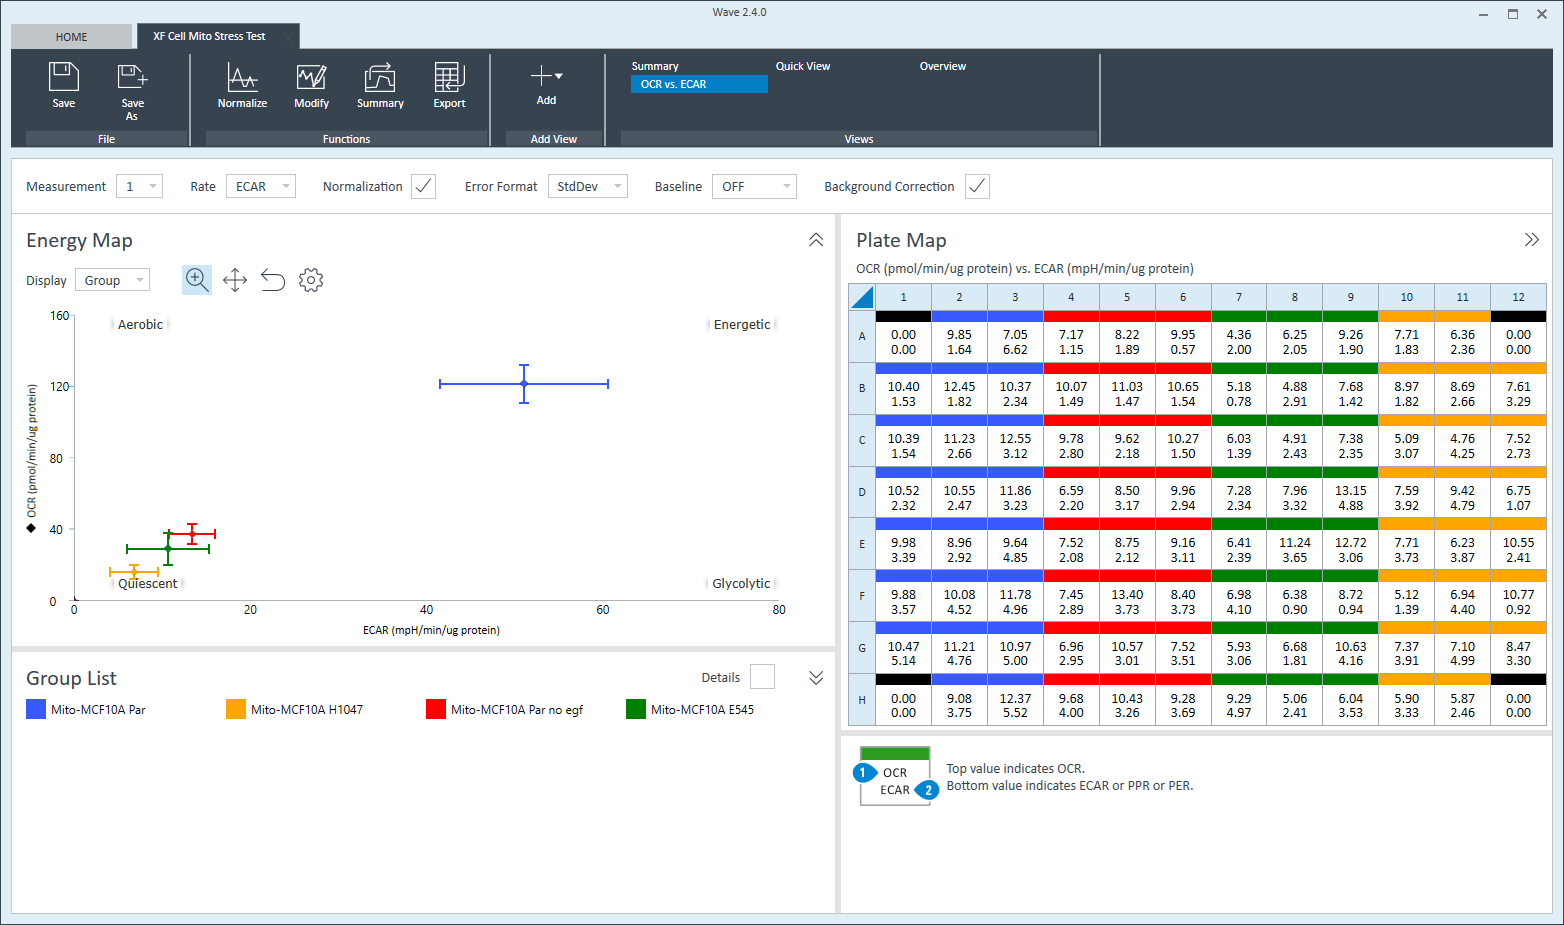
Data
The Data view contains all data associated with the assay result file organized into 7 tabs:
- Group Data: Average rate data (OCR, ECAR, PER, or PPR) and error for each group, ordered by measurement number.
- Rate: Individual well rate data (OCR, ECAR, PER or PPR) ordered by measurement number. Error values are not displayed.
- Level Data: Individual well level data (O2 and pH) ordered by measurement number.
- Raw: Raw measurement data, including O2 and pH light emission values, reference values, well and environment temperature recorded each measurement. This tab is most-commonly used by Tech Support, not for routine data analysis.
- Calibration: O2 and pH calibration results organized by well.
- Calibration View: O2 and pH calibration results for each assay well displayed as a plate map.
- Event Log: Assay information such as analyzer serial number, software version, plate & barcode lot numbers, and other settings during the assay. Also provided is a sortable table of protocol commands used during the XF assay, including command name, timing, and outcome.
To display the Data view, click Add View and select Data from the list of views. The Group Data tab is displayed by default when opening the Data view.
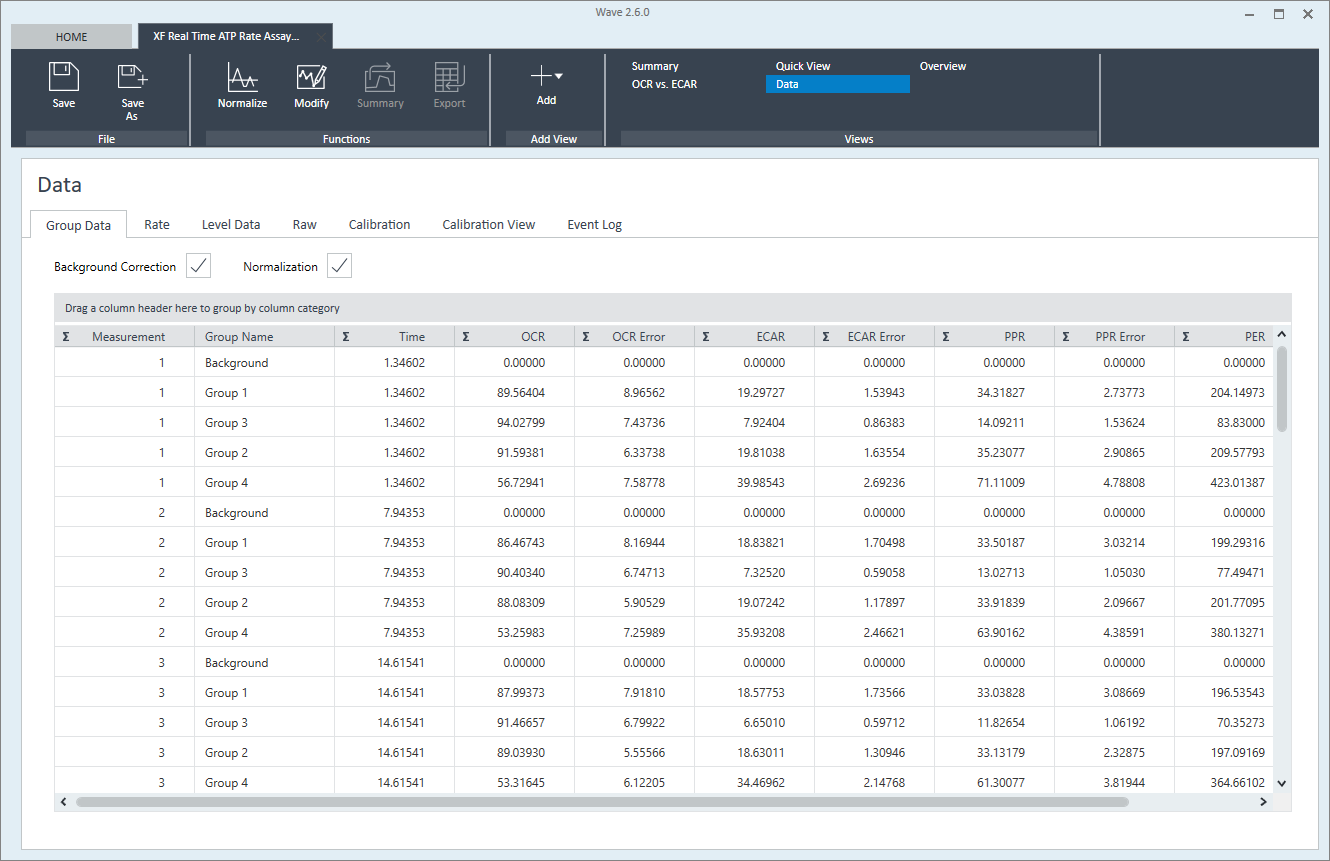
See Chapter 3 in the Wave User Guide for more detailed information about each analysis view, including recalculating data as a % of baseline, normalize rate data to a biological parameter (i.e. cell number), flag assay wells on the plate map, and other key analysis functions & features.
Related Support Material
- Wave Desktop 2.6 Release Notes
- Quick Reference Guide - Calculating Proton Efflux Rate (PER) Data
- XF Imaging and Normalization System
- Agilent Seahorse XF Real Time ATP Rate Assay Templates
- How to analyze Agilent XF Real-Time ATP Rate Assay result data
- Technical Overview: Characterizing Your Cells - Using OCR Values to Determine Optimal Seeding Density
Reference Material
5.5 XF Report Generators
Agilent Seahorse XF Report Generators are Microsoft Excel macro files that automatically calculate the parameters of each Seahorse XF Assay Kit and present result data in a one-page, customizable Summary Report.
Wave provides a one-click direct export of result data to the XF Report Generators, any modifications to your result data in Wave, such as excluded assay wells or normalized rate data, will be incorporated in the exported & analyzed Report Generator Excel file. Click the Export button in the top-level ribbon menu to display the list of available XF Report Generator export options.
Why use XF Report Generators?
- More efficient & consistent data analysis - transform raw kinetic data into interpretable results and eliminate repetitive manual calculations and data reduction.
- Summarize XF result data in seconds - data is presented as an organized, customizable easy to understand report.
- Scalable to meet your analysis needs - import and analyze up to 5 replicate result files at once using the Multi-File XF Report Generators.
- Simpler collaboration - review and reanalyze result data in the Report Generators without any special software programs or licenses.
- Supports analysis of:
- Data files generated on Seahorse XFe, XF and XFp Analyzers.
- Microsoft Excel 2010, 2013, and 2016 on Windows PCs.
- Excel for Mac 2011 and 2016 for Apple computers.
| XF Report Generators - Download pages | Single-File Analysis | Multi-File Analysis |
|---|---|---|
| Single-File User Guide | Multi-File User Guide | |
| Seahorse XF Cell Mito Stress Test | Single-File User Guide | Multi-File User Guide |
| Seahorse XF Real-Time ATP Rate Assay | Single-File User Guide | Not Available |
| Seahorse XF Glycolytic Rate Assay | Single-File User Guide | Multi-File User Guide |
| Seahorse XF Mito Fuel Flex Test | Single-File User Guide | Not Available |
| Single-File User Guide | Not Available |
Related Support Material
Reference Material
Showing only information for the Seahorse Seahorse XF Pro
Change instrument type5. Analyze XF Assay Results
Agilent Seahorse Analytics is the go-to data analysis software for your Seahorse Analyzer, enabling you to easily import, analyze, report, and share your results with your team or collaborators.
Upload assay results file
- Click the File Upload button to display the file upload dialog.
- Click the Choose a file text to browse to your data file, or if you have file explorer open to your data files, you can drag & drop a file into this region.
- Click Import
Assay Kit Companion Analysis View » XF Real-Time ATP Rate Assay:
- On the Add View window, click the Assay Kit Companion View list to expand the list of options.
- Click the XF ATP Rate Assay analysis view to display assay parameter widgets.
- Select the desired parameter widgets and groups. Then click Add View
Types of Data
Cellular oxygen consumption (respiration) and proton excretion (glycolysis) cause rapid, easily measurable changes to the concentrations of extracellular oxygen and protons. Agilent Seahorse XF Analyzers measure changes in concentration of extracellular oxygen and protons in real-time. Using Seahorse Analytics, you can easily access and review the following types of data:
1. Rate Data is the primary output of all Seahorse XF analyzers. The three types of rate data calculated and reported in Seahorse Analytics are:
Oxygen Consumption Rate (OCR): A quantitative measurement of oxygen consumption by the sample in the well, and thus a measure of cellular and mitochondrial respiration over time. Reported in units of picomole/minute (pmol/min) vs. time.
Extracellular Acidification Rate (ECAR): A measurement of pH changes in the extracellular medium over time, serving as a qualitative reflection of glycolysis. CO2 produced as a byproduct of mitochondrial respiration can also contribute to acidification. Reported as milli-pH/minute (mpH/min) vs. time.
Proton Efflux Rate (PER): A quantitative measure of extracellular acidification that accounts for media buffering capacity and plate geometry. Reported in picomole/minute (pmol/min) vs. time. Only available in post-run assay result analysis.
2. Level Data is used to calculate rate data and is used for data quality assessment. You can display oxygen tension level or pH level data on the kinetic graph widget-editor view by toggling the Y axis to Level.
Using un-coated cell plates, the starting recommended oxygen tension (O2) level data is:
- Background and Assay Wells: 152 ± 10 (mmHg) at 37 °C
- Oxygen tension at the end of a measurement cycle should not go below 40 mmHg
- Oxygen tension at the beginning of the next measurement cycle should be similar to the starting oxygen tension of the previous measurement(s).
Using un-coated cell plates, and the Agilent Seahorse XF DMEM or XF RPMI medium, pH 7.4, the starting recommended proton concentration (pH) level data range is
- Background and Assay Wells: 7.4 ± 0.1 [pH] at 37 °C
- The pH value at the end of a measurement cycle should not go below pH 6.4
- The pH value at the beginning of the next measurement cycle should be equivalent to the starting pH value of the previous measurement(s).
These values are general recommendations and can differ based on assay, plate type or sample. Note, Seahorse Analytics features data quality testing which includes verification of appropriate Level Data.
Data Analysis: Optimal seeding density
Identification of the optimal seeding density is paramount for successful Seahorse XF assays. First, identify seeding densities resulting in 75-90% confluence in an evenly distributed monolayer. Ensure cells are not overconfluent or clumping. Next, evaluate basal OCR measurements to identify densities resulting in 50-400 pmol/min. If multiple densities meet both criteria, use basal ECAR to choose the optimal cell seeding density resulting in 20-120 mpH/min. These recommended basal ranges allow for reliable detection of changes after compound addition.
Related Support Material
Characterizing Your Cells: Using confluence and OCR values to determine optimal seeding densityData Analysis: ATP Rate Assay results
Results from the XF ATP Rate Assay include quantification of ATP production from glycolytic vs oxidative energy production pathways. This provides insight on cellular ATP demand as well as the energy mechanisms driving cell behavior and function. Other assays of interest may include mito stress tests, glycolytic rate assays, substrate utilization assays, mitochondrial toxicity testing or electron flow assays.
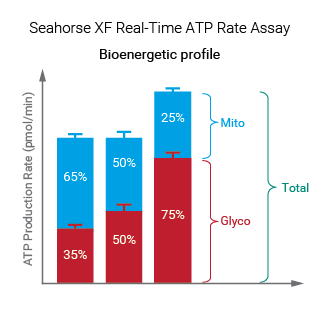
Related Support Material
Agilent Seahorse XF Assay Kits and Reagents Flyer6 Beyond the Basics
This section of the XF Learning Center will provide an introduction to various topics on using XF Analyzers, including a range XF assay kits and applications, alternative assay conditions and sample types, as well as normalization and analysis of XF data.
6.1 XF Assays and Applications
Agilent XF Assay Kits and reagents are developed specifically for use with each XF Analyzer to ensure reliability and consistency of results. Seahorse XF kits and reagents help simplify running an XF assay by providing pre-calibrated, pre-tested reagents for measuring valuable functional metabolic parameters including cellular ATP production rates, mitochondrial function, glycolytic activity and substrate oxidation in living cells, permeabilized cells and isolated mitochondria.
The materials below provide information and methods for performing a wide range XF Assays.
Cellular ATP Production
Mitochondrial Function
Mitochondrial Substrate Oxidation
- XF Substrate Oxidation Stress Test Kits
- XF Palmitate Oxidation Stress Test Kit and FAO Substrate
- Application Note: Revealing Cellular Metabolic Phenotype and Function Using Agilent Seahorse XF Substrate Oxidation Stress Tests
- Webinar: Revealing Cellular Metabolic Phenotype and Function Using Agilent Seahorse XF Substrate Oxidation Stress Tests
Glycolytic Function
6.2 Normalization of XF Data
Whether comparing different cell types, genetic modifications or compound treatments, normalization of functional biological data is a key component in the workflow for performing XF assays and/or subsequent analysis and interpretation of XF data. Normalization of XF assays can be applied on several levels, including cell number, genomic DNA, and total cellular protein.
- Overview: XF Adherent Cell Data Normalization Overview
- Tech Guide: Seahorse XF Adherent Cell Imaging and Normalization System - XFe24 Hoechst33342 Staining Optimization Guidelines.
- Tech Note: Data Quality Management using Brightfield Images with the Seahorse XF Imaging and Normalization System
6.3 3D Models
The Seahorse XF Flex analyzer and consumables are designed to work with a variety of 3D sample types, including organoids, tissue slice punches, islets, embryos, and more. The range of Seahorse XF Flex analyzer consumables support investigation across a wide variety of samples, offering multifaceted, physiologically relevant approaches to studying cellular metabolism.
- A Superior System for Real-Time Metabolic Analysis with Brain Tissue and Other 3D Models
- Measuring Mitochondrial Function of Matrix-Embedded Organoids Using the Agilent Seahorse XF Flex Analyzer
- Improving Real-Time Metabolic Analysis in Islets and Spheroids Using the Agilent Seahorse XF Flex 3D Capture Microplate-S
- Metabolic Profiling Cancer Organoids Cultured in the Agilent Seahorse XF Flex Organoid Microplate
- User Guide: Agilent Seahorse XF 3D Mito Stress Test Assay User Guide
6.4 Permeabilized Cells and Isolated Mitochondria
The study of mitochondrial function is central to both clinical and basic scientific research. Mitochondrial respiration measurements using intact cells can help define metabolism and its dysregulation in fields such as cancer, immunology and mitochondrial toxicology.
Using intact cells in combination with Agilent Seahorse XF assays can provide an overall cellular and mitochondrial bioenergetic profile. However, because changes in mitochondrial function may correlate to altered mitochondrial substrate oxidation, examining the oxidation of specific substrates is one approach to determine the mechanism underlying differences observed in mitochondrial activity using intact cells.
The XF Plasma Membrane Permeabilizer (XF PMP) allows for experimental control over specific substrates provision to the mitochondria by providing safe and consistent permeabilization of the plasma membrane in situ and eliminating the need for isolation of mitochondria from cultured cells or use of detergents (digitonin) for cell permeabilization. i. This allows for assessment of multiple mitochondrial substrate oxidation pathways in a single experiment, providing direct functional measurement of CI-, CII-, and CIV-linked respiration.
By combining XF PMP, substrates and inhibitors, the XF Electron Flow assay yields a powerful approach to understanding mitochondrial function when testing effects of interventions (genetic manipulations/compound treatments) on mitochondria. Thus, in cases where a relevant cell model is available, including established cell lines and primary cells, the permeabilization of the plasma membrane in situ via XF PMP is highly preferable to isolation of mitochondria from cultured cells, outlined in the table below.
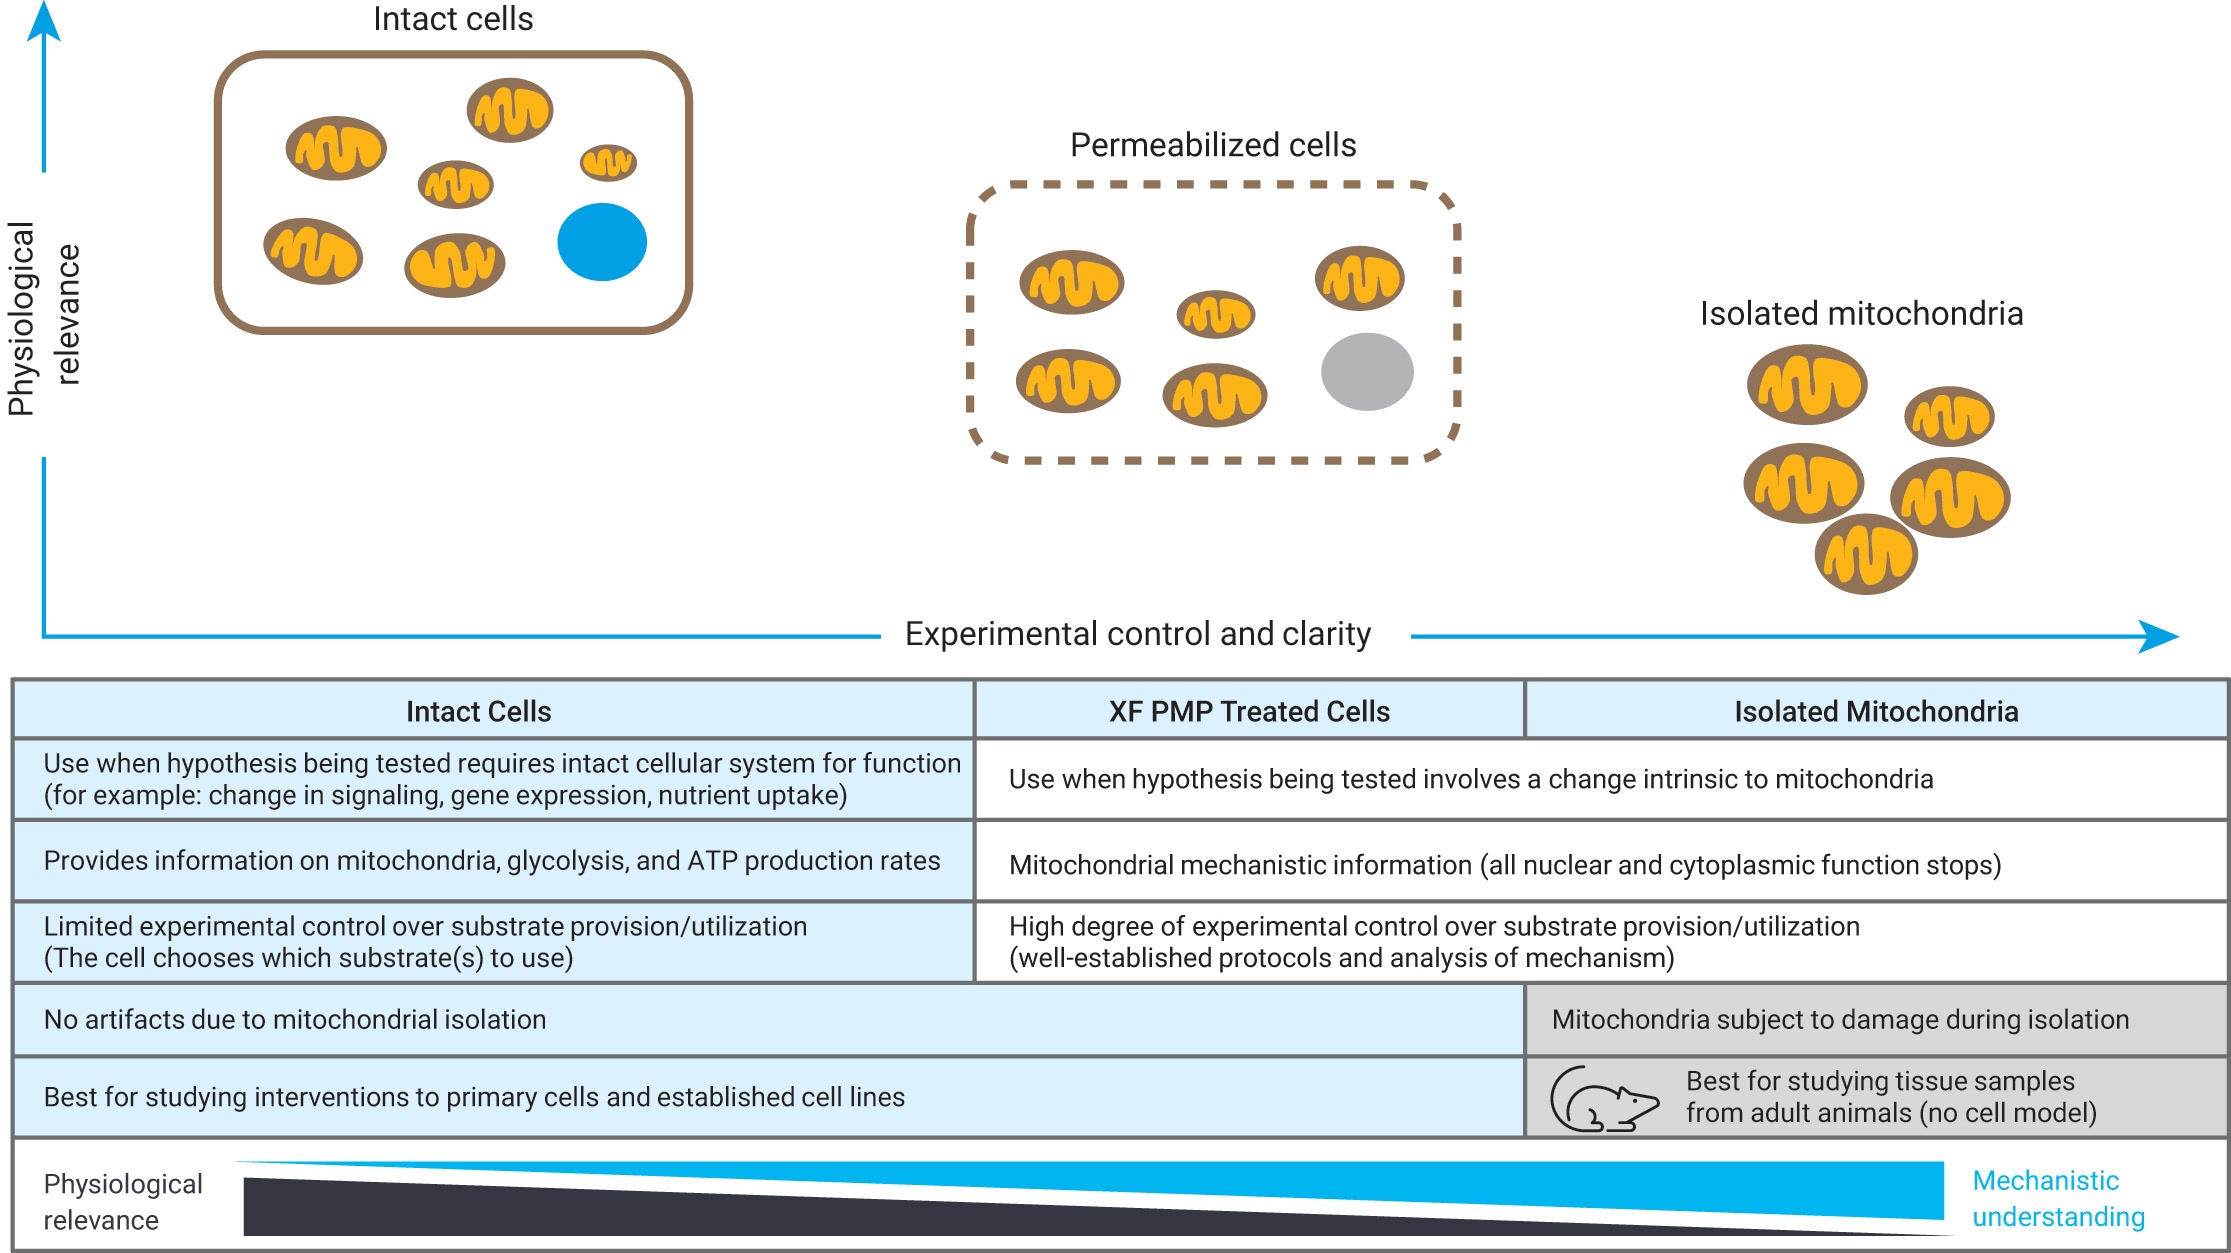
The content below explains how changes in mitochondrial function due to compound treatments and/or genetic interventions can be investigated by permeabilizing cells using XF PMP and the XF Electron Flow Assay.
Permeabilized Cells
- Plasma Membrane Permeabilizer, Membrane Permeabilizer | Agilent
- Publication: Measuring Mitochondrial Function in Permeabilized Cells Using the Seahorse XF Analyzer or a Clark-Type Oxygen Electrode (Divakaruni, et al, Curr Protoc Toxicol, 2014)
- Publication: Thiazolidinediones are acute, specific inhibitors of the mitochondrial pyruvate carrier (Divakaruni, et al, PNAS, 2013)
Isolated Mitochondria
- Application Note: Analyzing Microgram Quantities of Isolated Mitochondria in the Agilent Seahorse XFe/XF96 Analyzer
- Publication: High Throughput Microplate Respiratory Measurements Using Minimal Quantities Of Isolated Mitochondria (Rogers, et al, PLoS One, 2011)
- Publication: Preparation and Respirometric Assessment of Mitochondria Isolated from Skeletal Muscle Tissue Obtained by Percutaneous Needle Biopsy (Bharadwaj et al, JOVE, 2015)
- Publication: Isolation of Mitochondria from Minimal Quantities of Mouse Skeletal Muscle for High Throughput Microplate Respiratory Measurements (Boutagyet al, JOVE, 2015)
- Publication: Using Isolated Mitochondria from Minimal Quantities of Mouse Skeletal Muscle for High throughput Microplate Respiratory Measurements (Boutagy, et al, JOVE, 2015)
6.5 Hypoxia and High Respiring Cells
Analyzers have the capability of measuring metabolism in reduced oxygen environments (hypoxia), as well as with high respiring cell types, including differentiated adipocytes.
Hypoxia
6. Beyond the Basics
Select a topic below to learn more:
6.2 Fatty Acid Oxidation Assays
6.3 Permeabilized Cells & Iso Mitos
6.3 Permeabilized Cells & Iso Mitos
6.1 XF Assays and Applications
Agilent XF Assay Kits and reagents are developed specifically for use with each XF Analyzer to ensure reliability and consistency of results. Seahorse XF kits and reagents help simplify running an XF assay by providing pre-calibrated, pre-tested reagents for measuring valuable functional metabolic parameters including cellular ATP production rates, mitochondrial function, glycolytic activity and substrate oxidation in living cells, permeabilized cells and isolated mitochondria.
Note: All XFp assay kits and consumables are compatible with the XF HS Mini Analyzer.
The materials below provide information and methods for performing a wide range XF Assays.
Cellular ATP Production
Mitochondrial Function
- Kit Info: XF Cell Mito Stress Test Kit
- Kit Info: XF Cell Mito Stress Test Kit
- Publication: Analysis and Interpretation of Microplate-Based Oxygen Consumption and pH Data (Divakaruni, et al, Methods in Enzymology, 2014)
- Publication: Assessing bioenergetic function in response to oxidative stress by metabolic profiling (Dranka, et al, Free Radic Biol Med, 2011)
Mitochondrial Substrate Oxidation
- Overview: XF Substrate Oxidation Stress Tests
- Kit Info: Seahorse XF Substrate Oxidation Stress Test Kits
- Kit Info: Seahorse XF Palmitate Oxidation Stress Test Kit and FAO Substrate
- Application Note: Revealing Cellular Metabolic Phenotype and Function Using Agilent Seahorse XF Substrate Oxidation Stress Tests
- Webinar: Revealing Cellular Metabolic Phenotype and Function Using Agilent Seahorse XF Substrate Oxidation Stress Tests
Glycolytic Function
Immune Cell Activation Assays
Immune Cell Assays
- Kit info: Agilent Seahorse T Cell and NK Cell Metabolic Profiling assays
- Webinar: T cell therapy XF Pro Solution | Agilent
- Video: Metabolic Profiling Metrics: Key Drivers in T Cell Therapy
- Application Note: Assessing T Cell Bioenergetic Poise and Spare Respiratory Capacity Using Extracellular Flux Analysis
- Application Note: Assessing NK Cell Bioenergetic Metabolism Using Extracellular Flux Analysis
- Kit Info: XF Hu T Cell Activation Assay Kit
- Kit Info: XF Hu T Cell Activation Assay Kit
- Webinar: How to analyze XF neutrophil activation result data
- Application Note: Real-time detection and modulation of T cell activation
- Application Note: A new method to assess T cell activation
- Application Note: Real-time detection and modulation of T cell activation
- Application Note: Monitor macrophage response to activation in real-time
- Application Note: A new method to assess neutrophil activation and oxidative burst
Mitochondrial Toxicity
- Kit info: Seahorse XF Mito Tox Assay Kit
- Webinar: Rapid Accurate Detection of Mitochondrial Toxicity Using the Agilent Seahorse XF Pro
- Application Note: A Customized XF Workflow for Detection and Characterization of Mitochondrial Toxicity
- Application Note: Measurement of Mitochondrial Toxicity Using Primary Hepatocytes
- White Paper: Principle of Mitochondrial Toxicity Assessment Using Agilent Seahorse XF Solution
6.2 Normalization of XF Data.
Whether comparing different cell types, genetic modifications or compound treatments, normalization of functional biological data is a key component in the workflow for performing XF assays and/or subsequent analysis and interpretation of XF data. Normalization of XF assays can be applied on several levels, including cell number, genomic DNA, and total cellular protein.
The materials below provide information on methods for normalization of XF Data for your .
- Overview: XF Data Normalization Overview
- Overview: XF Adherent Cell Data Normalization Overview
- Tech Guide: Seahorse XF Imaging and Normalization System - XFe96 Hoechst33342 Staining Optimization Guidelines
- Tech Guide: Seahorse XF Adherent Cell Imaging and Normalization System - XFe96 Hoechst33342 Staining Optimization Guidelines
- Tech Guide: Seahorse XF Imaging and Normalization System - XFe24 Hoechst33342 Staining Optimization Guidelines
- Tech Note: Data Quality Management using Brightfield Images with the Seahorse XF Imaging and Normalization System
- Tech Note: Methods and strategies for normalizing XF metabolic data to cellular parameters
- Application Note: Using the Agilent NovoCyte Flow Cytometer for Immune Suspension Cell Normalization in Agilent Seahorse XF Assays
6.2 Fatty Acid Oxidation Assays
The regulation of metabolic pathways and energy expenditure, and how differential substrate oxidation contributes to metabolically regulated signaling mechanisms is an important topic for researchers in divers fields such as immunology, cancer and stem cell biology and drug target identification and mechanism-of-action studies.
- Overview: XF Palmitate-BSA FAO Substrate Reagents
- Publication: Assessment of Fatty Acid Beta Oxidation in Cells and Isolated Mitochondria (Rogers, et al, Curr Protoc Toxicol, 2014)
- Publication: KLF15 and PPARα Cooperate to Regulate Cardiomyocyte Lipid Gene Expression and Oxidation; (Prosdocimo, et al, PPAR Research, 2015)
6.3 Permeabilized Cells and Isolated Mitochondria
The study of mitochondrial function is central to both clinical and basic scientific research. The Agilent Seahorse XF Cell Mito Stress Test provides a initial mitochondrial bioenergetic profile. However, examining the precise enzyme or pathway driving observed changes can provide additional insight and further link-specific alterations in metabolic enzymes with disease states.
A traditional method of studying substrate oxidation involves isolating mitochondria, and the XF Analyzers support a high-throughput assay in which both energy demand and substrate availability can be tightly controlled for mechanistic studies using minimal quantitiues of isolated mitochondria.
However, there are several disadvantages when isolating mitochondria, including limited quantity and a bias stemming from the sub-selection or damage of mitochondria during isolation. XF Plasma Membrane Permeabilizer (PMP) forms pores in the plasma membrane of adherent cells without causing any concomitant damage to the mitochondrial membrane. This reagent overcomes the challenges associated with using isolated mitochondria or substrate-supplemented media with intact cells.
The study of mitochondrial function is central to both clinical and basic scientific research. Mitochondrial respiration measurements using intact cells can help define metabolism and its dysregulation in fields such as cancer, immunology and mitochondrial toxicology.
Using intact cells in combination with Agilent Seahorse XF assays can provide an overall cellular and mitochondrial bioenergetic profile. However, because changes in mitochondrial function may correlate to altered mitochondrial substrate oxidation, examining the oxidation of specific substrates is one approach to determine the mechanism underlying differences observed in mitochondrial activity using intact cells.
The XF Plasma Membrane Permeabilizer (XF PMP) allows for experimental control over specific substrates provision to the mitochondria by providing safe and consistent permeabilization of the plasma membrane in situ and eliminating the need for isolation of mitochondria from cultured cells or use of detergents (digitonin) for cell permeabilization. This allows for assessment of multiple mitochondrial substrate oxidation pathways in single experiment, providing direct functional measurement of CI-, CII- and CIV-linked respiration
By combining XF PMP, substrates, and inhibitors, the XF Electron Flow assay yields a powerful approach to understanding mitochondrial function when testing effects of interventions (genetic manipulations/compound treatments) on mitochondria.
Thus, in cases where a relevant cell model is available, including established cell lines and primary cells, the permeabilization of the plasma membrane in situ via XF PMP is highly preferable to isolation of mitochondria from cultured cells, outlined in the table below.
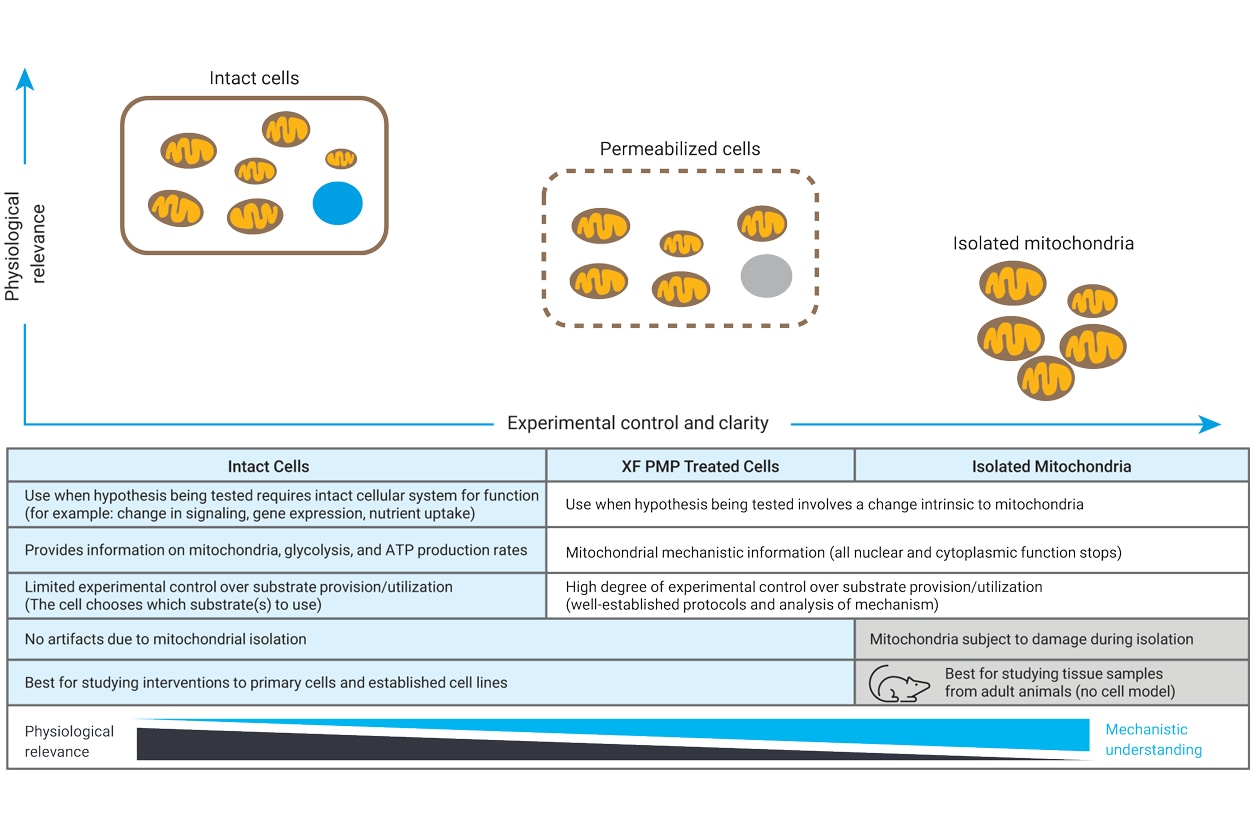
The content below explains how changes in mitochondrial function due to compound treatments and/or genetic interventions can be investigated by permeabilizing cells using XF PMP and the XF Electron Flow Assay.
Permeabilized Cells
- Overview: XF Plasma Membrane Permeabilizer Reagent
- Technical Note: Assessing Mitochondrial Respiratory Complexes Using Cells Permeabilized with XF Plasma Membrane Permeabilizer (PMP)
- Technical Note: Using PMP to Measure Substrate Specific ETC/OxPhos Activity in Permeabilized Cells
- Technical Note: Using PMP to Measure Mitochondrial ETC Complex Activity in Limited Biomaterials
- Overview: The XF Plasma Membrane Permeabilizer Reagent
- Reagent Info: XF Plasma Membrane Permeabilizer
- Technical Overview: Performing the XF Electron Flow Assay using the Agilent Seahorse XF Plasma Membrane Permeabilizer
- Application Note: Applying the Agilent Seahorse XF Plasma Membrane Permeabilizer and XF Electron Flow Assay - Data Analysis and Interpretation
- Publication: Measuring Mitochondrial Function in Permeabilized Cells Using the Seahorse XF Analyzer or a Clark-Type Oxygen Electrode (Divakaruni, et al, Curr Protoc Toxicol, 2014)
- Publication: Thiazolidinediones are acute, specific inhibitors of the mitochondrial pyruvate carrier (Divakaruni, et al, PNAS, 2013)
Isolated Mitochondria
- Application Note: Analyzing Microgram Quantities of Isolated Mitochondria in the Agilent Seahorse XFe/XF96 Analyzer
- Application Note: Analyzing Microgram Quantities of Isolated Mitochondria in the Agilent Seahorse XFe/XF24 Analyzer
- Publication: High Throughput Microplate Respiratory Measurements Using Minimal Quantities Of Isolated Mitochondria (Rogers, et al, PLoS One, 2011)
- Publication: Preparation and Respirometric Assessment of Mitochondria Isolated from Skeletal Muscle Tissue Obtained by Percutaneous Needle Biopsy (Bharadwaj et al, JOVE, 2015)
- Publication: Isolation of Mitochondria from Minimal Quantities of Mouse Skeletal Muscle for High Throughput Microplate Respiratory Measurements (Boutagyet al, JOVE, 2015)
- Publication: Using Isolated Mitochondria from Minimal Quantities of Mouse Skeletal Muscle for High throughput Microplate Respiratory Measurements (Boutagy, et al, JOVE, 2015)
6.4 Hypoxia and Spheroids
6.4 Hypoxia and Islets
6.4 Hypoxia
Analyzers have the capability of measuring metabolism in reduced oxygen environments (hypoxia), as well as with certain types of three-dimensional samples, including spheroids.
Hypoxia
- Overview: Assays under Hypoxic Conditions
- Overview: Assays under Hypoxic Conditions
- Technical Overview: Conducting an XF Assay in a Hypoxia Chamber (≥3 % O2)
- Technical Note: Conducting an XF Assay in a Hypoxia Chamber(≥3 % O2)
- Technical Note: Conducting an XFe Assay in a Hypoxia Chamber (≥3 % O2)
- Technical Note: Conducting an XFe Assay in a Hypoxia Chamber (≥3 % O2)
- Technical Note: Conducting an XF Assay in a Hypoxia Chamber (≥3 % O2)
- Application Note: Identifying Metabolic Phenotype Switches in Cancer Cells Using the Agilent Seahorse XF Analyzer in an Hypoxic Environment
Spheroids
Showing only information for the Seahorse Seahorse XF Pro
Change instrument typeNeed more information?
Shop the online store to purchase cartridges, plates, kits, media, and reagents to your XF assay. Browse the complete list of all Seahorse Cell Analysis consumable products for your XF Analyzer.
Online store
Shop the online store to purchase cartridges, plates, kits, media, and reagents to your your XF assay. Browse the complete list of all Seahorse Cell Analysis consumable products for your XF Analyzer.
Buy XF AssaysGet in touch
Get in touch with an Agilent Seahorse XF representative to schedule a demonstration and see how Agilent Seahorse XF Analyzers can solve your research needs.
Request a demoWorldwide technical support
Global / United States:
+1 719 528 7500
United States (Toll Free):
+1 800 227 9770
European Toll Free:
00 800 345 347 00
(UK, Ireland, France, Germany, Denmark, or Netherlands)
Other Countries: +45 8830 5500
China (Toll Free Landline):
800 820 3278
China (Toll Free Mobile Phone):
400 820 3278