Gas Chromatography/
Mass Spectrometry Fundamentals
Frequently asked questions
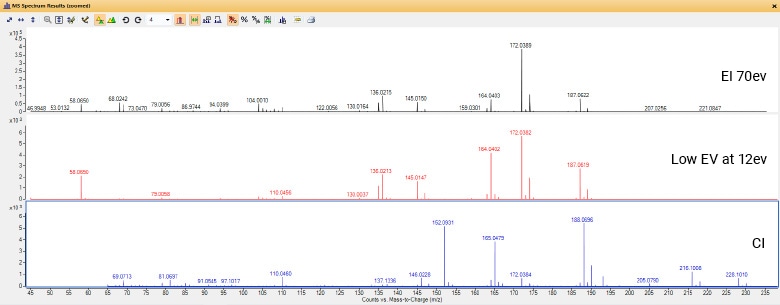
What’s the difference between electron ionization and chemical ionization?
Electron ionization (EI) operates in a high vacuum with a relatively high (70 eV) ionization energy. It is often referred to as a “hard” ionization technique, because spectra are characterized by extensive fragmentation and low levels of molecular ion abundance. The advantages of EI include repeatable spectral data and the availability of extensive spectral libraries. For example, the NIST EI library contains over 300,000 unique compounds, making EI an excellent choice for compound identification.
Chemical ionization (CI) adds a reagent gas, like methane or ammonia, to the GC/MS source. Reagent gas molecules are ionized in the CI source and form ions that react with the analyte molecules in the source. Traditionally CI has been called a “soft” ionization technique, because its lower ionization energy results in less ion fragmentation than with EI. It also generally (but not always) retains the molecular mass as M+1 for positive CI and M-1 for negative CI. Also, CI sometime generates aducts, such as M+C2H5 (C2H5=29) and M+C3H5 (C3H5=41). An alternative to CI is low energy EI, available on the Agilent 7250 GC/Q-TOF. This software-controlled capability makes it easier to preserve molecular ions for identification.
More than 90% of GC systems run EI for more than 90% of their operating life. Although CI is less commonly used, some CI techniques do give improved results over EI.
What other ion sources are available for gas chromatography/mass spectrometry instruments?
Agilent offers several source types and lens diameters to maximize performance for different applications.
- Our HydroInert source improves chromatographic efficiencies and spectral fidelity with hydrogen carrier gas.
- The patented Agilent JetClean self-cleaning ion source greatly reduces—or eliminates—the need for source cleaning on Agilent single and triple quadrupole GC/MS systems. See it in action.
What’s the difference between GC/MS and GC/MS/MS?
GC/MS/MS refers to highly selective operational modes where more than one fragmentation and filtering step is performed, as with multiple reaction monitoring (MRM) on a GC/TQ. A mass filter is applied to the first quadrupole, further fragmentation occurs in the collision cell, and another mass filter is applied to the second quadrupole.
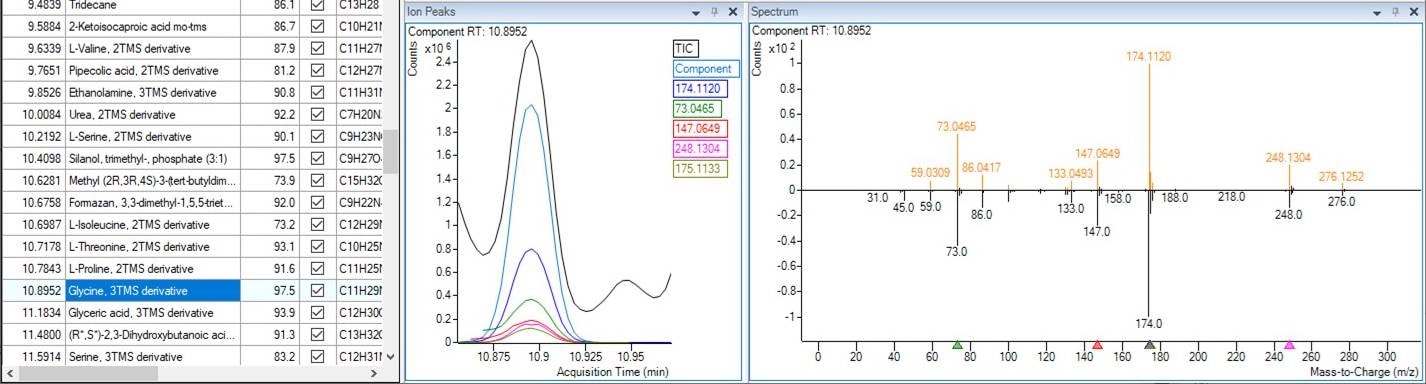
How does a library identify spectral data collected from a GC/MS?
After background subtraction, the newly obtained mass spectrum of an unknown compound is compared against a library of spectra from known compounds in a database. An algorithm is employed to match the mass-to-charge ratios and their relative abundances between the new and database spectra, creating a match score. Common spectral libraries include NIST, Wiley, and Maurer/Pfleger/Weber, which contain spectra for hundreds of thousands of different chemicals. You can also explore the Agilent collection of spectral libraries.
This figure shows an overlay of the analytical spectrum (upper) over the inverted library spectrum (lower). Depending on how the search is performed (Search Index – SI vs Reverse Search Index – RSI) the matching score and ion ratios can be different. RSI is typically recommended.
How do I quantitate a particular analyte in the sample?
First, calibrate the mass spectrometer by introducing the analyte in question at several known concentrations. Your data system will create a calibration curve by plotting these nominal concentrations against the abundance of the response at each concentration. You can then compare the abundance of the analyte in your newly acquired data against this calibration curve.
Do GC/MS responses scale linearly with concentration?
Most molecules measured by single or triple quadrupole GC/MS have linear regions in their response curve. As you get closer to the detection limit, the response becomes less linear, and drops further as you approach detector saturation. Generally, there can be three to four orders of linear range between extremes, but higher results are possible.
How do elements with multiple isotopes affect a GC/MS detector?
A molecule generates a spectrum. As mass numbers change between isotopic ions (such as C12 and C13), the corresponding molecular mass will change, and the MS analyzer will detect that change. The corresponding mass spectrum or spectra will reflect this difference in mass intensity, based on abundance.
A GC/MS instrument is sensitive enough to notice the difference between ions made from different isotopes of the same element. The presence of isotopes can often be used as a tool to selectively identify different compounds, especially for data collected on a GC/Q-TOF.
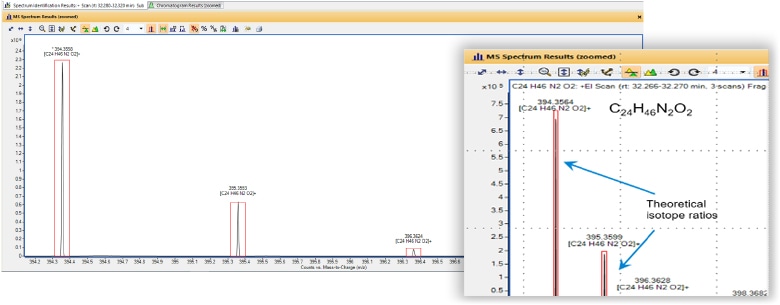
The GC/Q-TOF exhibits high mass accuracy and reliable data. In this example the red outer line represents the theoretical Isotopic response/ratio for the compound, and the inner black line represents the calculated ion and isotopic ratio. As you can see, the intensity of the calculated ions are within 90% of the theoretical ions.
How can I verify that my GC/MS is working properly?
First, perform an instrument autotune to adjust the electronic setpoints of the ion source and quadrupole in your GC/MS system for optimal performance. Then, run some known samples and compare their spectra to the spectra of known standards. Check tunes can be performed periodically to check the tune against expected performance.
How do I maintain good performance on my GC/MS?
You can prevent a significant amount of unplanned instrument downtime by following GC/MS best practices. Get tips on sample preparation and screening—and learn about features like the Agilent JetClean self-cleaning ion source and backflush—that keep your GC/MS in peak operating condition.
Does mass spectrometry destroy the sample?
Yes, because it exposes the sample to ionization. The good news is that only a small volume of material is needed—typically as little as 1 µL. Modern GC/MS instruments are routinely used to detect concentrations down to the parts-per-billion (ppb) level. Additionally, you can use a Capillary Flow Device to split the sample for simultaneous analysis by other GC detectors, if desired.
What is high-resolution GC/MS?
A high-resolution GC/MS is a GC system coupled to a mass spectrometer with high-resolution capability. An example is a GC/Q-TOF with a quadrupole time-of-flight detector that delivers full-spectrum, high-resolution, accurate mass data (HRAM) with a wide dynamic range.
High-resolution GC/Q-TOF enables accurate mass screening by GC/MS and enhanced compound identification through MS/MS, low-energy electron ionization, and complimentary chemical ionization techniques.
This data shows the mirror image of the analytical spectrum to the library spectrum. The analytical spectrum is high resolution with 4 decimal points obtained from the GC/Q-TOF. The library spectrum is a unit mass spectrum from NIST. As you can see, the spectrum generated by the GC/Q-TOF matches the spectrum from the NIST library with a high confidence score. Although we recommend a high resolution accurate mass library be used for high resolution data, the NIST library data base—which is very extensive—can also be used with high confidence.
What are the different types of GC columns Agilent offers?
Agilent offers standard, mass spec, Ultra Inert (UI), and Ultra Low Bleed (Q) GC columns.
Standard columns are good for general applications, but as detectors grow more sensitive, any background noise becomes more apparent. With a mass spectrometer (MS), there are several factors that can create background noise in your chromatogram, and one such factor is column bleed.
Mass spec columns have about 50% less column bleed than the standard versions, making them ideal for use with sensitive detectors, like an MS.
Agilent Ultra Inert GC columns go through an extra step to make them more inert to active compounds, reducing the chance of chromatographic issues such as peak tailing, ghost peaks, poor resolution, and signal loss.
Agilent Ultra Low Bleed columns (Q) combine Ultra Inert surface deactivation with Ultra Low-Bleed chemistry to deliver exceptional signal-to-noise ratios and mass spectral integrity for consistent and reliable column performance. Q columns are ideal for GC/TQ and GC/TOF use and trace level applications.
What are the most common GC columns?
The most used stationary phases in GC are 1, 5, 624, and Wax. These columns span a range from non-polar to polar and it is good practice to have these columns on hand. The most ubiquitous column is a 5 or a 5ms phase and is a good starting point when selecting a column chemistry. Specifically for mass spec, DB-5ms UI or DB-5Q are great general purpose use columns.
How do I select an internal standard (ISTD) for my GC/MS analysis?
It depends on the compounds that you’re analyzing and (to a point) the consumables you are using. For example, you can’t use a carbon frit liner when analyzing deuterated PAHs because these compounds bind with carbon. Here are some general selection guidelines.
- Choose an ISTD that won’t appear in your standard, that is stable and not active, and that is possibly related to the compounds in the mixture (not required).
- The compound should fall in the middle of the elution order. When using multiple ISTDs, make sure they are spread out across the elution order.
- Hold the ISTDs at one concentration across your calibration curves. If you look at 0.1 to 50 ppm, then select a concentration with easy identification of those ISTDs, such as 10 to 20 ppm. ISTDs remain at 10 ppm in every calibration standard, while the compounds of interest range from X to Y.
- If a deuterated version of a compound of interest is available (and not too expensive), then that may be the best ISTD for your analysis.
Unfortunately, the answer isn’t always straightforward. For example:
- Six deuterated PAHs can be used for EPA 8270 and EPA 525 (GC/MS and GC/MS/MS analyses of pesticides in food).
- Some analysts use phenanthrene-d10 alone for pesticides analyses.
- In GC-ECD studies of endrin and DDT breakdown, lindane (γ-BHC) can be used as an “internal standard,” being a stable pesticide with good, consistent GC-ECD response.
- For some nitrosamines in water analyses by GC/MS/MS, N-nitrosodi-n-propylamine-d14 (NDPA-d14) can be applied, as recommended in EPA 521.
- Diiodobenzene has been used as an internal standard for forensic toxicology work.
How do I develop methods in MRM/SRM mode?
A free Agilent University course shows how MRM optimizer can help you develop the MS/MS method for MRMs and SRMs: GCMS-7000-2090r – How to Select Product Ions for Triple Quadrupole GC/MS Analyses.
In this recorded lecture, Dr. Frank J. Van Lenten walks you through the initial steps of MRM method development, including the selection of precursor and product ions. Several different scenarios are presented to help you develop MRM methods more efficiently and effectively. This seminar is presented using an Agilent 7000 triple quadrupole GC/MS system running on MassHunter GC/MS Acquisition software revision B.07.05 and MassHunter Qualitative Analysis B.07.00.
Topics covered:
- Determining precursors from MS1 scan or library data.
- What happens during product ion scanning?
- Do I use profile or centroid data?
- Setting up product ion scan in MassHunter Acquisition.
- Using design experiments assistant to create a production scan sequence.
- Using MassHunter qualitative analysis to look at the data.
How do I choose the right mass spectrometer?
Single quadrupole
Single quadrupoles are the most versatile, familiar, easy to use, and robust mass spectrometer. The Agilent single quadrupole GC/MS portfolio includes several models based on the ion source and type of ionization (soft or hard) needed. The type you choose depends on your analytes of interest, sensitivity, and how much you want the analytes to fragment. Data can be collected in scan mode or selected ion monitoring (SIM) mode, and you can adjust scan speed based on how many ions you are looking for. Coupled with new technologies that drive maximum productivity in your lab, the single quadrupole GC/MS is designed to provide robust, day-in, day-out performance in a lab.Triple quadrupole
Also called tandem mass quadrupoles, triple quadrupoles don’t always have three quadrupoles in a row. Occasionally, there’s a hexapole or an octupole in the middle, but the term “triple quadrupole” is still used. With triple quadrupoles, the additional collision cell and quadrupole allow you to have a lower level of detection and higher selectivity. You can also run a triple quadrupole like a single quadrupole in scan or SIM mode. With both single and triple quadrupoles, several libraries and databases are available to help identify unknowns.Time of flight (TOF) and Quadrupole Time of Flight (Q-TOF)
In TOF, ions travel a known distance through a drift (flight) tube, with smaller ions moving faster than larger ions. The mass-to-charge ratio is based on the time it takes to reach a detector. This process allows for high resolution of mass spectra and enhanced selectivity. A Q-TOF, which combines a quadrupole with a TOF, offers several additional benefits. It provides higher mass accuracy and resolution, making it ideal for identifying unknowns and characterizing complex samples. It also boasts an excellent dynamic range, enabling the detection of both low- and high-abundance ions in a single run. Finally, Q-TOF ensures precise quantitation and has full scan capability to capture all ions in one go. So, if you’re looking for accurate mass and qualitative analysis tools, Q-TOF is the mass spectrometer for you.What is a good approach for analyzing unknown compounds?
If the compounds are “unknown unknowns” and you need to perform compound discovery, then use GC/Q-TOF. This instrument has software to help determine fragments and potential compound identity. If the compounds are “unknown to me,” then you can use GC/MS in scan mode (however, GC/Q-TOF is still best for trace levels). Start with a general-purpose GC/MS method—such as one with a slow oven ramp and longer final hold time—to ensure that everything elutes off the column. Make sure to run a solvent blank to subtract any background from your solvent, and potentially a method blank if you’re performing sample preparation. Also, ensure that your scan range is large enough to detect compounds that you may be interested in. Usually, 40 to 500 amu is a good range to start with. Software programs like Agilent MassHunter Unknowns Analysis, together with a library like NIST23, can help you examine the peaks in your chromatogram. The NIST library doesn’t feature every compound, but it is comprehensive. Depending on your column, there could be a potential for coeluting peaks. To identify your peaks, you may need to perform your analysis on a second column with a different polarity.
Can I quantify GC/MS results in either scan or SIM mode?
The short answer is yes. We suggest building a calibration curve of your compounds and using internal standards to help avoid issues with bad injections or minor detector fluctuations. Selected ion monitoring (SIM) mode offers more sensitivity than scan mode, because you’re focusing on the ions you’re looking for. Also, if you are using SIM mode for your analytical method, we recommend mirroring this method in scan mode. This way, if you suspect that compounds have shifted out of your SIM windows, you can verify retention times and update your SIM windows if needed.