Access Agilent eNewsletter September 2016
Implementing an extractable and leachable (E&L) study from a pharmaceutical product by high resolution QTOF LC-MS
Andreas Tei, Agilent Global Pharma Segment Manager
Pharmaceutical products may become contaminated by chemical compounds derived from primary and secondary packaging material. Because extractable and leachable (E&L) impurities potentially pose a risk to human health, the United States Food and Drug Administration has issued guidance on container closure systems for packaging human drugs and biologics. Agilent provides the wide range of hardware and software tools that enable confident E&L analysis.
Multiple techniques enable analysis of a broad range of compound classes
With their diverse physicochemical properties, it is a challenge to detect all variations of contaminants that originate from the container closure material in pharmaceutical products. Several Agilent Application Notes describing the analysis of volatile and semi-volatile extractables and leachables by GC/MS were published within the last 12 months.
In this article, we show high-resolution Q-TOF LC/MS analysis of nonvolatile E&Ls from an ophthalmic solution drug product. We also show the advantages of Agilent Mass Profiler software, a state-of-the-art data mining tool that supports unambiguous detection of compounds even in the presence of a heavy matrix-related background.
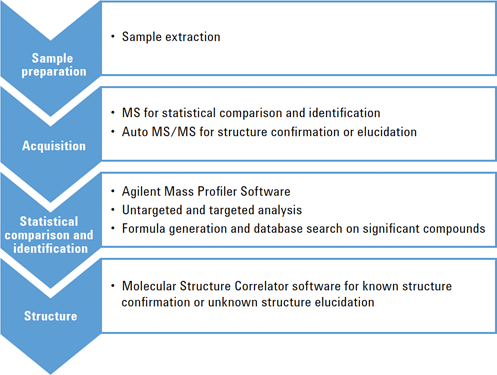
Figure 1. LC/MS analysis workflow uses Agilent MassHunter Data Acquisition, Agilent Mass Profiler, and Agilent MassHunter Molecular Structure Correlator Software.
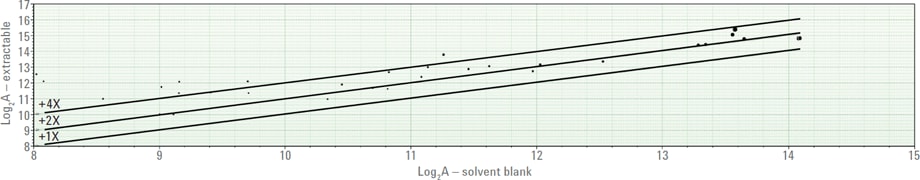
Figure 2. Agilent Mass Profiler plot of logarithmic abundance of extractable compounds versus solvent blank.
Further, we demonstrate how to identify compounds based on high-resolution mass spectra using an Agilent MassHunter Personal Compound Database and Library dedicated for E&Ls (PCDL). Sensitive instrumentation and an advanced electrospray ionization technique allow you to detect E&Ls at low concentrations within difficult matrices. Often, the compounds lack basic heteroatoms, so electrospray ionization efficiency is only moderate. To overcome this limitation, we optimize sensitivity with an Agilent 1290 Infinity LC System combined with an Agilent 6540 Accurate-Mass Q-TOF LC/MS.
Data mining software reveals compounds detected above solvent blank
During the screening for impurities, the container for the “blank” solvent usually includes background levels of E&Ls. Typically, when you eliminate the compounds detected in the blank solvent with a simple background subtraction, you also remove potential E&Ls from the samples. So it is important to perform a sample-to-sample comparison to retain compounds based on their intensity differences. Agilent Mass Profiler software is a statistical tool that helps to compare similarities and differences between data sets. Figure 2 shows a comparison where one-, two-, and four-fold abundance lines mark the abundance thresholds for compounds detected above the solvent blank.
System suitability test delivers proof of performance
For a recent LC/MS analysis, we used a mix of nine typical plasticizers to develop a basic chromatographic method and to test the system performance at concentrations of 1 ppm. Agilent Application Note 5991-6244EN provides details about the method development and results.
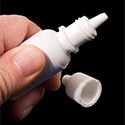
Next, we conducted a test where we used an ophthalmic solution as a drug product. We extracted sample from the ophthalmic medicine bottle with a mix of 1:1 methanol/water and incubated the bottle with solvent for 72 hours at 55 °C. We directly injected the extract into the Q-TOF LC/MS/MS system and acquired data in positive and negative ionization modes.
For leachable samples, we first directly injected the liquid formulation into the Q-TOF LC/MS/MS system. We stored a second sample for 24 hours at 60 °C within the drug container. We did this to accelerate the contaminant leaching process.
We also injected blank extraction solvent samples to determine the concentration of E&Ls within the solvent.
Powerful tools distinguish contaminants from samples versus solvent
After data acquisition, we used Agilent MassHunter Profinder software to extract the molecular features. We extracted 200 different molecular features from the combined positive and negative total ion chromatograms (TICs) of the bottle extract. We used Agilent Mass Profiler software to compare the molecular features found in the solvent blank with those in the sample extract. After application of the fold change algorithm, we obtained a much smaller number of 45 different compounds. We applied identical procedures for both leachable samples to filter out background contaminants from the solvent.

Figure 3. Database results identified dinonyl phthalate. The results show that isomers diisononyl phthalate and n-octyl-n-decyl phthalate are also possible targets.
Agilent Mass Profiler software was used to identify the compounds based on their accurate masses. With the MassHunter software tools, it is easy to identify E&Ls with our new developed PCDL containing spectral data of 1000 common E&Ls and it is easy to save your own spectra extending its content. Figure 3 is an example of a database that shows the identity, isotopic distribution, and structure of dinonyl-phthalate identified in the empty ophthalmic bottle extract. Eleven extractable compounds were identified with the use of the database.
Spectral matches produce identifications of E&Ls
For both known and unknown compounds, MS/MS spectra were matched with theoretical best structures using Agilent MassHunter Molecular Structure Correlator. This strategy enabled the confirmation of known compounds, and aided the structural elucidation of unknown compounds. Approximately 50 compounds were found in each E&L sample. Agilent Application Note 5991-6828EN provides details.
If you need confident identification and quantification of potential E&Ls from contact closure system components and packaging materials, discover more about Agilent solutions for E&L analysis. Then contact your Agilent representative for additional information.
Stay informed about the applications that are important to you
Subscribe to Access Agilent
Our free customized
monthly eNewsletter
Article Directory – September 2016
All articles in this issue
-
 High-resolution, efficient quantification of aggregates in protein therapeutics with Agilent 1290 Infinity II 2D-LC Solution
 -
 Fast determination of bitter, clove-like flavor in beer with the Agilent 1290 Infinity II LC
 -
 Direct heating delivers a new paradigm in gas chromatography analysis
 -
 Implementing an extractable and leachable (E&L) study from a pharmaceutical product by high resolution QTOF LC-MS
 -
 Multi-omic analysis helps researchers to integrate complex omics data in cancer research
 -
 Gain control—Agilent 490-PRO Micro GC optimizes process monitoring
Figure 1
LC/MS analysis workflow uses Agilent MassHunter Data Acquisition, Agilent Mass Profiler, and Agilent MassHunter Molecular Structure Correlator Software.
Figure 2
Agilent Mass Profiler plot of logarithmic abundance of extractable compounds versus solvent blank.
Figure 3
Database results identified dinonyl phthalate. The results show that isomers diisononyl phthalate and n-octyl-n-decyl phthalate are also possible targets.