Access Agilent eNewsletter February 2016

Agilent AdvanceBio Peptide Mapping columns to solve glycan mapping challenges
Vicki Pandey, Agilent Global Marketing Communications
Glycosylation of monoclonal antibodies (mAbs) is one of the common posttranslation modifications. These glycoprotein biopharmaceuticals contain complex oligosaccharide moieties whose presence, absence, sites of attachment, and relative abundance profiles can have significant impact on the efficacy, pharmacokinetics, immunogenicity, folding, and stability of a drug.
Glycan moieties have a key role in immunogenicity, effect or function efficacy, and clearance of mAbs. The stability of a recombinant protein therapeutic requires long-term monitoring throughout the shelf life of the product for important modifications, such as glycosylation. Glycosylation can be analyzed on the intact protein, but glycopeptide mapping is necessary to provide additional critical information such as sequence information, mass analyses, and identification of the glycosylation sites.
To address these challenges, we examine some specific solutions for characterizing glycan structure and monitoring glycan profiles using Agilent LC columns, LC/MS, and LC systems.
Fast glycosylation characterization achieved using integrated Agilent solution
To characterize an IgG derived from CHO cells, we first used a fast and efficient liquid chromatography-TOF mass spectrometry approach. An Agilent Poroshell 300SB-C3, 5 µm superficially porous column was used to obtain accurate glycoform masses of an intact IgG1, with a subsequent analysis of papain-digested IgG1 to obtain site-specific glycosylation profile information of the Fc region for further characterization of IgG1 heterogeneity.
In this application, we used an Agilent 1200 Infinity LC System with diode array detection and an Agilent 6224 TOF LC/MS. Additionally, a subsequent mAb-glyco chip LC/MS analysis was used to build a glycan accurate mass database for extra validation of the glycans identified in the TOF mass analysis.
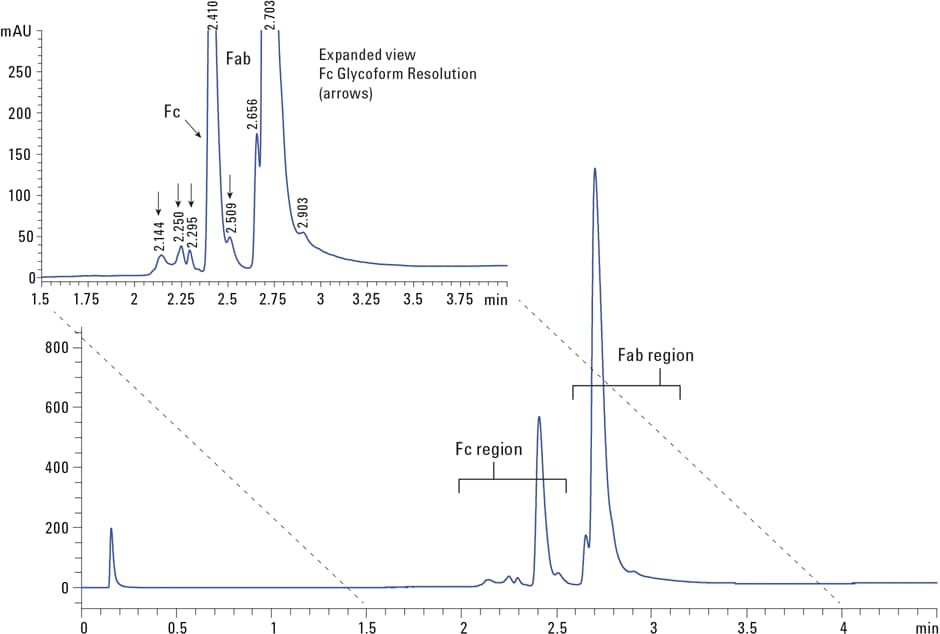
Figure 1. Reversed-phase separation of IgG1 after papain digestion showing two primary peaks of the Fc and Fab fragments. The inset details partially resolved peaks representing variants of the Fc and Fab fragments (arrows).
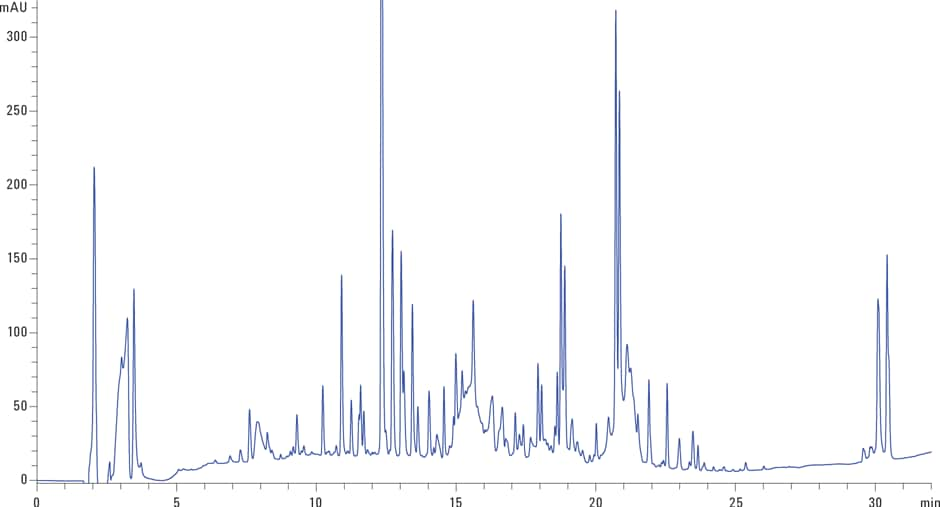
Figure 2. A reversed-phase rhEPO peptide map using a 2.1 × 250 mm, 2.7 µm Agilent AdvanceBio Peptide Mapping column.
Figure 1 shows the separation and the conditions after cleavage in the reversed-phase chromatogram. In this separation, performed in less than 3 minutes, two primary peaks at 2.4 and 2.7 minutes are shown, representing the Fc and Fab fragments, respectively. Additionally, there are smaller sets of partially resolved peaks at 2.1 to 2.5 minutes among the Fc region, representing variants of the Fc fragment.
Full details on methods for characterizing glycosylation are available in Agilent publication 5991-2323EN.
High-resolution glycopeptide mapping
We then assessed an Agilent AdvanceBio Peptide Mapping column with 2.7 µm particles based on superficially porous technology. The column was specifically designed to improve separations of peptide and peptide mapping applications. We used the same LC/MS instrument setup as in our first example.
Figure 2 shows how the 2.1 × 250 mm column and optimized chromatographic conditions, with formic acid as the ion-pair additive, enabled a high resolution separation of the rhEPO tryptic digest. The separation shows very narrow peak widths, increased sensitivity, and unique selectivity across the gradient profile, making this separation highly amendable to ESI/MS analysis.
See Agilent publication 5991-1813EN for an in-depth explanation on the use of the AdvanceBio Peptide Mapping column for glycopeptide mapping.
Figure 3. Separation of 2-AB-labeled fetuin.
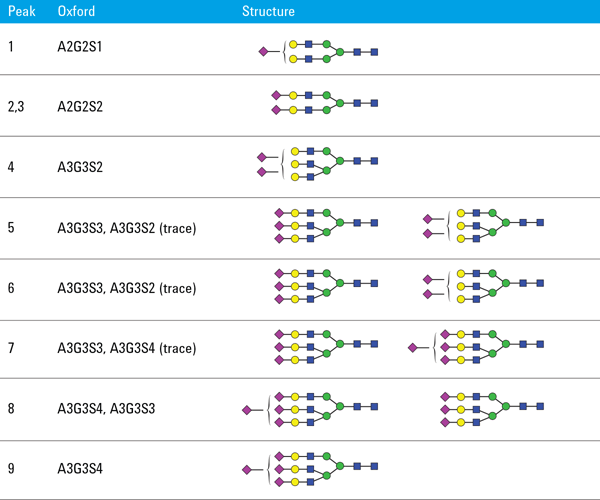
Table 1. Detailed information of N-glycan ovalbumins.
Achieve efficient analysis of antibodies
Finally, we used an Agilent AdvanceBio Glycan Mapping column in a 1290 Infinity Binary LC and Agilent 6530 Accurate-Mass Q-TOF LC/MS to examine N-glycans of mAbs and other glycoproteins. N-glycans from fetuin and ovalbumin were released by PNGase F, derivatized with 2-AB, and analyzed using HILIC/UHPLC with online MS. Figure 3 shows the glycosylation profile of bovine fetuins, dominated by complex nonfucosylated biantennary and triantennary glycans containing NeuAc. Nine major peaks could be assigned using Q-TOF/MS detection. Table 1 shows the assigned glycan structures.
Get the full story of N-glycan analysis using UHPLC with fluorescence detection in Agilent publication 5991-5253EN.
State-of-the-art solutions for biologics and biosimilars
Biotherapeutics have great potential to improve human health. The number of approved protein and antibody therapeutics continues to grow around the world as this important therapeutic class addresses unmet medical needs. At every stage in the process, from disease research to QA/QC to manufacturing, Agilent can help you make the right choices for moving therapeutics successfully to market. Explore our full range of AdvanceBio column resources today.
Stay informed about the applications that are important to you
Subscribe to Access Agilent
Our free customized
monthly eNewsletter
Article Directory – February 2016
All articles in this issue
 New Agilent AdvanceBio SEC column simplifies mAb/ADC analysis
 Support sustainability and maximize value for your labs by selling or buying used instrumentation
 Ask the Expert: Where can I go for expert advice on dissolution issues and techniques?
 Agilent GC/MS/MS enables trace level analysis of dioxins in environmental samples
 Agilent Inert Flow Path for GC and GC/MS minimizes surface activity that compromises your results
 Tip: One call to Agilent ensures optimal performance of your PerkinElmer systems
 Agilent AdvanceBio Peptide Mapping columns to solve glycan mapping challenges
 Agilent supports GC/MS with fast, accurate FTIR screening of phthalates in toys
 Reduce carryover and enhance analysis speed with new Agilent 1290 Infinity II Vialsampler
Figure 1
Reversed-phase separation of IgG1 after papain digestion showing two primary peaks of the Fc and Fab fragments. The inset details partially resolved peaks representing variants of the Fc and Fab fragments (arrows).
Figure 2
A reversed-phase rhEPO peptide map using a 2.1 × 250 mm, 2.7 µm Agilent AdvanceBio Peptide Mapping column.
Figure 3
Separation of 2-AB-labeled fetuin.
Table 1
Calibration curves for acephate at six concentrations demonstrate dramatic improvement in linearity with the Agilent Inert Flow Path.