Agilent Corporate Citizenship Report 2015

DMA EN
DISCLOSURE ON MANAGEMENT APPROACH EN
Agilent is committed to conducting its business in an ethical, socially responsible, and environmentally sustainable manner by reporting performance and ensuring that production and operations meet or exceed relevant environmental legislation and regulations. We operate under a companywide Environmental, Health and Safety Management System (EHSMS) that applies to our design, development, manufacturing, distribution, and sales and service operations worldwide. Agilent has demonstrated its effectiveness in managing environmental impact by maintaining an ISO 14001 registration of our EHSMS. EHSMS is a tool to drive continual improvement in environmental performance and pursuit of sustainability. We expect our suppliers to adhere to the same standard of environmental and social responsibility that we maintain, and our Supplier Environmental and Social Responsibility Code of Conduct requires suppliers to adopt sound environmental, health, and safety management practices.
For supplier environmental and social responsibility expectations, view Agilent Supplier Code of Conduct Policy.
Agilent's commitment to the environment and sustainability continued in FY15 through employee engagement and awareness activities on Earth Day and World Environmental Day. Agilent's Santa Clara site offered household electronic-waste recycling drop-off for employees, Singapore site organized a garage sale bazaar to promote recycling and a tour of a local power station plant, Hachioji (Japan) employees participated in a tree-planting ceremony at Takao-no-Mori, China employees at all sites participated in a countrywide handmade-art competition using scrap and recycled materials and India employee volunteers planted trees and took part in energy-saving and paper-reduction activities.
In September 2015, Agilent Technologies Penang passed the Green Office audit assessment from the Penang Green Council. The Green Office Project is a program to help offices adopt sustainability principles including, waste reduction, recycling, energy conservation, water conservation, paper usage, indoor air quality, and employee engagement.
Additional information on our environmental and social performance may be found at Agilent's Commitment to Environment and Social Responsibility.
Agilent recognizes ISO 26000 as a reference document that provides guidance on social responsibility. Agilent aligns with ISO 26000 standards as part of our social responsibility practices. As such, Agilent's environmental policies, programs, and procedures align with ISO core subjects: Environment 6.5 and Organizational Governance 6.2.
Energy and Water
Agilent continues to focus on opportunities to reduce energy and water consumption (normalized by space and headcount). Improvements to operational efficiency include the implementation of energy and water-related projects and a continued focus on utility usage awareness. Agilent has completed over 20 energy and water conservation projects at its major sites leading to a potential annual energy saving of about 750 MWh. Energy use is determined to be Agilent's most significant environmental aspect, consuming approximately 510,000 GJ in FY15 (this amounts to about 59,000 MT of greenhouse gases). Consumption is primarily from the use of electricity (indirect) and gas or fuel oil for heating or on-site electricity generation (direct). Energy consumption is tracked quarterly against targets, and appropriate adjustments are implemented as necessary. Energy consumption is normalized by the operating footprint (in sq. ft.) and now recently, also by headcount.
At its Singapore site, Agilent replaced much of the lighting with more efficient types leading to a saving of about 100 MWh. Similarly, in Boulder, Colorado in the U.S., lighting replacement effected a reduction of a further 475 MWh. Nine projects in the Shanghai office should see reductions in the order of 100 MWh. The Little Falls facility also engaged the opportunity for lighting replacement with projected savings of about 30 MWh.
Globally, these reductions and the continued use of solar photovoltaic generation has effected a net reduction of about 637 MT of Greenhouse Gas Emissions.
In FY15, our net energy reduction target of 1% against FY14 baseline was missed, with an actual increase of about 2%. Much of this increase was attributed to unfavorable seasonal variations and when factored using recognized Degree Day Analysis, reducing this 'real' increase by 1% (overall, an increase of about 1% was still recorded). The other adverse impact on the normalized energy consumption was an increase in production rates at many of our key sites, a factor not considered in the FY15 analysis and so headcount will also be considered for future reporting. No one normalizing method perfectly represents changing operational conditions that impact energy use, but when used together in FY16 there will be a more balanced view of the overall progress against the FY14 baseline and target.
Water use has been identified as one of Agilent's globally significant environmental aspects. Targets to monitor and reduce water usage, where possible, are tracked on a quarterly basis and reported to senior management. The FY15 water conservation efforts have achieved a 2% reduction against the 2% target and is on track to meet the 20% reduction over the 10-year program.
Besides the targeted programs, Agilent also responded to local situations, such as the California drought. Despite there being no specific use reduction targets for commercial and industrial users, Agilent implemented Best Management Practices (BMPs) by looking at how we irrigate our outdoor ornamental landscapes for potential savings, and encouraged employees to do their best to conserve water toward local California conservation standards. Agilent's Folsom site implemented a cleaning system for its production baths used in GC column manufacturing, saving 44,000 gallons a year. The site uses recirculated water in its pond outside the lobby and is installing a drip system for trees and a smart water controller that factors in weather conditions.
Waste Agilent's FY15 waste management plan achieved its targets to:
- Consolidate the data collection processes since the Agilent/Keysight separation.
- Reduce waste disposal liability through a structured audit program for hazardous waste vendors.
Agilent has set up a new goal for 2016 to divert 89 percent of our waste stream away from landfills. Agilent's Mulgrave site in Australia received a Bronze certification in the Waste Wise Business efficiency program, sponsored by the Victoria state government.
Products and Services
Agilent is committed to designing, manufacturing, and distributing environmentally responsible products. Environmental aspects are considered in the design, manufacture, distribution, use, obsolescence, disposal, recovery, and reuse of Agilent products. Our aim is to minimize environmental impact of our products and operations by conforming to applicable regulations and to also proactively implement more sustainable practices in material selection and use.
Agilent has developed an Environmental Compliance Framework to sustain and facilitate compliant product design, development, production, refurbishment, and support.
Agilent aims to minimize the environmental impact of our products and operations:
- Products are designed to be highly reliable to maximize their useful life.
- Maintenance and repair services extend the useful life of Agilent products.
- Customers benefit from product upgrade, trade-in and trade-up programs. When a customer no longer requires an Agilent product, we have implemented several options for reuse, re-manufacture, or take-back based on the product type and customer location to ensure the product is properly managed.
- Reuse programs are offered for selected products, also addressing requirements from the European WEEE (Waste from Electrical and Electronic Equipment) Directive.
Key FY15 achievements related to our products include:
- New and existing product conversions to be ROHS compliant.
- Reduced energy consumption of the next generation GC products.
Agilent contributes to the environment and sustainability not only by reducing the impact of its own products, but also by using its products to measure, analyze and mitigate the impact of chemicals in the environment. Agilent instruments can perform more than 800 different analytical applications and tests related to the environment. Other examples of such contribution are listed below:
- Detecting Pollutants in Water: Agilent is working closely with customers to better identify and address the problem of pharmaceuticals and personal-care products like perfumes and cosmetics being present in water and the environment. We released an application note (based on collaborative work of Agilent application chemists, the U.S. Environmental Protection Agency, and Vogon Laboratory Services), describing the detection of these pollutants-commonly referred to as PPCPs-in water at parts-per-trillion levels using the Agilent 6495 Triple Quadrupole Mass Spectrometer.
- Making Children's Toys Safer: Phthalates are plasticizers used by manufacturers to make plastics more flexible, durable and softer. The U.S. Consumer Product Safety Commission limits their use in toys and child-care products. With Agilent FTIR analyzers and exclusive calibrated methods, laboratories can rapidly screen large numbers of parts and objects for phthalate content with little or no sample preparation. With the portable Agilent 4500 Series FTIR and the newly developed 4500 Polymer ID Package, labs can determine the chemical composition of a polymer in seconds.
- Keeping Dioxins Out of Food: Agilent has developed a new method for dioxin analysis. Dioxins and dioxin-like compounds have been linked to developmental problems, immune system damage and cancer. These toxic compounds can be released into the environment during industrial processes such as metallurgy, cement production, pesticide manufacturing and waste incineration. Regulations in Europe, the United States and other countries require that food samples be tested to detect dioxins and dioxin-like compounds at very low levels.
- Combatting Dangers of Lead Poisoning: Exposure to lead can be toxic to humans. There is no known "safe threshold" of lead in the body, where it will not cause harm. Using Agilent equipment, U.S. researchers have developed a method for detecting heavy metals in urine by collecting metal-bound nanoparticles, and researchers in China have developed a novel method for measuring trace amounts of lead in environmental water and vegetable samples.
G4-EN2
PERCENTAGE OF MATERIALS USED THAT ARE RECYCLED INPUT MATERIALS.
Recycled materials are not used in Agilent products.
G4-EN3
ENERGY CONSUMPTION WITHIN ORGANIZATION
|
Worldwide Energy Consumption |
2012 |
2013 |
2014 |
2015 |
|
Diesel |
|
4,900 |
3,161 |
3,850 |
|
Propane |
1,100 |
1,100 |
1,100 |
1,100 |
|
Solar |
650 |
12,800 |
11,800 |
5,050 |
|
Electricity |
743,000 |
803,000 |
670,200 |
356,110 |
|
Natural Gas |
205,000 |
225,000 |
205,206 |
146,320 |
|
Total |
949,750 |
1,046,800 |
891,467 |
512,430 |
(The data provided for energy and water has been attested by TruCost)
|
GRI Indicator |
FY15 Agilent Data |
Explanation |
|
Total Fuel Consumption from Renewable Sources |
5,050 GJ |
Total energy consumption in-house
solar generation |
|
Total Fuel Consumption |
507,380 GJ |
|
|
Heating Consumption |
146,320 GJ |
Natural gas |
|
Electricity Consumption |
356,110 GJ |
For grid electricity |
|
Diesel for Electricity Generation |
3,850 GJ |
Diesel consumption for electricity at Manesar |
|
Propane Consumption |
1,100 GJ |
Total direct energy consumption for propane |
|
Total Indirect Energy Consumption |
Solar = 5,050 GJ |
|
|
Total Direct Energy Consumption |
Diesel = 3,850 GJ |
|
Notes:
- U.S. Energy Information Agency International Electricity Emissions Factor by Country, 1999-2002 were utilized for all non-U.S. facilities. Details are available at http://www.eia.gov/oiaf/1605/emission_factors.html
- For U.S. facilities, EPA eGRID2012 Subregion map and Subregion GHG output emission rates for CO2, CH4 and N2O, released August 2015 http://www.epa.gov/energy/egrid-2012-subregion-ghg-output-emission-rates
- For stationary fuel consumption (i.e. natural gas) DEFRA 2015 standards are used. Details are available at http://www.ukconversionfactorscarbonsmart.co.uk
G4-EN4
ENERGY CONSUMPTION OUTSIDE THE ORGANIZATION
Agilent energy consumption outside the company is grouped in three distinct categories:
- Goods and services (Includes procurement, upstream and downstream transportation and distribution). Most energy consumption in this category is captured in our freight and logistics vendor emissions reported under G4-EN-17.
- Business travel and employee commuting: Energy consumption for business travel is captured under G4-EN-17. Agilent plans to expand employee commuting data reporting to include other country locations where Agilent operates. For this report, under G4-EN-17 we are only reporting U.S. employee commuting.
- Use of sold products and end-of-life treatment of products: Description of our efforts to reduce energy consumption of our products is reported under G4-EN-7. Details about options available to our customers for end life treatment of our products are given under G4-EN-27.
G4-EN5
ENERGY INTENSITY
|
GRI Indicator |
FY13 |
FY14 |
FY15 |
|
|
Energy Intensity Ratio |
42.8 kwh/sqft |
37
kwh/sqft |
37 kwh/sqft |
|
|
Kilowatt hour (kwh) |
|
2,47,818,362 |
129,171,983 |
|
|
Square feet (sqft) |
|
6,692,587 |
3,486,241 |
|
|
Metric Chosen to Calculate Ratio |
kWh/sqft is our Intensity Metrics and is arrived at by
dividing annual energy consumption by sites square footages |
|||
|
Types of Energy Included |
Electricity, Natural gas, propane |
|||
|
External Energy-Used Included |
No |
|||
G4-EN6
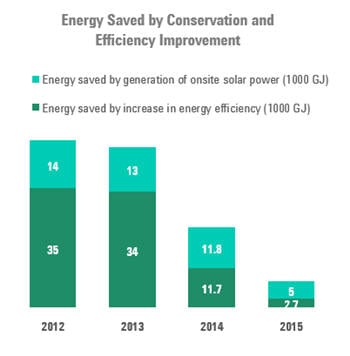
REDUCTION OF ENERGY CONSUMPTION
Total reduction in energy consumption for FY15 was 2,700 GJ. We focused on electricity and natural gas when calculating reduction in total energy consumption. For energy reduction calculation, Agilent only considers annualized energy efficiency improvements implemented in reporting fiscal year and not prior years. Annualized reductions are theoretical based on the predicted reduction in electricity usage as a direct result of energy saving projects in FY15.
G4-EN7
REDUCTION IN ENERGY REQUIREMENTS OF PRODUCTS AND
SERVICES
Agilent is working on improving the energy efficiency of selected products/product families including instruments with high energy consumption. Agilent has worked on assessing energy efficiency of several types of products by using customer feedback and metrics. By identifying energy efficiency features, we are able to increase energy efficacy of our products. Most of the energy savings achieved so far are based on to two key factors:
- The increased type and volume of tests that can be conducted, thus increasing tests per watt.
- Enhanced existing product features, thus bringing more measurement capabilities to the same product footprint.
Agilent's concentration on handheld and portable instruments places a focus on energy efficiency. Next-generation products are using key new technology that greatly improves performance per watt of power supplied. Agilent puts significant power management design efforts into its portable products to achieve power, heat, and battery life targets. Industry and regulatory requirements on the power supplies for our portable products have also increased power supply efficiency.
G4-EN8 TAL WATER WITHDRAWAL BY SOURCE
Total volume of water from water utilities (1,000 m3) = 358.8
Wastewater purchased from other organizations includes 52,950 m3 of "NEWater," purchased at the Singapore site which is reclaimed water produced by the local water board. It consists of wastewater that has gone through water-treatment processes including purification and UV technology. This amount is included in the "water withdrawn" totals below.
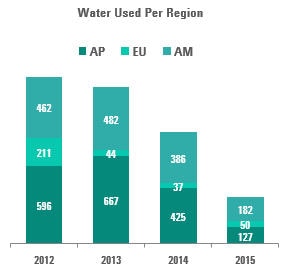
Water withdrawn from water utilities per region (1,000 m3):
- Asia Pacific - 127
- Europe - 50
- USA - 182
|
|
AP |
EU |
AM |
Total |
|
|
2012 |
596 |
211 |
462 |
1,269 |
|
|
2013 |
667 |
44 |
482 |
1,194 |
|
|
2014 |
425 |
37 |
386 |
848 |
|
|
2015 |
127 |
50 |
182 |
359 |
|
G4-EN9
WATER SOURCES SIGNIFICANTLY AFFECTED BY
WITHDRAWAL OF WATER
Most of our manufacturing site water comes directly from the city water supply. However, the following sites draw some water from the local aquifer: Manesar (India); Torino (Italy). Of those sites, Manesar withdrew about 11,000 cubic meters and Torino withdrew about 160,000 cubic meters in FY15, making this a global total groundwater withdrawal of about 171,000 cubic meters.
G4-EN10
PERCENTAGE AND TOTAL VOLUME OF WATER RECYCLED
AND REUSED
No significant water recycling has been noted for FY15.
The only site that currently uses recycled water is Santa Rosa, USA, (now Keysight) which has an onsite wastewater treatment facility. During the FY14 reporting period, the Santa Rosa site recycled 56.79 (1,000 m3) water.
G4-EN11
OPERATIONAL SITES OWNED, LEASED, MANAGED IN, OR
ADJACENT TO, PROTECTED AREAS AND AREAS OF HIGH BIODIVERSITY VALUE
OUTSIDE PROTECTED AREAS
Not applicable. Agilent manufacturing sites are not located in protected areas or areas of high biodiversity value.
G4-EN12
DESCRIPTION OF SIGNIFICANT IMPACTS OF
ACTIVITIES, PRODUCTS, AND SERVICES ON BIODIVERSITY IN PROTECTED AREAS
AND AREAS OF HIGH BIODIVERSITY VALUE OUTSIDE PROTECTED AREAS
Not applicable. Agilent manufacturing sites are not located in protected areas or areas of high biodiversity value.
G4-EN13
HABITATS PROTECTED OR RESTORED
Not applicable. Agilent manufacturing sites are not located in habitat-protected areas or restored areas.
G4-EN14
TOTAL NUMBER OF IUCN RED LIST SPECIES AND
NATIONAL CONSERVATION LIST SPECIES WITH HABITATS IN AREAS AFFECTED BY
OPERATIONS, BY LEVEL OF EXTINCTION RISK CO2
Not applicable. Agilent manufacturing sites are not located in habitat-protected areas or restored areas.
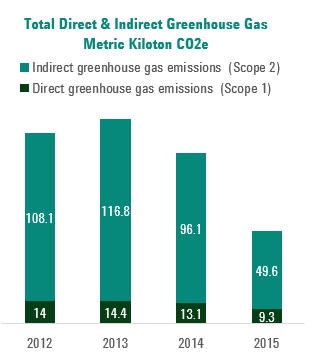
G4-EN15
TOTAL DIRECT GREENHOUSE GAS EMISSIONS BY WEIGHT
|
GRI Indicator |
FY15 Agilent Data |
|
Indicate the standard used, and indicate the methodology
associated with the data with reference to: direct
measurement; calculation based on site specific data;
calculation based on default data; estimations. |
Refer to EN3 notes |
|
Total Direct (Scope 1) greenhouse gas emissions in metric tons
of CO2 equivalent. |
9,321 |
|
Worldwide (Metric Kilotons
CO2e) |
2012 |
2013 |
2014 |
2015 |
|
Direct Greenhouse Gas Emissions (Scope 1) |
14.0 |
14.4 |
13.1 |
9.3 |
|
Indirect Greenhouse Gas Emissions (Scope 2) |
108.1 |
116.8 |
96.1 |
49.6 |
|
Total Greenhouse Gas Emissions |
122.1 |
131.1 |
109.2 |
58.9 |
G4-EN16
ENERGY INDIRECT GREENHOUSE GAS (GHG) EMISSIONS (SCOPE 2)
|
GRI Indicator |
FY15 Agilent Data |
|
Indicate the standard used, and indicate the methodology
associated with the data with reference to: direct
measurement; calculation based on site specific data;
calculation based on default data; estimations. |
Refer to EN3 notes |
|
Total Scope 2 greenhouse gas emissions in metric tons of
CO2
equivalent. |
49,644 |
G4-EN17
OTHER RELEVANT INDIRECT GREENHOUSE GAS EMISSIONS BY WEIGHT
(SCOPE 3)
|
GRI Indicator |
FY13 |
FY14 |
FY15 |
|
Scope 3 emissions from U.S. Fleet program identified in metric
tons of
CO2 |
9,078 |
8,801 |
6,862 |
|
Scope 3 Emissions from Agilent employee business travel
identified in metric tons of
CO2
equivalent |
38,979 |
33,788 |
21,131 |
|
Scope 3 Emissions
|
- |
15,829 |
|
|
Scope 1 & Scope 2 emissions metric tons of
CO2
equivalent |
116,755 |
109,279 |
58,965 |
|
Employee Fleet |
FY13 |
FY14 |
FY15 |
|
For Business |
1,084 |
1,134 |
840 |
|
For Business (Pool |
49 |
47 |
12 |
|
For Personal |
0 |
0 |
0 |
|
TOTAL |
1,133 |
1,181 |
852 |
G4-EN18
GREENHOUSE GAS EMISSIONS INTENSITY
|
GRI Indicator |
FY14 |
FY15 |
Description |
|
Greenhouse gas emission intensity ratio |
0.0133 mt/sqft |
0.0169 |
Metric Tons per site square footage |
|
Metric chosen to calculate ratio |
Metric Tons per site square footage |
Metric Tons per site square footage |
Metric Tons per site square footage is our intensity metrics
and is arrived at by dividing total greenhouse gases emission
by sites square footages |
|
Types of GHG emission included |
Scope 1 and Scope 2 |
Scope 1 and Scope 2 |
Scope 1 and Scope 2 |
G4-EN19
REDUCTION OF GREENHOUSE GAS EMISSIONS
|
GRI Indicators |
Agilent Data |
|
Initiatives to reduce greenhouse gas emissions, including the
areas where the initiatives were implemented. |
20 energy conservation projects Globally 3 on-site solar PV
systems |
|
The extent of greenhouse gas emissions reductions achieved
during the reporting period as a direct result of the
initiative(s) in tons of CO2 equivalent. |
720 |
|
Reductions in GHG emissions by direct (Scope 1), energy
indirect (Scope 2), other indirect (Scope 3) emissions. |
250 MT: CO2e
avoided (MT) from Electricity (Scope 2) |
G4-EN20
EMISSIONS OF OZONE-DEPLETING SUBSTANCES
Agilent does not use, produce, import, or export Ozone Depleting Substances (ODS) prohibited under the Montreal Protocol on Substances that Deplete the Ozone Layer.
Agilent eliminated chlorofluorocarbons (CFCs), carbon tetrachloride, and 1,1,1-trichloroethane use in worldwide manufacturing processes in 1993. Agilent has also eliminated Class I ODSs in its air conditioning systems, process chillers and environmental chambers. ODSs are banned from Agilent products. There are no Agilent products that need the ODS labeling required by 42 U.S.C. 7671j (b), (c), and (d) and 40 CFR Part 82, Subpart E.
Procurement practices are in place to prevent the inadvertent reintroduction of ODSs into processes where they have been eliminated. Agilent also has a program to conserve, recycle and prevent emissions of Class I ODSs and Class II ODSs used in Agilent-owned equipment in its facilities worldwide.
G4-EN21
NOX, SOX, AND OTHER SIGNIFICANT AIR EMISSIONS BY TYPE
AND WEIGHT
Agilent has only started to report direct NOx emissions in FY15. Total NOx emissions in FY15 was 1262 MT. We do not track SOx, Hazardous air pollutants (HAP), Volatile organic compound (VOC) emissions.
G4-EN22
TOTAL WATER DISCHARGE BY QUALITY AND DESTINATION
Water discharge is not tracked separately and is almost directly linked to the site water consumption. Some sites do have small waste treatment facilities where waste water is discharged and subject to strict compliance expectations. More concentrated aqueous wastes are collected separately and disposed appropriately as hazardous wastes.
G4-EN23
TOTAL WEIGHT OF WASTE BY TYPE AND DISPOSAL METHOD
The data is based on fiscal year (November 2014 - October 2015) and include both solid and hazardous waste. Agilent's solid waste diversion for FY15 was 87%. This exceeded the company-wide solid waste diversion for FY14 by 5%. Waste data is also attested by independent third party Trucost. Attestation statement is available in section G4-33 on page 27.
Hazardous Waste -- There was no target for hazardous waste. However, in FY15, 50% of hazardous waste was treated, 10% was incinerated, 39% was recycled, and only 1% was landfilled.
Notes:
- Total waste produced is calculated by adding total chemical waste and total solid waste tonnage. Total waste calculated based on fiscal year (November 2014 - October 2015).
- Chemical waste refers to chemical materials designated for final disposition that exhibit characteristics that are hazardous or dangerous per local regulatory requirements. This refers to materials that are shipped offsite for treatment, recycling, incineration, and landfill; and excludes electronic waste.
- Solid waste refers to waste that is not included in chemical waste or excess electronic equipment (e.g., garbage/trash, paper, cardboard, glass, and furniture and construction debris).