Quality control of high-purity titanium
Challenging matrix
High-purity titanium—typically defined as Ti metal with 99.99% purity or higher—is essential for high-tech applications where even trace contaminants can compromise performance. In semiconductor manufacturing, impurities in Ti sputtering targets can disrupt thin-film uniformity, electrical properties, and device reliability. Similarly, contaminants in aerospace-grade Ti components can weaken mechanical strength and long-term durability.
Purity specifications therefore focus on controlling metallic impurities (for example, Mg, Cr, Fe, Ni, Cu, Zn) at or below the 1 mg/kg (ppm) level, requiring a highly sensitive technique such as ICP-MS. Achieving this level of purity demands sub ppm detection of impurities in the original sample—yet Ti²⁺, TiO⁺, and Ti-hydride spectral interferences make accurate measurement of analytes such as Na, Mg, Cu, Zn, and V particularly challenging by ICP-MS.
The Agilent 9500 ICP-QQQ overcomes these obstacles with its MS/MS configuration, Dual-Cell System, and optional m-lens, delivering exceptional interference removal, ultralow backgrounds, and stable long-term performance. In a recent study we used the 9500 ICP-QQQ to quantify trace impurities in a 200 ppm Ti matrix, evaluating its suitability for stringent purity control in high-tech applications.
Experimental
Instrumentation
The 9500 ICP-QQQ fitted with the optional m-lens and the Agilent I-AS autosampler were controlled using Agilent OpenLab ICP-MS software version 1.1. The sample introduction system comprised a MicroFlow PFA nebulizer with I-AS probe (operated in self-aspiration mode), a temperature-controlled quartz spray chamber, and a quartz torch with a 2.5 mm inner diameter injector. Since HF was used during sample preparation, a platinum-tipped sampler cone with copper base and a platinum-tipped skimmer cone with nickel base for m-lens were used.
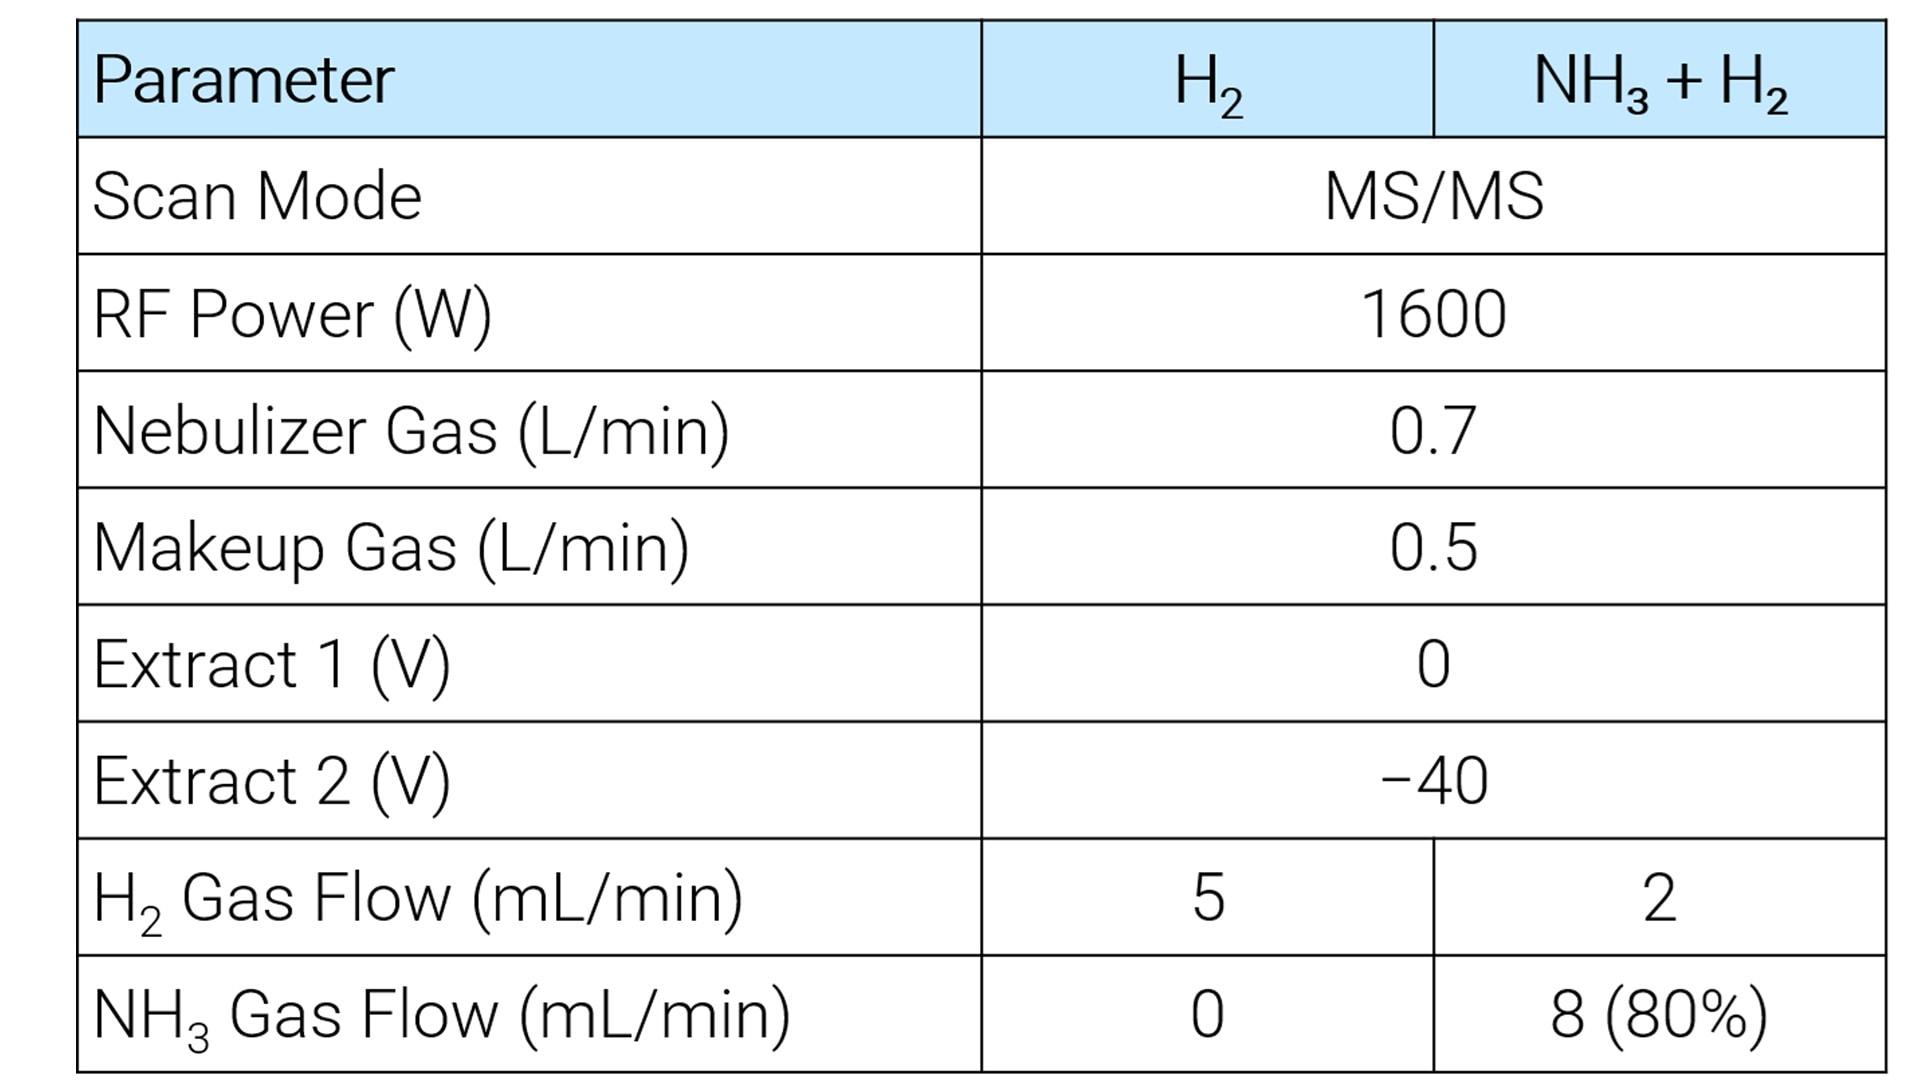
To simplify the tuning process and method, only two cell conditions were applied: H2 and NH3 mixed with H2. Introduction of H2 and NH3 (10% NH3 balanced with 90% He) gases into the DCS enables the removal of argon (Ar)- and Ti-based interferences through selective ion–molecule reactions. The makeup gas was adjusted to achieve a CeO/Ce ratio of approximately 0.8% in no gas mode, and other plasma and lens parameters were optimized for low background levels and high stability (Table 1).
Sample and standard preparation
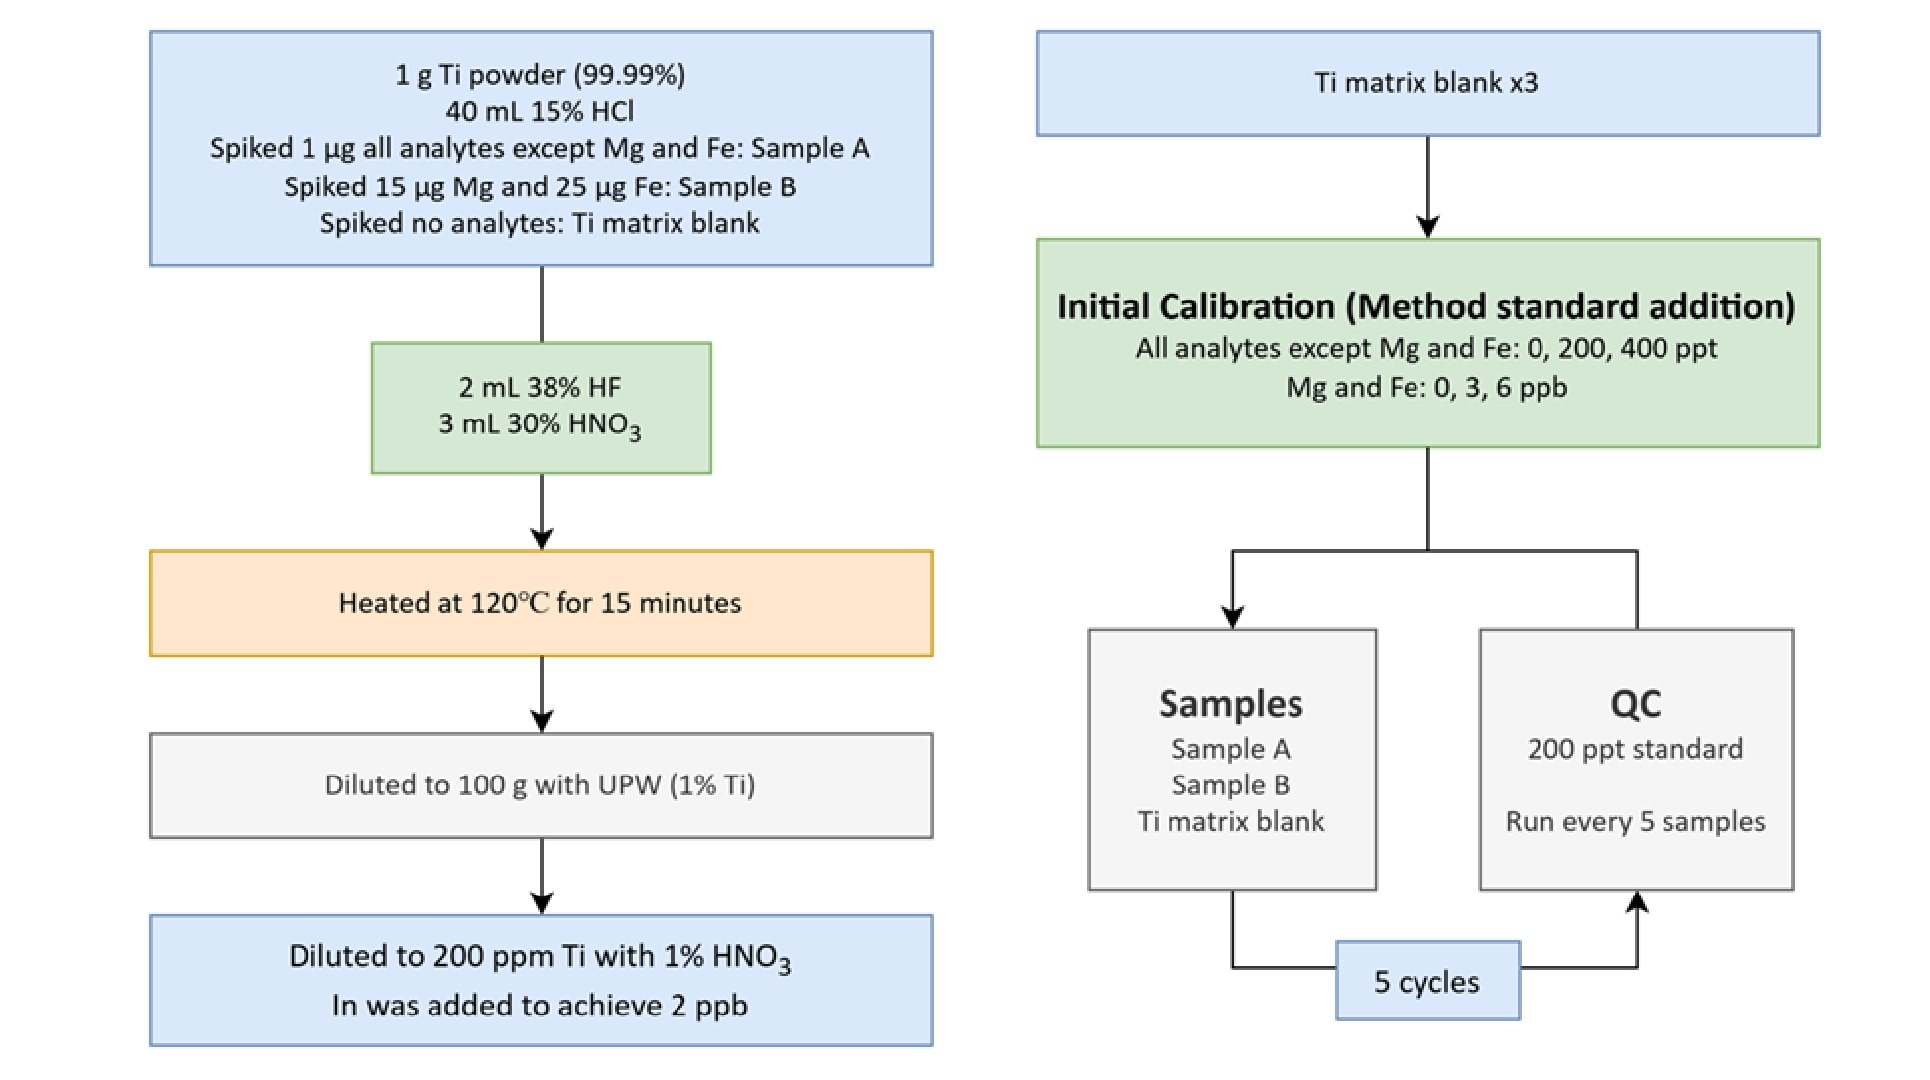
A high-purity titanium powder (99.99%, < 100 mesh) was bought from FUJIFILM Wako Pure Chemical, Japan. It was digested in high purity acids in accordance with ASTM E2371-21a guidelines. Three samples were prepared for the study:
- Ti matrix sample: A 200 ppm Ti solution without any spiked elements.
- Sample A: A 200 ppm Ti solution spiked with all target analytes except Mg and Fe before digestion.
- Sample B: A 200 ppm Ti solution spiked exclusively with Mg and Fe before digestion.
Calibration curves were prepared by spiking the 200 ppm Ti solution with standard solutions. A QC sample was prepared by spiking the Ti matrix sample at 200 ng/kg (ppt) with the standard solution.
A summary of the workflow is shown in Figure 1.
Results and discussion
Quantification of impurity metals
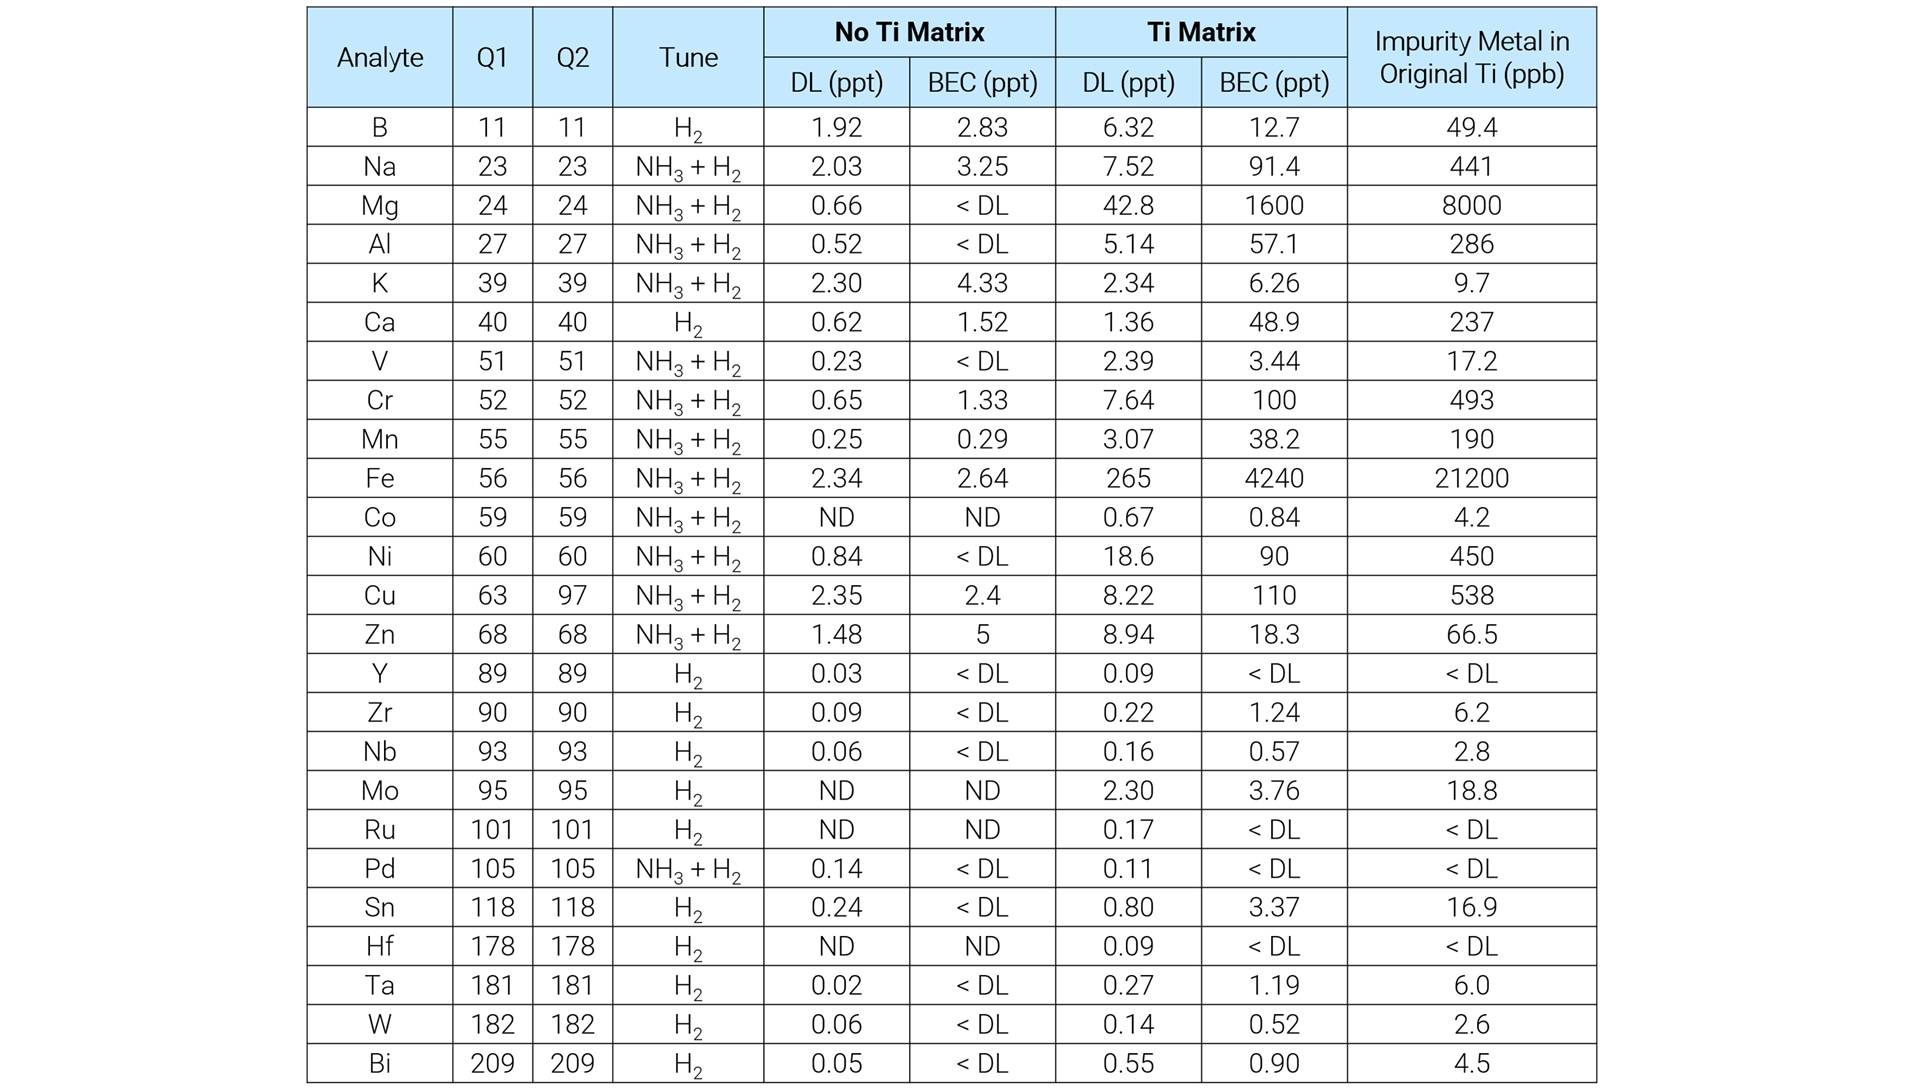
Quantitative results of 25 elements in the 200 ppm high-purity Ti solution are shown in Table 2. By subtracting the BECs of the procedural blank from the Ti matrix BECs, the total metal concentration was calculated as 31 ppm, based on the summed elemental contributions. The combined concentration of major metal impurities was verified to be below 0.01%, consistent with the material's specified purity (> 99.99%).
Spike recovery accuracy test
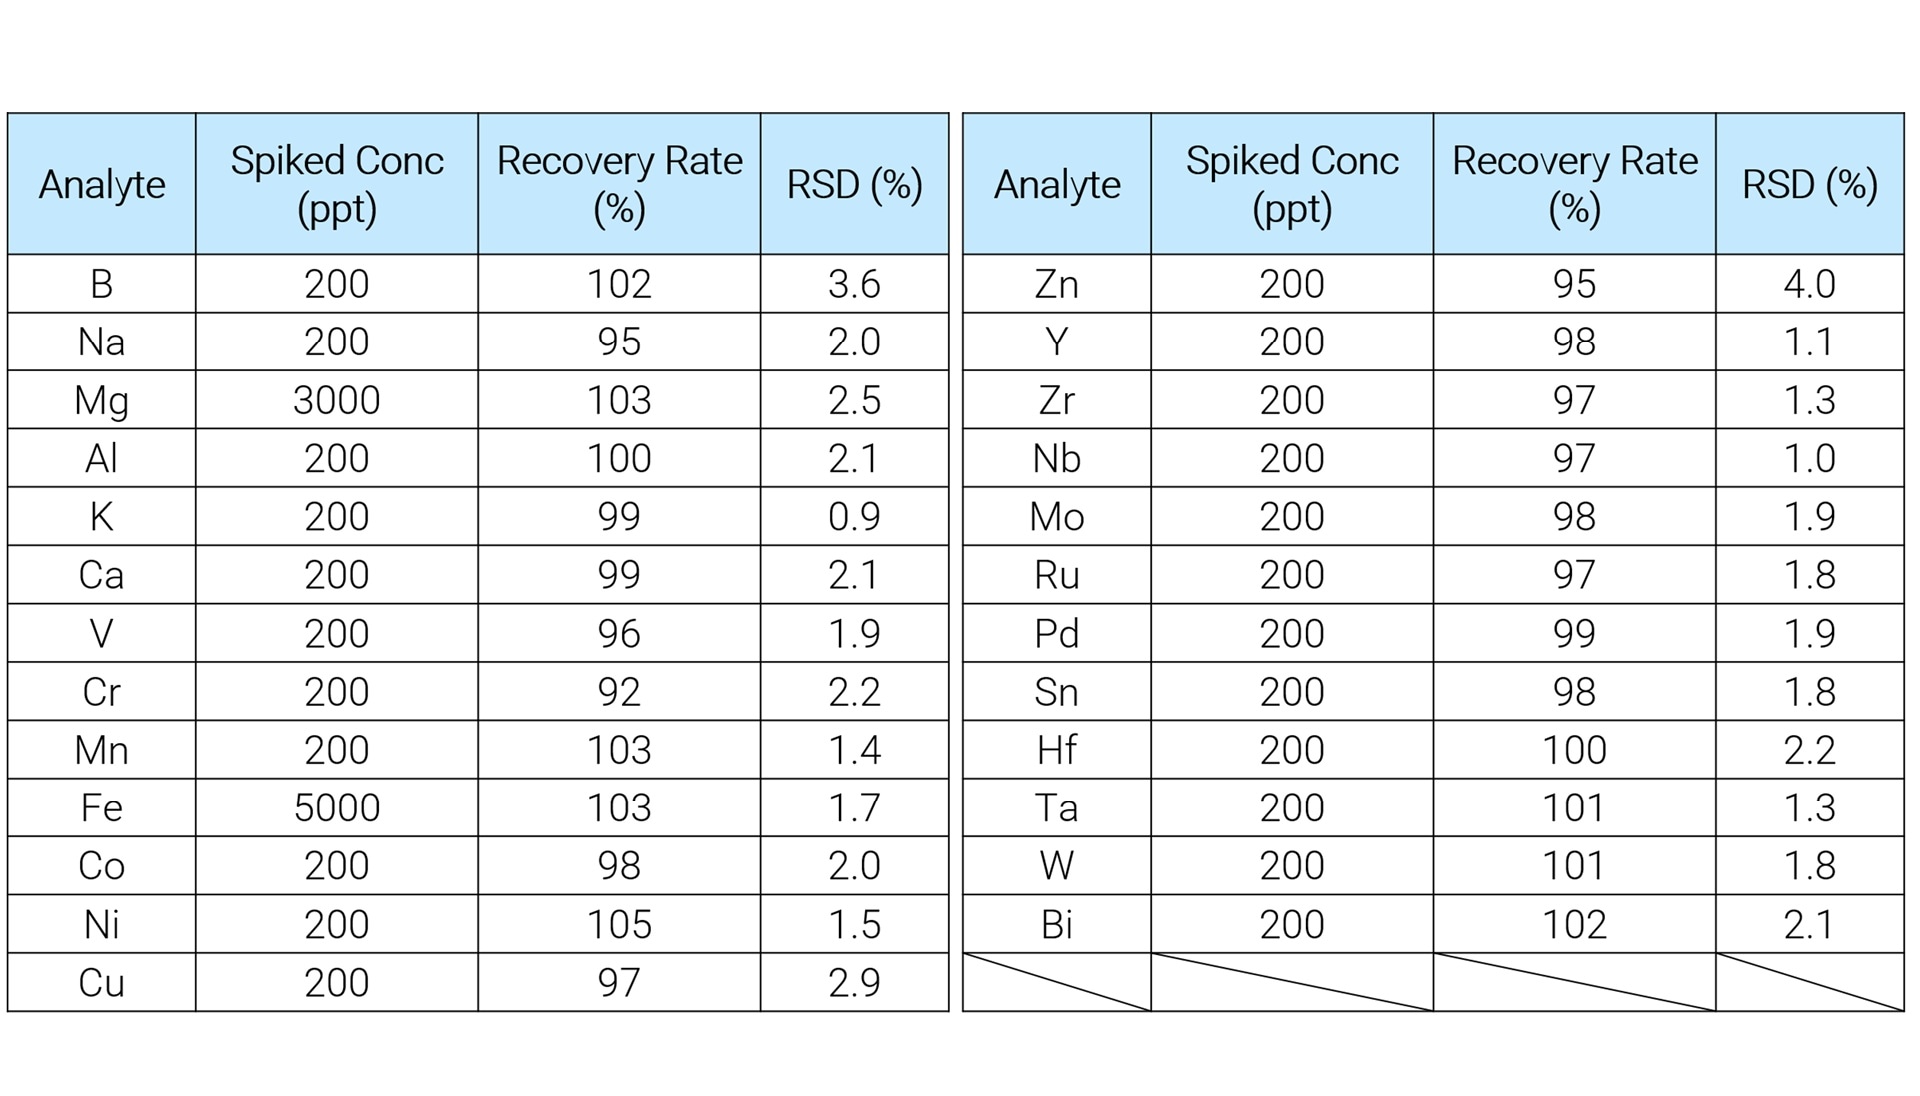
Ti powder was spiked before digestion with 1 μg per 1 g (1 ppm) of the original Ti sample, except for Mg and Fe. They were spiked at 15 μg (15 ppm) and 25 μg (25 ppm), respectively. Since a 200 ppm Ti digested solution diluted 5000-fold was introduced to the 9500 ICP-QQQ, the actual quantified concentrations were 200 ppt for all elements except Mg (3000 ppt) and Fe (5000 ppt). Table 3 shows the spike recovery results. All elements achieved recovery rates within ±10%, with relative standard deviation (RSD) values mostly between 1–3% and all less than 5%.
Stability test
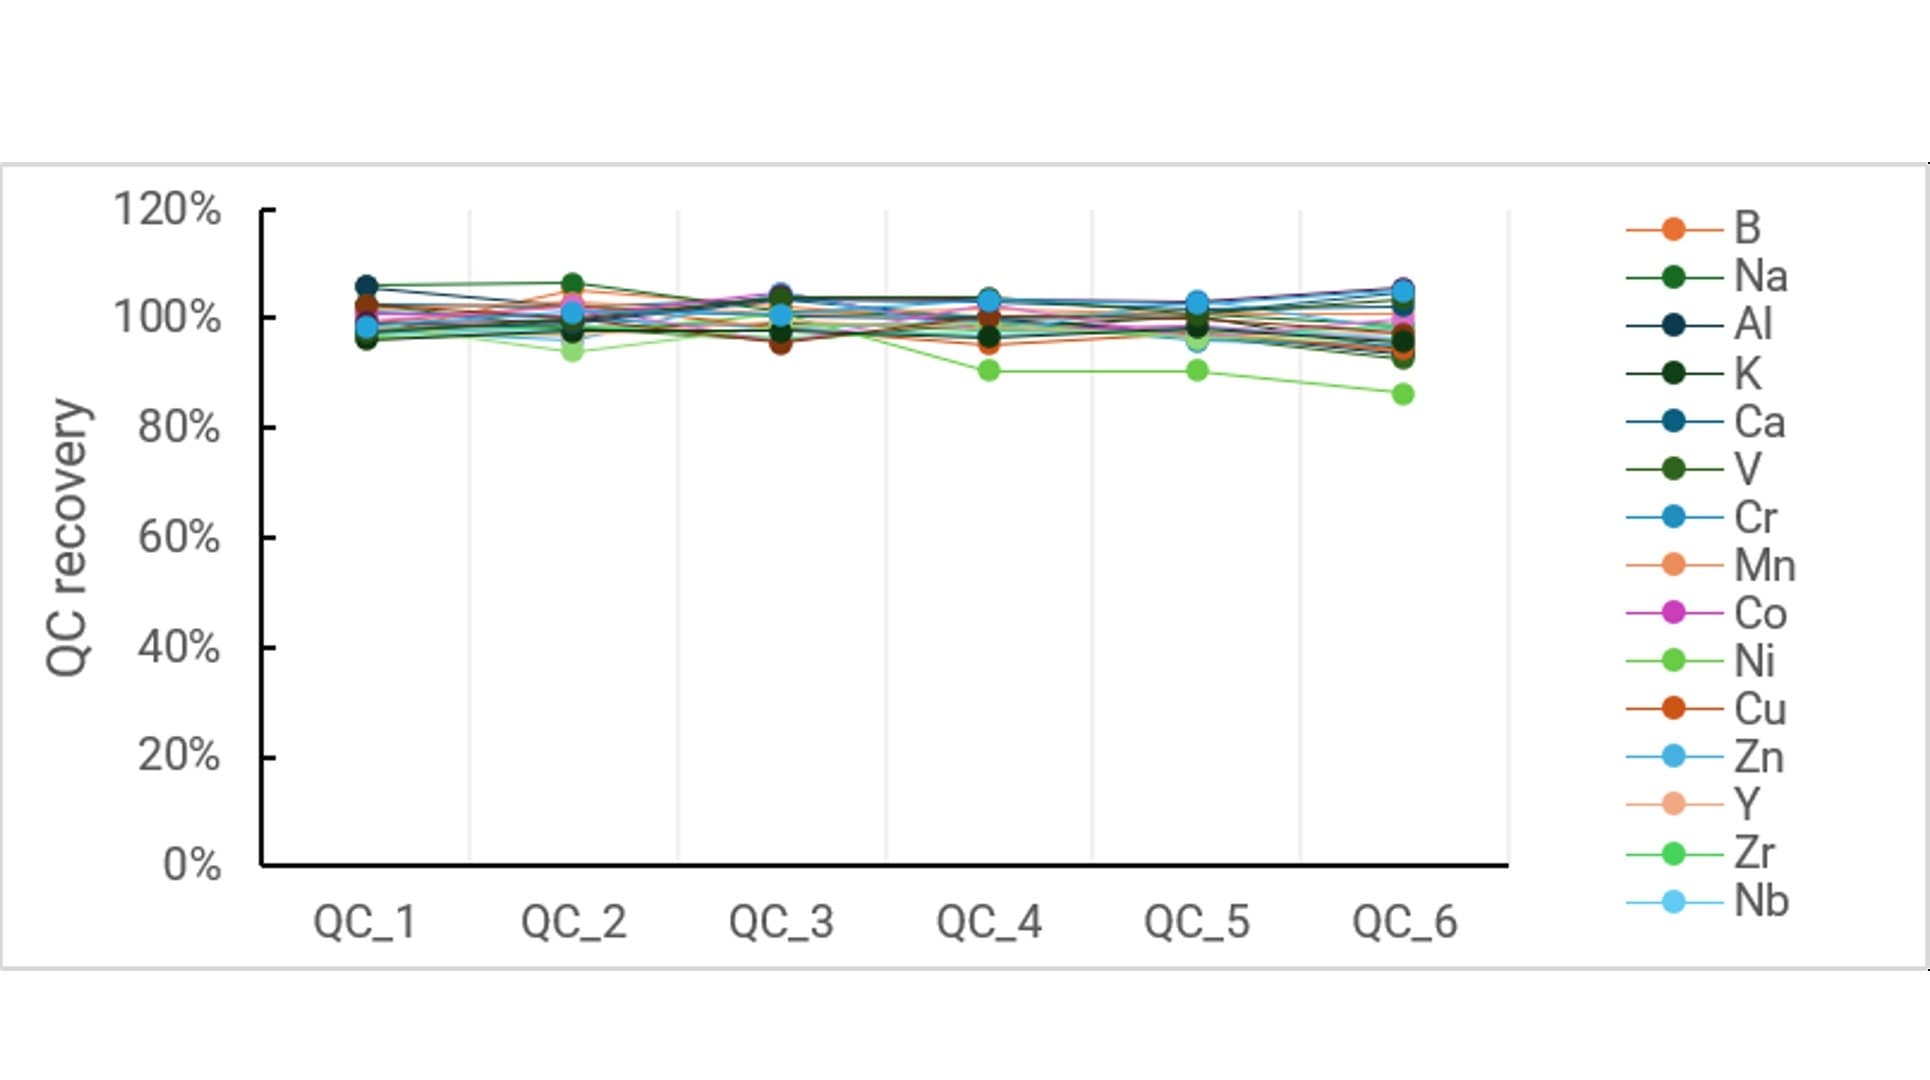
Figure 2 shows the recovery rates of the QC sample, which was measured six times during the analytical sequence. Most elements were recovered within ±10%, and all elements were recovered within ±20%. The results confirm the stability, robustness, and matrix tolerance of the 9500 ICP-QQQ for the continual measurement of Ti matrix samples over several hours.
Robust and reliable tool for QC of high-purity titanium
The study has highlighted the flexibility of the Agilent 9500 ICP-QQQ with m-lens as a robust and reliable tool for quality control of high-purity titanium. Optimized reaction gas conditions and MS/MS control effectively removed Ti²⁺, TiO⁺, and Ti-hydride interferences, enabling sub-ppm quantification of 25 elements in the undiluted Ti digestion solution. Spike recovery tests showed high accuracy and excellent reproducibility and stability results confirmed the system’s robustness and suitability for stringent quality control applications.
More information
Yamashita, Rentaro, Analysis of High Purity Titanium Using an Agilent 9500 ICP-QQQ, Agilent publication, 5994-9024EN
DE-015930