Access Agilent eNewsletter February 2015
>> Update My Profile | Subscribe to Access Agilent | Article Directory
Quick, easy tips to improve GPC results with calibration standards
By Stephen Luke
Agilent LC Columns Product Manager
Calibrating GPC/SEC column sets using narrow molecular weight standards is a common technique to determine the molecular weight distribution of samples. Rethinking how and when to use standards in GPC applications can yield significant improvements in accuracy and reliability of results. Other benefits include improved reproducibility, earlier detection of problems, and reduced trouble-shooting and system downtime.
Here are some quick, easy tips for using the calibration curve to improve the quality of your GPC test results.
Choose the right standards for the application
Your choice of calibration standards is dependent upon the solvent. Four common standards have universal appeal and typically cover most applications (Table 1).
To reduce extrapolation errors during molecular weight calculations, standards should ideally cover the entire resolving range of the column. By calibrating the full range of the column, reproducibility increases when comparing calibrations and unknown samples over time.
Eluent Type |
Solvent |
Standard |
|---|---|---|
Organic |
Tetrahydrofuran (THF), chloroform, toluene |
Polystyrene (alternatively polymethylmethacrylates) |
Polar organic or organic/water mixtures |
Dimethylformamide (DMF), N-methyl-2-pyrolidone (NMP) |
Polyethylene glycols/oxides (alternatively polymethylmethacrylates) |
Aqueous |
Water |
Polyethylene glycols/oxides |
Table 1. GPC/SEC solvents and calibration standards.
Proper preparation ensures accuracy
 Enlarge
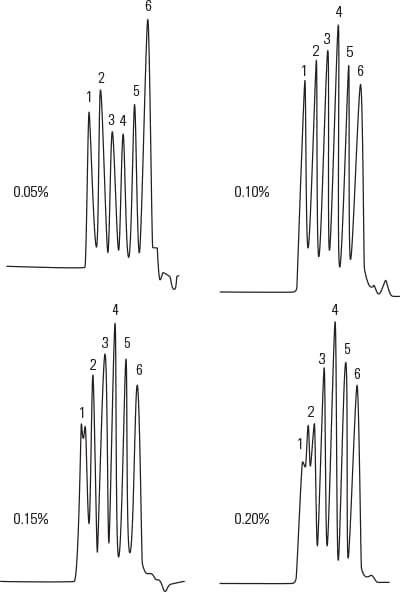
Figure 1. Impact of standard concentration on peak shape and resolution.
Calibration standards must be correctly prepared to avoid spurious peak shapes, inaccurate calibration curves, and potential blockages. You do not need to filter the standard solutions, provided they are fully dissolved in particulate free mobile phase. Do not vortex, sonicate, or shake standard solutions, as high-shear activities can change molecular weight.
The concentration of standard solutions is critical – too high and you have reduced mass transfer and increased band broadening – too low and the signal-to-noise ratio is too small to measure peaks reproducibly. In Figure 1, we see the effects of using different concentrations of standards. As shown below in Table 2, optimal concentration for all polymer solutions depends on the MW of the standard/sample.
Molecular weight (g/mol) |
Concentration (weight to volume) |
|---|---|
<5,000 |
<1.0 |
5,000 to 25,000 |
<0.5 |
200 to 400,000 |
<0.25 |
200 to 2,000,000 |
<0.20 |
10,000,000 |
<0.05 |
Table 2. Standard molecular weight and corresponding concentration.
To ensure solubility and avoid spurious peaks, dissolve your standards in an aliquot of the mobile phase. Higher MW standards take longer to dissolve fully and some solvent/standards need heating. Keep the temperature 10 °C below the boiling point of the solvent and avoid thermal degradation in the form of tailing peaks.
Here’s a tip – pre-prepared standards such as Agilent EasiVial and Agilent EasiCal make preparation easier and reduce errors. To simplify the effects of concentration, preweighed prepared kits are also available.
The right number of standards delivers successful calibration
Calibration curves typically have 10 to 12 data points, and is accepted as sufficient to provide an accurate polynomial regression. If you cannot calibrate the full molecular weight range of your columns, use a linear extended range column such as Agilent PLgel MIXED. You can inject a cocktail of MW standards, consisting of three to four standards each, to eliminate the analysis time required for 12 data points. Baseline separation of all components assures the most reproducible results.
Regular, scheduled development of new standards is important
It is good practice to make up new standards on a weekly basis. Store PEOs and PEGs in a refrigerator, but bring to ambient temperature before use.
Molecular weight standards optimize the system
GPC molecular weight standards have a narrow polydispersity and so they help you accomplish many statistical measurements, such as band broadening, efficiency, peak symmetry, resolution factor, and specific resolution per MW decade.
Even a simple calibration overlay before and after a sample provides greater confidence in results and alerts you if the system is inconsistent. Incorporating any of these measurements into a standard operating procedure dramatically increases the relative standard deviation of results over time and reduces instrument downtime.
Frequent calibration increases data confidence
For continuous work, calibrate daily. Weekly calibration is sufficient with internal verification. Whenever you change any component of the GPC system or the eluent – recalibrate. To guarantee optimum performance, we suggest performing bracketing calibrations for every column set to increase data confidence. GPC systems are finite, with multiple components that degrade over time. Instrument issues – such as blocked filters, blocked check valves, leaking injector seals, and leaking or blocked connectors – can affect the calibration. In addition, any degradation to the column such as blocked or partially blocked frits, or a buildup of contamination that leads to performance reduction with age, also have significant effects.
Paying attention to regular column calibration helps you achieve the best GPC results from your instruments and columns. Read more tips in the complimentary Calibrating GPC Columns – A Guide to Best Practice.
Agilent GPC/SEC solutions for all your polymer analysis needs
Discover the clear advantage of Agilent GPC/SEC columns, standards, and instruments for the analysis of your polymers. Explore our new and informative GPC wall chart – Achieve more with the polymer analysis people. Order your free copy today, then download a copy of the new Fast GPC flyer, as well.
>> Update My Profile | Subscribe to Access Agilent | Article Directory