Access Agilent eNewsletter April 2015
>> Update My Profile | Subscribe to Access Agilent | Article Directory
Single Particle ICP-MS dedicated software improves characterization of nanoparticles
By Michiko Yamanaka and Kazuo Yamanaka
Agilent Applications Engineers
Takayuki Itagaki
Agilent Software R&D Engineer
Steve Wilbur
Agilent Software Product Manager, ICP-MS Systems
Ed McCurdy
Agilent ICP-MS Product Marketing
Advances in nanotechnology are forecast to have a major impact on a broad range of industry segments. Because of the novel physical and chemical characteristics of nanoparticles (NPs), much remains unknown of their environmental fate and toxicological properties. As a result, there is a growing need for a rapid, accurate, sensitive technique for characterizing and quantifying NPs in a wide range of sample types. ICP-MS can be used to measure individual NPs using a technique called single particle ICP-MS (sp-ICP-MS). This approach allows simultaneous determination of NP size, size distribution, elemental composition, and number concentration in a single, rapid analysis. Enhancements to ICP-MS hardware and software have further improved this technique.
A winning combination: Dedicated software and short dwell times
Agilent has developed a dedicated Single Nanoparticle Application Module for ICP-MS MassHunter software to simplify sp-ICP-MS analysis using the Agilent 7900 ICP-MS. The 7900 ICP-MS uses short dwell times (below 1 ms) and fast time resolved analysis (TRA) mode, permitting single element acquisition at a sampling rate as fast as 100 µs with no settling time. The capability to make several separate measurements during the signal pulse from a single particle significantly reduces the risk of overlapping signals from multiple particles. Another advantage is the option to use a lower sample dilution and shorter sample acquisition time.
Successfully characterize gold and silver NP standard reference materials
Measurements of two gold (Au) NP standard reference materials (NIST 8012 and NIST 8013), certified at 30 and 60 nm respectively, and silver (Ag) NP samples (Sigma-Aldrich) at 20 nm, 40 nm, 60 nm, and 100 nm were performed using the MassHunter Single Nanoparticle Application Module of the Agilent 7900 ICP-MS (Figure 1). All reference materials and samples were diluted to between 50 and 1000 ng/L with 10% ethanol in deionized water, and sonicated to ensure sample homogeneity. The general settings of the Agilent 7900 ICP-MS are detailed in Table 1.
 Enlarge
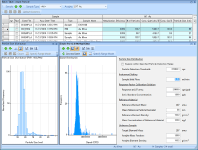
Figure 1. Single particle final batch results are automatically reported both in tabular and graphical format. Users can scroll through the samples in the batch table and review individual graphical results. Powerful manual optimization tools are also available if required.
 Enlarge
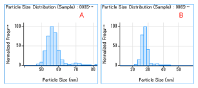
Figure 2. Particle size distribution for Au NPs. A) NIST 8013 (nominal 60 nm). B) NIST 8012 (nominal 30 nm).
 Enlarge
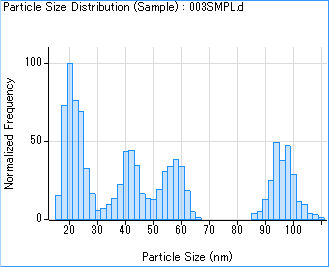
Figure 3. Size distribution results of a mixture of 20, 40, 60, 100 nm Ag NPs.
Parameter |
Value |
|---|---|
RF power |
1550 W |
Sampling depth |
7 mm |
Carrier gas |
0.76 L/min |
Sample uptake rate |
0.35 mL/min |
Spray chamber temp. |
2 °C |
Dwell time |
0.1 ms |
Table 1. General settings of the Agilent 7900 ICP-MS.
Analysis of Au NPs
The measured concentration for the analysis of the Au NPs in the standard reference materials showed good agreement with the nominal concentrations (Table 2). Also, the measured particle sizes (Figure 2) agreed with the Transmission Electron Microscopy (TEM) reference values.
Sample |
Measured Concentration (particles/L) |
Measured Concentration (ng/L) |
Measured Particle Size (nm) |
Reference Particle Size obtained by TEM (nm) |
|---|---|---|---|---|
NIST 8013 |
5.59 x 10⁷ |
103 |
55 |
56.0 ± 0.5 |
NIST 8012 |
4.27 x 10⁷ |
10.5 |
28 |
27.6 ± 2.1 |
Table 2. Results for the analysis of Au NPs.
Analysis of Ag NPs
The results for the analysis of different Ag NP sizes are shown in Figure 3. The 20 nm Ag NP can be measured due to the high sensitivity of the Agilent 7900 ICP-MS. The particle size distribution measured in the Ag NP mixture indicates good resolution between the 20 nm, 40 nm, 60 nm, and 100 nm particles.
Characterize NPs more easily with Agilent ICP-MS
Using the Agilent 7900 ICP-MS with dedicated sp-ICP-MS software is an excellent approach for determining and characterizing nanoparticles. This method provides a combination of particle size distribution and sample concentration information that is generally not available with other techniques.
To learn more, download the Agilent White Paper Characterization of nanoparticles in aqueous samples by ICP-MS, 5991-5516EN. Then check out our flyer Agilent’s Comprehensive Solutions for the analysis of nanoparticles by ICP-MS, 5991-5536EN.
Keep up-to-date with the Agilent ICP-MS Journal
Are you interested in trace metals analysis and eager to keep up-to-date with the latest developments in the field of ICP-MS? Then take a closer look at Agilent’s dedicated ICP-MS Journal. Published four times a year and available as a PDF, you can view the latest issue of the ICP-MS Journal, plus all previous issues, by visiting the ICP-MS Journal Archive. To receive your personal copy of the ICP-MS Journal sent direct to your inbox, please subscribe now.
>> Update My Profile | Subscribe to Access Agilent | Article Directory
Figure 1.
Single particle final batch results are automatically reported both in tabular and graphical format. Users can scroll through the samples in the batch table and review individual graphical results. Powerful manual optimization tools are also available if required.