Access Agilent eNewsletter August 2016

Quality-by-design (QbD) approach to method development delivers robust peptide mapping method in far less time
Sreelakshmy Menon and Suresh Babu C.V.
Agilent Application Scientists
Richard Verseput
S-Matrix Corporation President
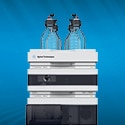
Peptide mapping is one of the most common identity tests for proteins, and with the right tools, development of a robust method proceeds much more quickly. Analysts typically use reverse-phase liquid chromatography with UV detection for peptide mapping in quality control. One of the major challenges in the traditional LC method development process is the amount of time consumed with screening the various chromatographic parameters using a one-factor-at-a-time approach. In this article, we demonstrate a much faster quality-by-design (QbD) approach that uses an Agilent 1260 Infinity Bio-Inert Quaternary LC with Fusion QbD method development software. We used these tools to develop a robust method for a tryptic digest of a monoclonal antibody (mAb).
Automated analyses produce a report that defines best LC conditions
In this study, the QbD workflow consisted of two phases: 1) screening and 2) method optimization. In each phase, for a defined set of variable inputs, the Fusion QbD software generated a statistical experimental design. It then exported the design to the Agilent OpenLAB CDS ChemStation Edition as ready-to-run sequences and methods, which were then run on an Agilent 1260 Infinity Bio-Inert Quaternary LC system. The software then imported and modeled the data from the chromatograms, and generated an automated report that identified the best conditions to meet the defined performance goals.
In the first phase, we screened column and solvent combinations using a generic gradient. [1] The goal was to identify the conditions according to the specified critical method parameters (CMPs) that maximized the number of separated peptide peaks. The screening results showed that the Agilent AdvanceBio Peptide Mapping column and acetonitrile were the best conditions to obtain the maximum number of peaks with tangent resolutions ≥ 1.5 and 2.
Software predicts robust final design space
The second phase, method optimization, the best conditions identified in the screening study were used. In this phase, we fine-tuned the method by further optimization of pump flow rate, gradient slope, additive concentration, and other factors. Then, the final optimized method was applied to create the design space.

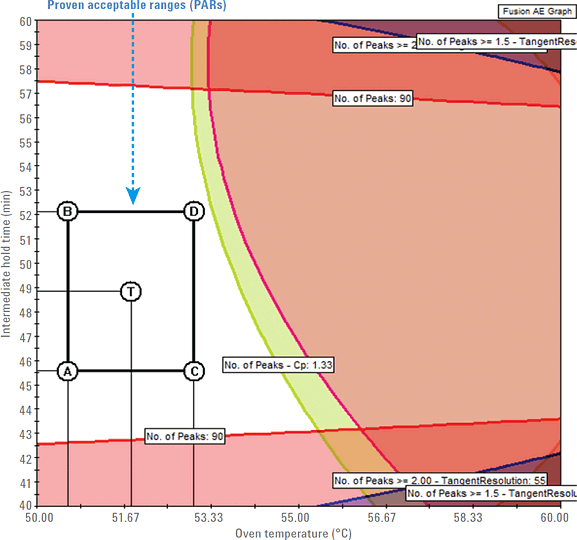
Figure 1. Design space (unshaded region) and PAR rectangle with four points A, B, C, D, and the center point T showing acceptable ranges for oven temperature and intermediate hold time.

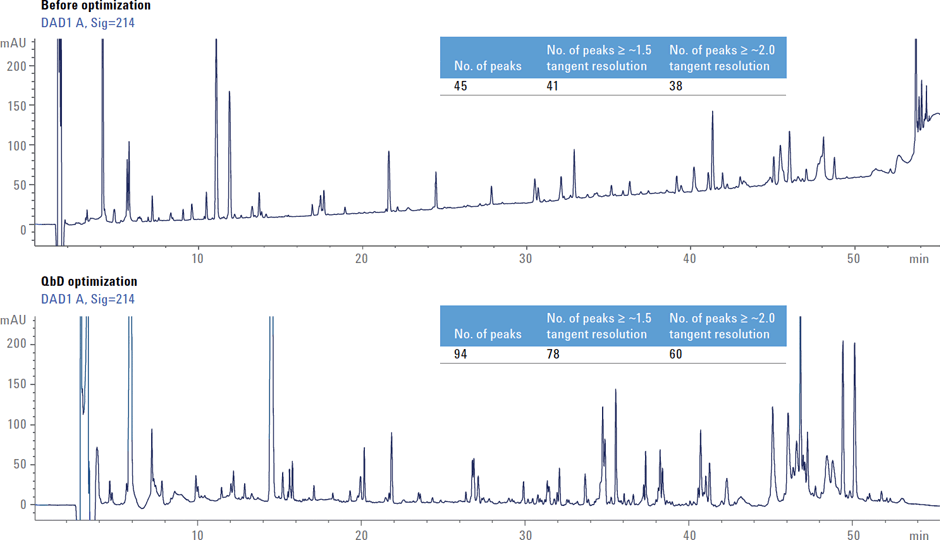
Figure 2. More resolved peaks: comparison of chromatograms obtained before and after QbD optimization, along with the resolution values.
The design space is the primary region predicted by the QbD software that defines the critical method attributes (CMAs) in terms of CMPs. To establish a robust final design space, it is important to quantify the robustness of all possible methods in the mean performance design space. To do this, you use the Fusion QbD method development software’s Robustness Simulator to characterize the independent and combined effects of the method parameters on the method variability. In predicting the final robust design space, the software generates graphs showing the combined effects of the study variables on the separation of the peptide mixture. Figure 1 shows an example graph created by the software. It displays the design space and proven acceptable ranges (PARs) that depict the robust region where you obtain the maximum number of peptide peaks.
Reduce effort with automated method export and execution
To confirm the optimized method, we used the Point Prediction feature in the Fusion QbD software to automatically export all of the verification methods from the PAR rectangle to Agilent OpenLAB for automated execution. After review of the point prediction studies, it was determined that all the values obtained were within the predicted range (± 2 sigma confidence limit). Replicate injections were performed to evaluate the method reproducibility, and calculated the percent relative standard deviation (%RSD) for five randomly selected peaks from the chromatogram. Full details are available in Agilent Application Note 5991-6338EN.
A comparison of the chromatograms obtained from the initial screening study and the chromatogram obtained from the final QbD-optimized method shows dramatic improvement in the number of well-resolved peptide peaks (Figure 2).
Huge time-savings
Our test results show that method development for peptide mapping using an Agilent 1260 Infinity Bio-Inert Quaternary LC combined with QbD principles saves significant time. The multivariate experimental design and analysis capabilities within the Fusion QbD software, in combination with Agilent OpenLAB CDS experiment automation technology, produced a robust final method for mAb peptide mapping in dramatically less time than manual method development.
To discover more about our QbD approach and method development, explore Agilent Application Note 5991-6338EN.
Reference
- J. Martosella, A. Zhu, N. Tang, “Fast and Efficient Peptide Mapping of a Monoclonal Antibody (mAb): UHPLC Performance with Superficially Porous Particles,” Agilent publication number 5991-3585EN.
For Research Use Only. Not for use in diagnostic procedures.
This information is subject to change without notice.
Stay informed about the applications that are important to you
Subscribe to Access Agilent
Our free customized
monthly eNewsletter
Article Directory – August 2016
All articles in this issue
-
 Best practices: Analysis of extractable and leachable impurities in pharmaceutical packaging components and beyond
 -
 Ask the Expert: How can I quickly and easily identify different lipid classes?
 -
 How a busy metabolomics lab in Montreal collects and shares data: Agilent OpenLAB ELN success story
 -
 Quality-by-design (QbD) approach to method development delivers robust peptide mapping method in far less time
 -
 High sensitivity analysis of silicon-based nanoparticles using new Agilent 8900 ICP-QQQ
 -
 PerkinElmer FAAS with Agilent consumables: Accurate determination of nutrients and mineral elements in water samples
Figure 1

Design space (unshaded region) and PAR rectangle with four points A, B, C, D, and the center point T showing acceptable ranges for oven temperature and intermediate hold time.
Figure 2

More resolved peaks: comparison of chromatograms obtained before and after QbD optimization, along with the resolution values.