Access Agilent eNewsletter August 2016

Best practices: Analysis of extractable and leachable impurities in pharmaceutical packaging components and beyond
Smriti Khera, Agilent Pharma Segment Marketing
Drug recalls have become more frequent in recent years and leached impurities have been responsible for many of them. In 2014, Food and Drug Administration (FDA) recalls increased to 836. Recalls affect patients, denying them access to approved medications and impose a significant financial cost on manufacturers.
To ensure safety and avoid such recalls, manufacturers of pharmaceuticals, drug delivery systems, and biomedical devices have come under growing pressure to perform sensitive and accurate analytical studies to detect, identify, and quantify extractable and leachable compounds (E&Ls). Agilent provides a wide range of instrumentation and software for this evolving field of investigation. This article provides an overview of the current best practices in the analysis of E&Ls.
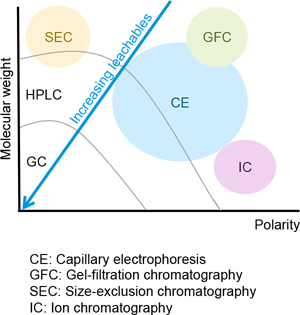
Figure 1. Types of analytes detectable with various analytical technologies.
Multiple analyses required for evaluation of extractables and leachables
The E&L analytical workflow and the method of detection depend on the physicochemical characteristics of the analytes. There is no universal analytical technique to detect the range of known and unknown organic and inorganic compounds that may be present at risk assessment threshold levels in an E&L study (Figure 1). Based on the volatility and thermal lability of E&L compounds, the most common analytical techniques are:
-
Non-volatiles: LC with a variety of detectors available. For high sensitivity detection or to determine structural identity, LC/MS is most commonly used.
- A targeted triple quadrupole approach such as LC/QQQ is preferred for sensitive quantitation.
- An untargeted methodology using a quadrupole time-of-flight (LC/Q-TOF) or other high-resolution system is used for structure identification.
- 2D LC or SFC can be utilized for challenging chromatographic separations.
- Volatiles: headspace GC/MS (GC/MS, GC/Q-TOF)
- Semi-volatiles: GC, GC/MS
- Elemental impurities: ICP/MS, ICP/OES, AA
- Spectroscopic techniques such as FTIR are also used.
Analytical innovations make it possible to identify more chemicals
LC/MS and GC/MS are the primary techniques used for E&L analysis, but several emerging technologies can improve analytical efficiency, resolve complex mixtures, or enhance sensitivity. Analytical technologies that may offer better performance for analysis of nonvolatile E&Ls include evaporative light scattering detection (ELSD), supercritical fluid chromatography (SFC), two-dimensional LC (2D-LC), and ion mobility MS.
Figure 2. Solving a difficult extraction with 2D UHPLC. Left shows complex first-dimension chromatograms, while right shows far simpler second dimension chromatograms.
Case study: 2D-LC solves a difficult separation problem
During method development for quantification of bisphenol A, a laboratory manager described the difficulty encountered in resolving the compound from background components using a UHPLC system (Figure 2A). He developed a 2D UHPLC methodology illustrated in Figure 2B, which included the use of a spiked extract and fluorescence detection.
Figure 2A shows the first-dimension chromatograms from the 2D UHPLC workflow. This analysis was performed using an Agilent 1290 Infinity LC System and an Agilent ZORBAX SB-C18 column with a water/acetonitrile gradient. The upper panel depicts 230 nm diode-array detection, while the lower shows 230 nm variable-wavelength detection. The heart-cut was taken between 2.18 to 2.22 minutes.
Figure 2B shows the second-dimension chromatograms from the 2D-LC workflow. This analysis was performed using an Agilent Eclipse Plus Phenyl-Hexyl column and water/acetonitrile isocratic mobile phase. The upper panel illustrates 230 nm diode-array detection, while the lower shows 225 nm excitation and 310 nm emission fluorescence detection.
Other techniques also have advantages
ELSD, a technique that complements LC/MS, has sensitivity in the low nanogram range and provides a more universal response for compounds without a chromophore. With sub-ambient evaporation at 10 °C, ELSD can enhance detection of semi-volatile compounds.
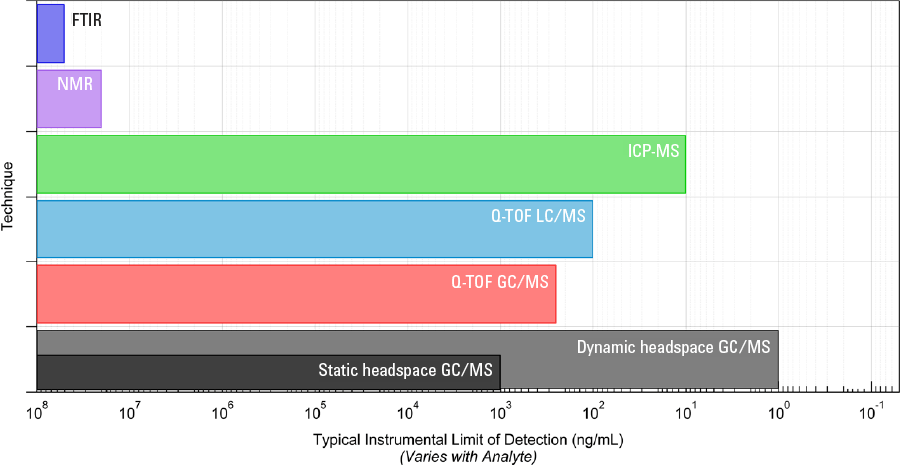
Figure 3. Range of techniques for detection of unknowns in qualitative analysis and their typical limits of detection.
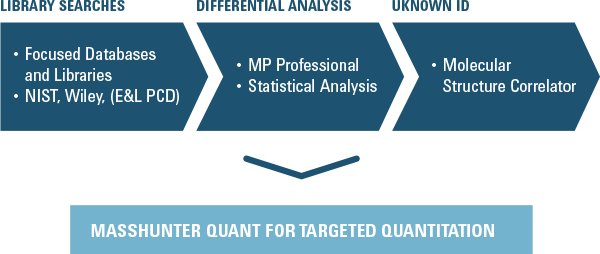
Figure 4. Qualitative analysis capabilities of Agilent MassHunter software.
One key advantage of SFC is speed of analysis, with separation two to five times faster than LC. Other benefits of SFC are the ability to switch elution order relative to reverse-phase HPLC, and the ability to couple a “normal-phase” separation with mass spectrometry. The Agilent 1260 Infinity Hybrid SFC/UHPLC System offers the flexibility to switch easily between SFC and UHPLC.
Advanced tools deliver chemical structure identification and differential analysis
The best approach for non-targeted identification of unknown compounds is use of GC (for volatiles) or LC (for non-volatiles) with TOF/Q-TOF to generate high resolution accurate mass MS and MS/MS spectra. Public or private databases can then be searched to obtain a match with a known reference standard. If an exact match, then high resolution accurate mass Q-TOF data enable elemental formula generation, software tools such as Agilent Molecular Structure Correlator can aid assignment of possible structures for the unknowns (Figure 4).
The addition of Agilent Mass Profiler Professional and Profinder to Agilent MassHunter Workstation software enables differential analysis through comparison of sample sets and identification of features that are either similar or different between multiple groups of samples. Differential analysis is extremely beneficial in the case of E&L studies, because each analyzed sample may contain hundreds of peaks. When comparing samples, differential analysis tools can increase efficiency of data processing. In an upcoming issue of Access Agilent, we will discuss in greater detail how differential analysis software is useful for the analysis of both LC/MS and GC/MS data for the rapid identification of E&Ls, as well as to observe qualitative and semi-quantitative differences between extractions or samples.
Want more details?
Laboratory professionals have responded overwhelmingly to Part 1 and Part 2 of a Chemical and Engineering News (C&EN) webinar series on analysis of extractables and leachables. They have also been enthusiastic about a C&EN whitepaper on the same topic. This whitepaper provides an overview of the current best practices in the analysis of E&Ls, including the basic principles of E&L analysis, how to design an E&L study, and a detailed look at workflows. Explore these valuable resources, then contact an Agilent representative for more information.
Acknowledgements
We would like to sincerely acknowledge Dr. Mark Jordi, President, Jordi Labs for his contributions to this piece. Figures 2 and 3 were contributed graciously by Dr. Mark Jordi and the experimental work reported herein was performed at Jordi Labs.
Stay informed about the applications that are important to you
Subscribe to Access Agilent
Our free customized
monthly eNewsletter
Article Directory – August 2016
All articles in this issue
-
 Best practices: Analysis of extractable and leachable impurities in pharmaceutical packaging components and beyond
 -
 Ask the Expert: How can I quickly and easily identify different lipid classes?
 -
 How a busy metabolomics lab in Montreal collects and shares data: Agilent OpenLAB ELN success story
 -
 Quality-by-design (QbD) approach to method development delivers robust peptide mapping method in far less time
 -
 High sensitivity analysis of silicon-based nanoparticles using new Agilent 8900 ICP-QQQ
 -
 PerkinElmer FAAS with Agilent consumables: Accurate determination of nutrients and mineral elements in water samples
Figure 1
Types of analytes detectable with various analytical technologies.
Figure 2
Solving a difficult extraction with 2D UHPLC. Left shows complex first-dimension chromatograms, while right shows far simpler second dimension chromatograms.
Figure 3
Range of techniques for detection of unknowns in qualitative analysis and their typical limits of detection.
Figure 4
Qualitative analysis capabilities of Agilent MassHunter software.