Access Agilent eNewsletter July 2015
>> Update My Profile | Subscribe to Access Agilent | Article Directory
Ask the Expert: How do I analyze glycans, aggregates, and charge variants?
By Koen Sandra
Research Institute for Chromatography, Belgium
and Andrew Coffey
Agilent Biopharma Application Chemist
In last month’s article on biosimilar analysis, we looked at the use of reversed-phase LC to examine intact structures and produce peptide maps – and when coupled to MS, to increase confidence in your results. This month we turn our attention to other sources of structural variation that are equally important to understand, measure, and control for reliable production of therapeutic mAbs.
Q: Why are glycans important?
Answer: Many proteins undergo posttranslational modifications to incorporate oligosaccharides onto their surface. These carbohydrates known as glycans are attached enzymatically to the side chains of key amino acids, such as asparagine (N-linked), and serine or threonine (O-linked). They can play a major part in ensuring correct protein folding or be involved in molecular recognition or signaling pathways. Although the level of glycosylation in therapeutic mAbs is relatively low (typically around 3 to 4% by weight), some therapeutic proteins have much higher concentrations (the glycan content of erythropoietin is as high as 40% w:w).
Characterizing and controlling glycan structure is essential for therapeutic mAb production given their potential role in antibody-dependent, cell-mediated cytotoxicity and complement-dependent cytotoxicity. As well as the cell line used for protein expression, glycan structure is also affected by the fermentation conditions – levels of dissolved oxygen and carbon dioxide, and even reactor design, can all influence the structure of the glycan.
 Enlarge
Figure 1. Herceptin N-glycan separation on both 1.8 µm and 2.7 µm HILIC columns.
Q: How do I analyze glycans?
Answer: To characterize protein N-glycosylation, the glycan is first cleaved enzymatically from the denatured protein using PNGase F. Hydrophilic interaction chromatography (HILIC) then separates the released glycans by using an Agilent AdvanceBio Glycan Mapping column designed for the purpose. The gradient elution conditions are compatible with MS detection, although it is more common for the carbohydrate to be labeled using 2-aminobenzamide (2-AB) before analysis, with a fluorescent detector incorporated into the HPLC system. The latter derivatization procedure furthermore increases the electrospray ionization efficiency of the glycans. Newer choices in HILIC columns allow high-resolution glycan separations. Figure 1 shows the separation of 2-AB labeled N-glycans, enzymatically liberated from Herceptin, using either sub 2 µm fully porous particles or 2.7 µm superficially porous particles.
 Enlarge
Figure 2. Replicate analysis (n=5) of intact Herceptin on WCX.
Q: What about charge variants?
Answer: Measuring and quantifying the level of charge variants from large, complex biomolecules is an immense challenge. The most appropriate technique is ion-exchange chromatography (IEX) using Agilent Bio IEX columns. Since most therapeutic mAbs have a higher proportion of basic residues, cation exchange chromatography is most commonly used. The advantage of using cation exchange chromatography is that the protein does not need to be denatured; the mild aqueous conditions allow the intact mAb to be analyzed. To maximize resolution, it is often necessary to use long columns with shallow gradients. Weak cation exchange (WCX) columns often give better selectivity than strong cation exchange columns. Some WCX columns are specifically optimized for mAbs, such as the Agilent Bio MAb. No matter which IEX column you select, method development and optimization is still necessary for each product, and a rigorous “Quality by Design” approach covering mobile phase ionic strength and pH is essential. Figure 2 shows the replicate analysis of Herceptin on WCX with resolution of the asparagine deamidation before the main peak. The precision offered makes the technology highly attractive for comparing different production batches, and comparing innovator biopharmaceuticals with biosimilars.
 Enlarge
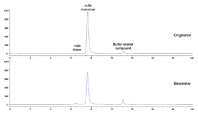
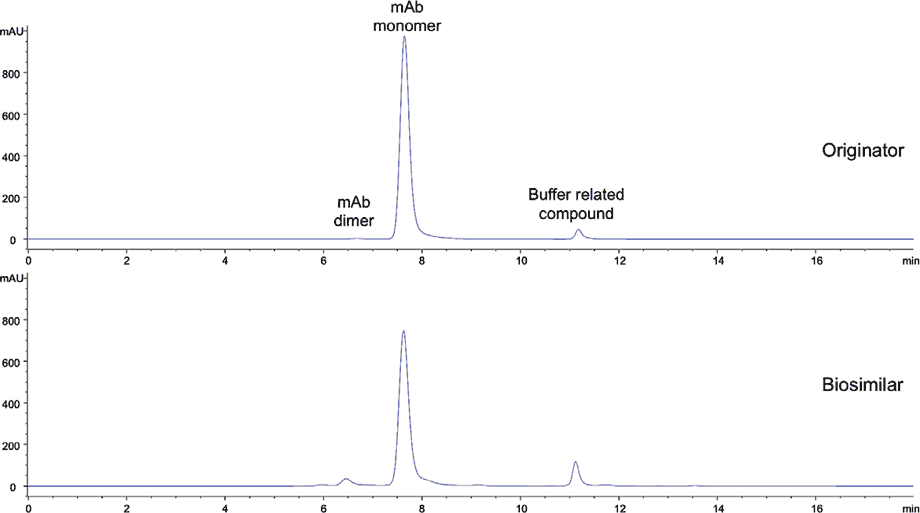
Figure 3. Comparison of SEC separations of Herceptin and a biosimilar.
Q: Why should I analyze aggregates?
Answer: It is essential to measure and control aggregation, since aggregates can stimulate immune responses. These responses could lead to an adverse event such as anaphylactic shock. Having the critical attributes for product efficacy and safety of therapeutic mAbs, Agilent biocolumns for size exclusion chromatography are the columns to choose.
Proteins can form dimers or larger aggregates, or even degrade into fragments such as the heavy and light chain components characteristic of IgG molecules. In the production of biosimilars, it is critical for the high and low molecular weight (HMW and LMW) variants to be very similar to the originator to avoid potential adverse events. Figure 3 shows a comparison of the SEC separation of Herceptin and a potential biosimilar, displaying differences in HMW and LMW profiles.
Agilent biopharma solutions
These examples highlight the importance of characterizing mAbs to ensure their efficacy and safety in end use, and reveal some of the different LC techniques you can use to elucidate different characteristics. Next time, our final article in this series will examine the powerful software tools you can use to speed up your analyses. All the examples discussed are detailed in our complimentary Prepping Biosimilars compendium.
From glycan analysis and charge variant separations to quantification of aggregates, Agilent provides high-resolution columns to provide the insights you need for your biosimilars. These advanced methods help you correctly determine molecular weight and identity, determine purity, and find difficult to resolve impurities. Learn more about Agilent biopharma solutions to help advance your biopharma research.
>> Update My Profile | Subscribe to Access Agilent | Article Directory
Figure 1.
Conditions |
|
|---|---|
Column |
Agilent Advance Bio Glycan Mapping, 2.1 x 150 mm, 2.7 µm and 1.8 µm |
Mobile phase |
A, 100 mM ammonium formate, pH 4.5; B, ACN |
Gradient |
0 – 38 min, 80 – 60% B |
Flow rate |
0.4 mL/min |
Temp |
55 °C |
Instrument |
Agilent 1260 Infinity LC |
Herceptin N-glycan separation on both 1.8 µm and 2.7 µm HILIC columns.
Figure 2.
Conditions |
|||||||||||||||
|---|---|---|---|---|---|---|---|---|---|---|---|---|---|---|---|
Column |
Agilent Bio MAb, 2.1 x 250 mm, 5 µm |
||||||||||||||
Mobile phase |
A, 10 mM phosphate buffer, pH 7.65; B, 10 mM phosphate buffer, pH 7.65 + 100 mM NaCl |
||||||||||||||
Gradient |
|
||||||||||||||
Inj vol |
16 µL |
||||||||||||||
Flow rate |
0.2 mL/min |
||||||||||||||
Temp |
30 °C |
||||||||||||||
Instrument |
Agilent 1100 Series |
||||||||||||||
Replicate analysis (n=5) of intact Herceptin on WCX.
Figure 3.
Conditions |
|
|---|---|
Column |
Agilent Bio SEC-3, 4.6 x 300 mm, 3 µm |
Mobile phase |
A, 100 mM phosphate buffer, pH 7 |
Inj vol |
2 µL |
Flow rate |
0.35 mL/min |
Temp |
24 °C |
Detection |
214 and 280 nm |
Instrument |
Agilent 1100 Series, quaternary pump, autosampler, DAD |
Comparison of SEC separations of Herceptin and a biosimilar.