Access Agilent eNewsletter, September 2014
>> Update My Profile | Subscribe to Access Agilent | Article Directory

Faster, multi-element lubricant testing with Agilent MP-AES and mobile FTIR
By Wayne Collins
Agilent Global Marketing
Plant maintenance strategies typically rely on quantitative laboratory tests as guidance for determining maintenance actions and the timing required. As a general rule, lubricant samples are obtained from each piece of equipment and then sent to a lab for evaluation. When the lab results come back, a decision is made as to the proper course of action. Unfortunately, waiting for lab results can take hours, days, or even weeks, during which time the condition of the lubricant can further deteriorate. Further delays can also occur when work orders are being processed. Now, new technologies for out-of-laboratory spectroscopic analysis let you evaluate lubricants on the spot.
 Enlarge
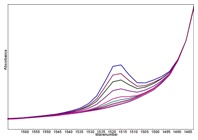
Figure 1. FTIR spectral overlay of the phenolic antioxidant functional group bands depleting as a function of time. The strongest band (light blue) is that of new ISO 32 turbine oil and the weakest absorbance (light green) is from turbine oil that has started to show some oxidation.
 Enlarge
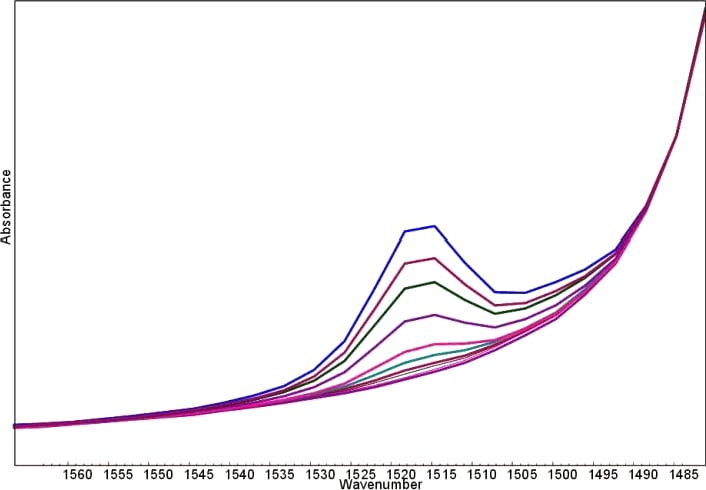
Figure 2. FTIR spectral overlay of the aminic antioxidant functional group depleting as a function of time. The strongest absorbance (red) is aminic antioxidant in new ISO 32 turbine oil and the weakest bands (blue and green) are from turbine oil with spent antioxidant.
Agilent 5500t FTIR Analyzer for rapid, on-site testing of turbine oils
Phenolic and aminic antioxidants in turbine oils are preservatives that prevent the oil from oxidizing and forming harmful varnish deposits. Once the antioxidants are consumed, the oxidation process accelerates exponentially and a lubricant can fail, leading to severe machine damage.
These antioxidants, present in turbine oil, have prominent absorbance bands in select regions of the infrared spectrum, and so ASTM International prefers Fourier Transform Infrared Radiation (FTIR) spectroscopy for measurement of these compounds. Figure 1 shows one of the major infrared bands of a phenolic antioxidant in turbine oil and the change in the band, as a function of time, as the antioxidant is depleted. Similarly, Figure 2 illustrates the incremental diminishment of the aminic antioxidant as the turbine oil ages. These “fingerprint bands” are characteristic of the functional groups for these two species and are used for quantitation by the Agilent 5500t FTIR analyzer.
FTIR measurements are more rapid than electrode-based antioxidant monitoring equipment, and minimize dependency on the skill of the operator by displaying results in an intuitive red, yellow, or green condition monitor. Just as importantly, being able to measure antioxidant levels on-site with FTIR means that the results achieved will be more convenient, more frequent, and obtained far more rapidly than samples that are sent for off-site analysis to a traditional oil analysis lab. More information on this application is available in Agilent Application Note 5990-7801EN.
Accurate and quick detection of metals in lubricating oils
with Agilent MP-AES
Lubricating oils are also monitored for the presence of metals that naturally wear from bearings and other parts of the machine as an indicator for when it should be taken down for repair prior to catastrophic failure. While flame atomic absorption spectrometry (FAAS) has been used extensively to measure wear metals in oils, many labs have moved to faster, multi-element techniques, such as Agilent microwave plasma-atomic emission spectrometry (MP-AES). Table 1 shows the excellent agreement between the MP-AES measured results and the certified values of all elements in a sample of NIST SRM 1085b wear metals in lubricating oil, demonstrating the validity of the analytical method with MP-AES. Figure 3 shows the Cu spectrum.
Element & wavelength (nm) |
Measured (mg/kg) |
Certified (mg/kg) |
Recovery(%) |
|---|---|---|---|
Fe 259.940 |
314.7 ± 0.3 |
301.2 ± 5.0 |
104 |
Mn 259.372 |
289.9 ± 0.2 |
300.7 ± 2.0 |
96 |
Cd 226.502 |
290.9 ± 2.9 |
302.9 ± 5.1 |
96 |
Cr 276.653 |
305.2 ± 0.1 |
302.9 ± 3.9 |
101 |
Si 251.611 |
295.7 ± 1.9 |
300.2 ± 5.0 |
99 |
Ni 305.081 |
291.6 ± 0.1 |
295.9 ± 7.4 |
99 |
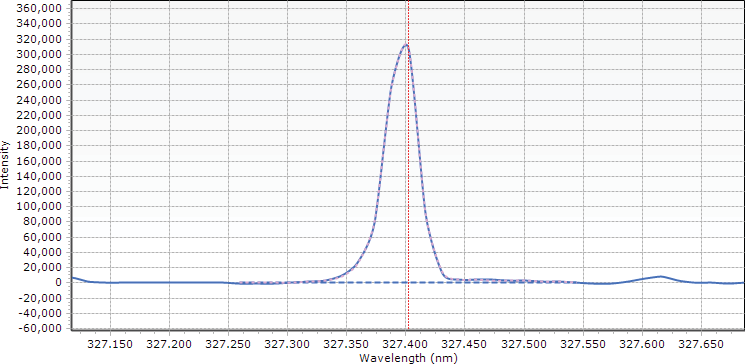
Cu 327.395 |
300.9 ± 0.1 |
295.6 ± 8.5 |
102 |
Ag 328.068 |
308 ± 0.2 |
304.6 ± 8.9 |
101 |
Pb 283.305 |
296.1 ± 0.1 |
297.7 ± 6.8 |
99 |
V 310.229 |
287.6 ± 0.1 |
297.8 ± 4.6 |
97 |
Ti 323.452 |
293.9 ± 0.1 |
301.1 ± 2.9 |
98 |
Sn 303.411 |
295.3 ± 0.3 |
299.4 ± 4.8 |
99 |
Mo 319.398 |
296.9 ± 0.1 |
300.6 ± 3.2 |
99 |
Al 396.152 |
291.7 ± 0.2 |
300.4 ± 9.3 |
97 |
Na 589.592 |
297.4 ± 0.1 |
305.2 ± 7.0 |
97 |
Table 1. Measured results versus certified values in the analysis of NIST SRM 1085b using Agilent MP-AES.
 Enlarge
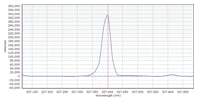
Figure 3. The signal from Cu 327.395 nm at 5 ppm shows the excellent sensitivity of the Agilent MP-AES.
A comprehensive portfolio of Agilent spectroscopy solutions
These are just two brief examples of spectroscopy solutions available from Agilent. Our comprehensive portfolio offers powerful and reliable solutions in diverse application areas such as environmental, food safety and agriculture, energy and chemical, materials testing and research, geochemistry, and semiconductor analysis.
With our application specific software and training courses, Agilent provides a full range of solutions – all backed by our worldwide service and support organization.
>> Update My Profile | Subscribe to Access Agilent | Article Directory
Figure 1.
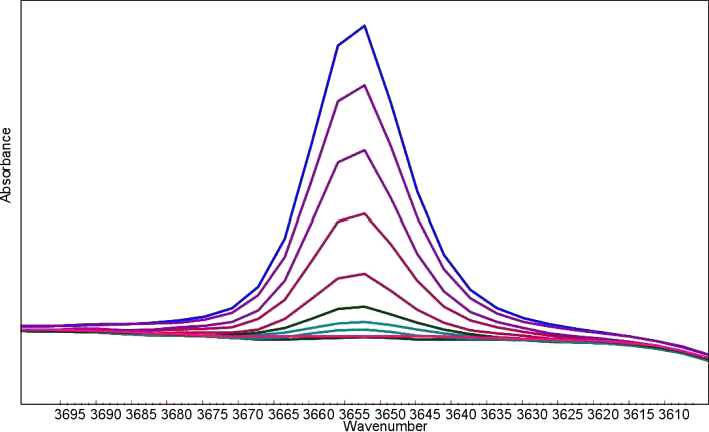
FTIR spectral overlay of the phenolic antioxidant functional group bands depleting as a function of time. The strongest band (light blue) is that of new ISO 32 turbine oil and the weakest absorbance (light green) is from turbine oil that has started to show some oxidation.