
Global production of soybean (Glycine max) is rising due to its varied uses as a source of protein in plant‑based foods, edible oils, and livestock feed, as well as a source of energy in biofuels. As demand rises, regulators and certification schemes, for example, the 2023 EU Deforestation Regulation, require proof that soybeans are sourced sustainably. Geographical authentication ensures compliance with these regulations, protects against links to illegal deforestation, and upholds consumer trust in sustainability and labeling claims. Mislabeling of geographical origin is one of the most common forms of fraud in the food industry. For producers, origin verification safeguards product value and demonstrates accountability in supply chain management.
How to identify the origin of crops using elemental fingerprints
Distinguishing the source of crops based on traditional methods, such as documentation or certification alone, can be difficult due to the complexity of global supply chains. These challenges have led to the development of advanced methods for verifying origin and enhancing traceability.
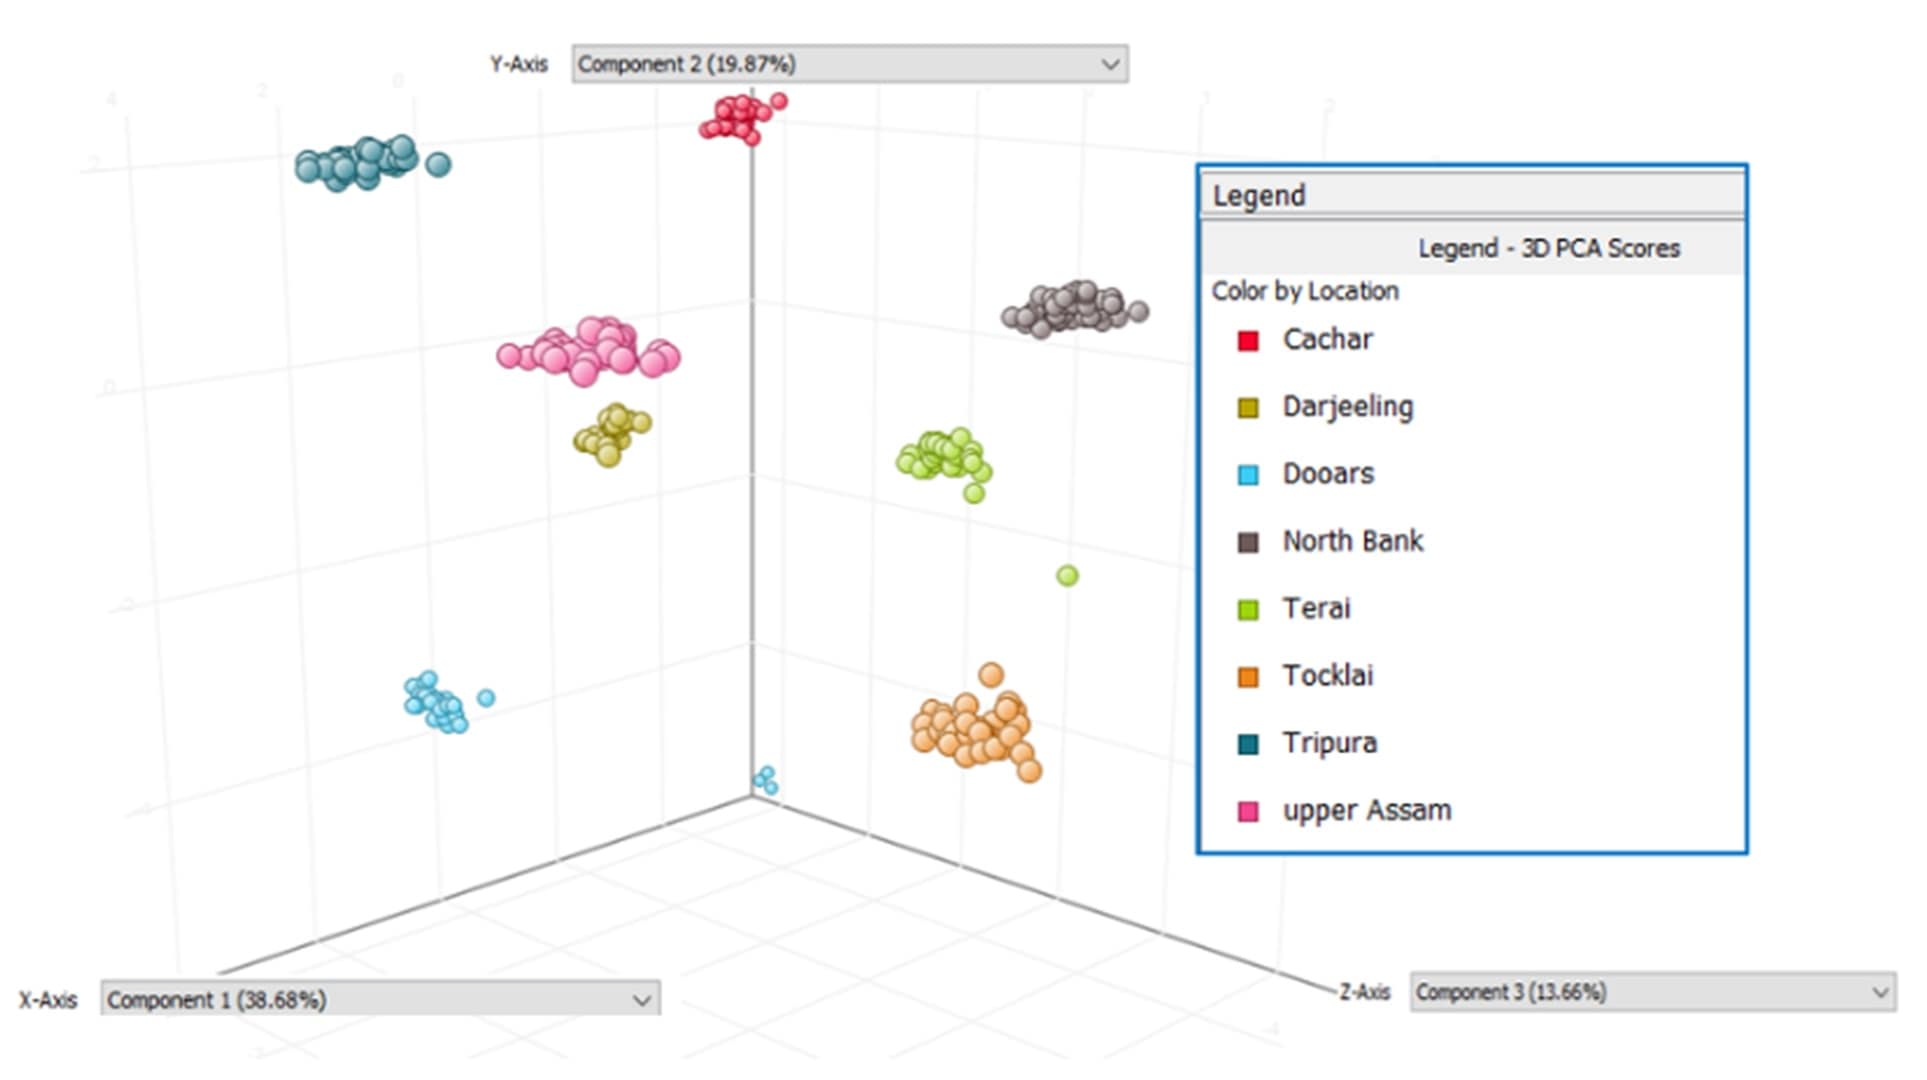
The elemental composition of crops such as soybean reflects their growing environment, including soil properties, climate conditions, and agricultural practices. Agilent ICP-MS instruments are often used for these types of studies due to their speed, multi-elemental capabilities, wide dynamic range, low detection limits, and ability to mitigate spectral interferences. When combined with advanced data analysis tools, such as Agilent Mass Profiler Professional software (MPP), ICP-MS methods have enabled the precise multi-elemental profiling of crop samples, including rice and tea (Figure 2), reflecting their geographical origin.1,2,3
Analytical workflow used for the analysis of soybean by ICP-MS
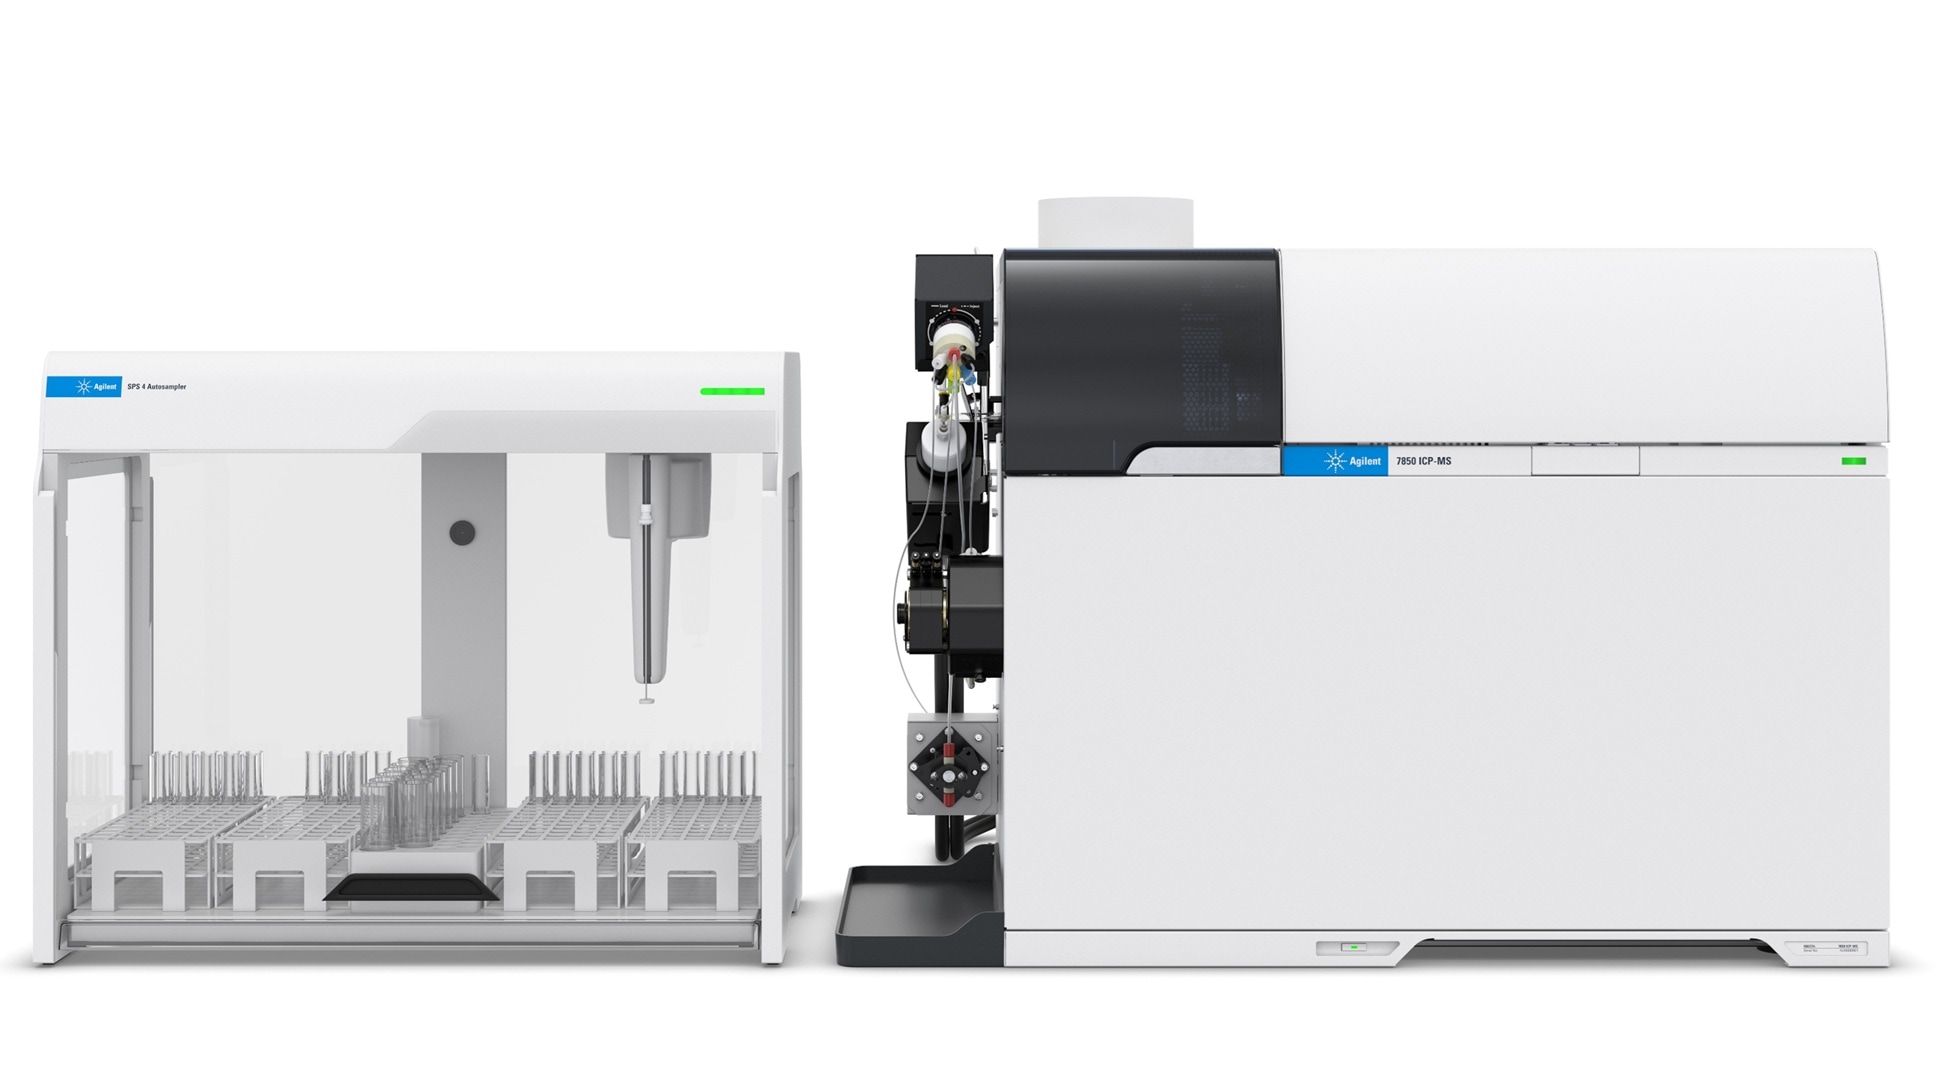
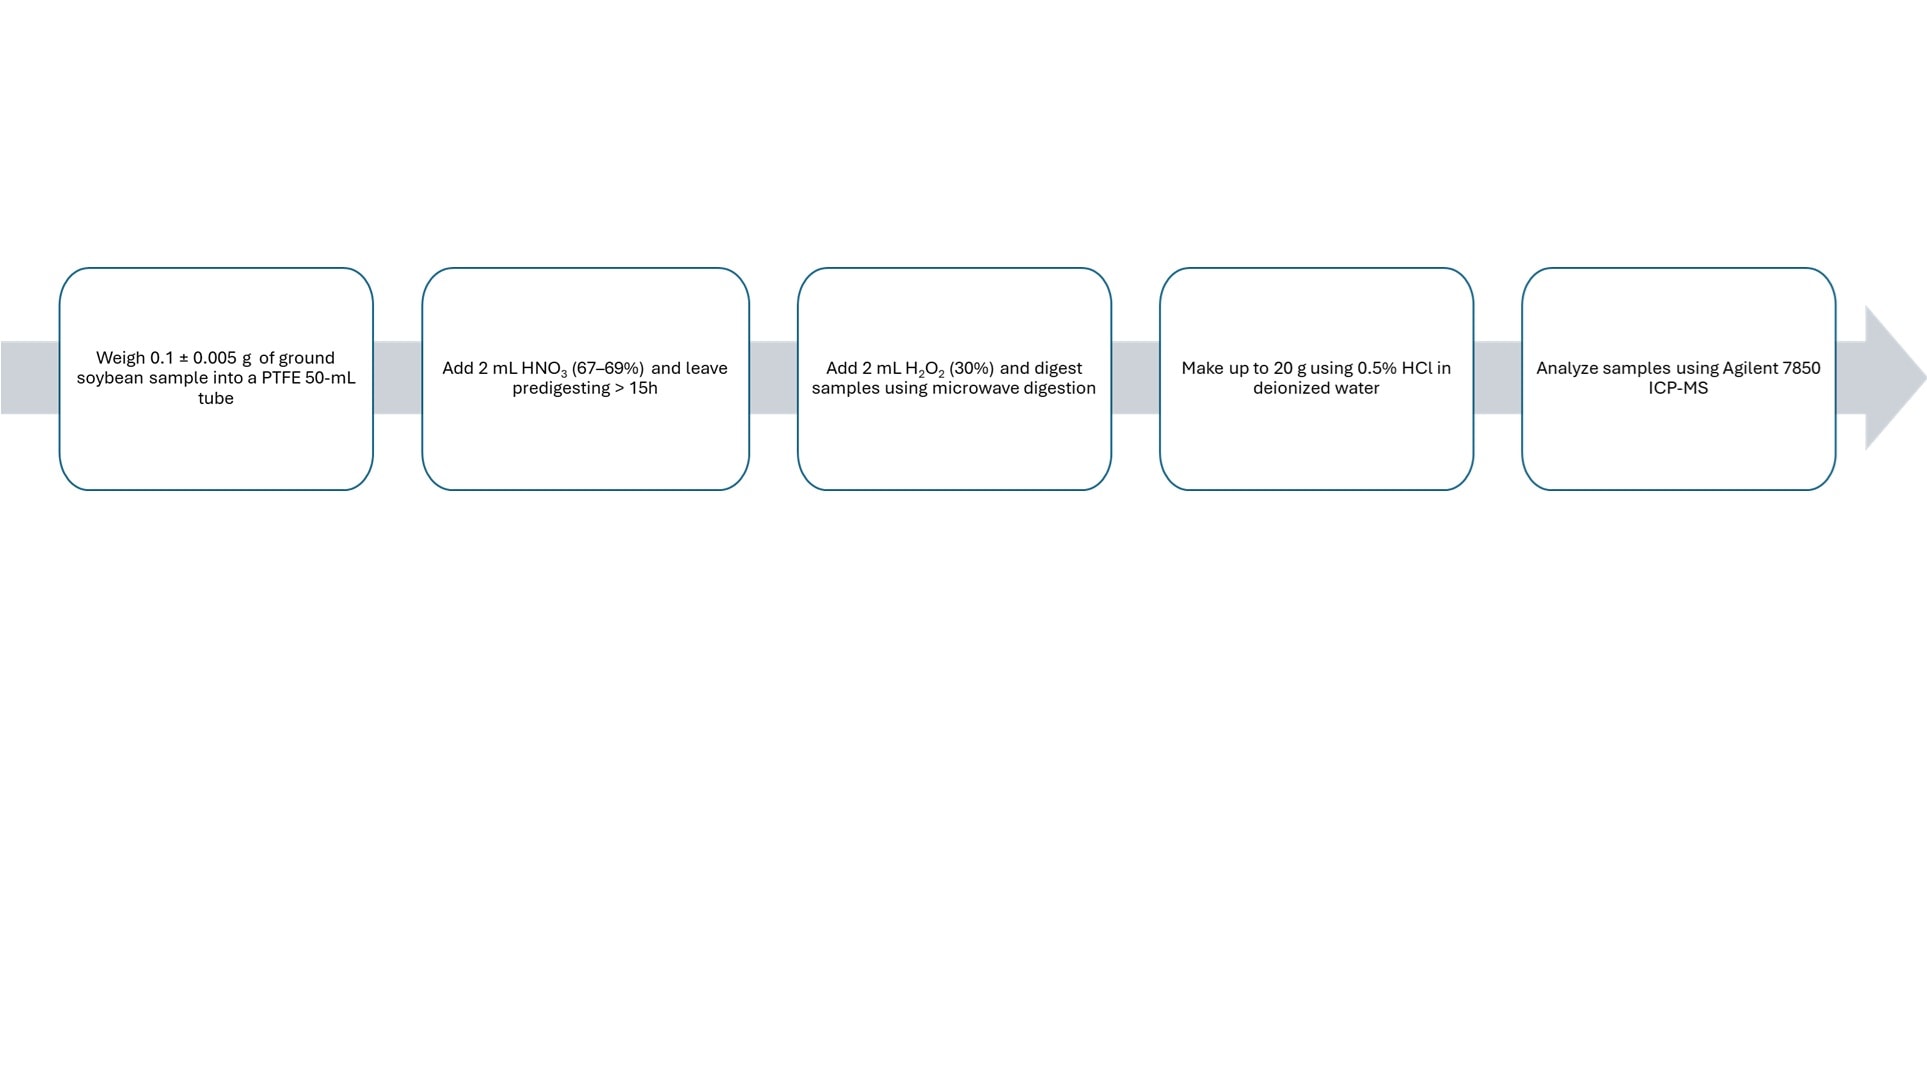
In this study, 330 soybean samples were collected across four growing seasons from seven major producers, including Brazil, the USA, Argentina, Paraguay, China, India, and Canada. They were analyzed by the Agilent 7850 ICP-MS with ORS4 collision reaction cell, as outlined in Figure 3.
Data analysis using MPP software
The elemental data for 40 elements measured in 330 soybean samples were combined and imported into the MPP chemometric software for statistical analysis. The data was acquired by operating the ORS4 in helium mode (He KED) for all elements apart from boron (no gas). The MPP software provides a range of statistical and visualization tools, including t-tests, analysis of variance (ANOVA), model-building algorithms, box-and-whisker plots, correlation analysis, and clustering analysis.
Principal Component Analysis (PCA) with a p-value cutoff <0.05 was performed to identify differences between soybean sample groups based on geographical origin. The main variation in the elemental profiles was captured by the first three principal components: PC1 (Nd, Sm, and Gd), PC2 (B, Co, and Zn), and PC3 (Ni, Cr, and Cd). The concentration of these elements varied from single figure μg/kg (ppb) to mg/kg (ppm) levels in the original soybean samples, highlighting the benefit of the 7850 ICP-MS to provide accurate analysis across a wide concentration range.
Class prediction analysis
Class prediction analysis is a powerful technique for objectively assigning unknown samples to predefined groups. The MPP software offers multiple class prediction algorithms. For this study, Linear Discriminant Analysis (LDA) was selected to develop prediction models for identifying the geographical origin of soybean samples based on their elemental composition.
The dataset was randomly divided into a training set (80%) and a test set (20%), ensuring a balanced representation across the seven countries. The training set was used to develop the model by identifying the linear combinations of elements that best separate the predefined geographic groups. The LDA score plot was used to visually assess sample separation and clustering (Figure 4).
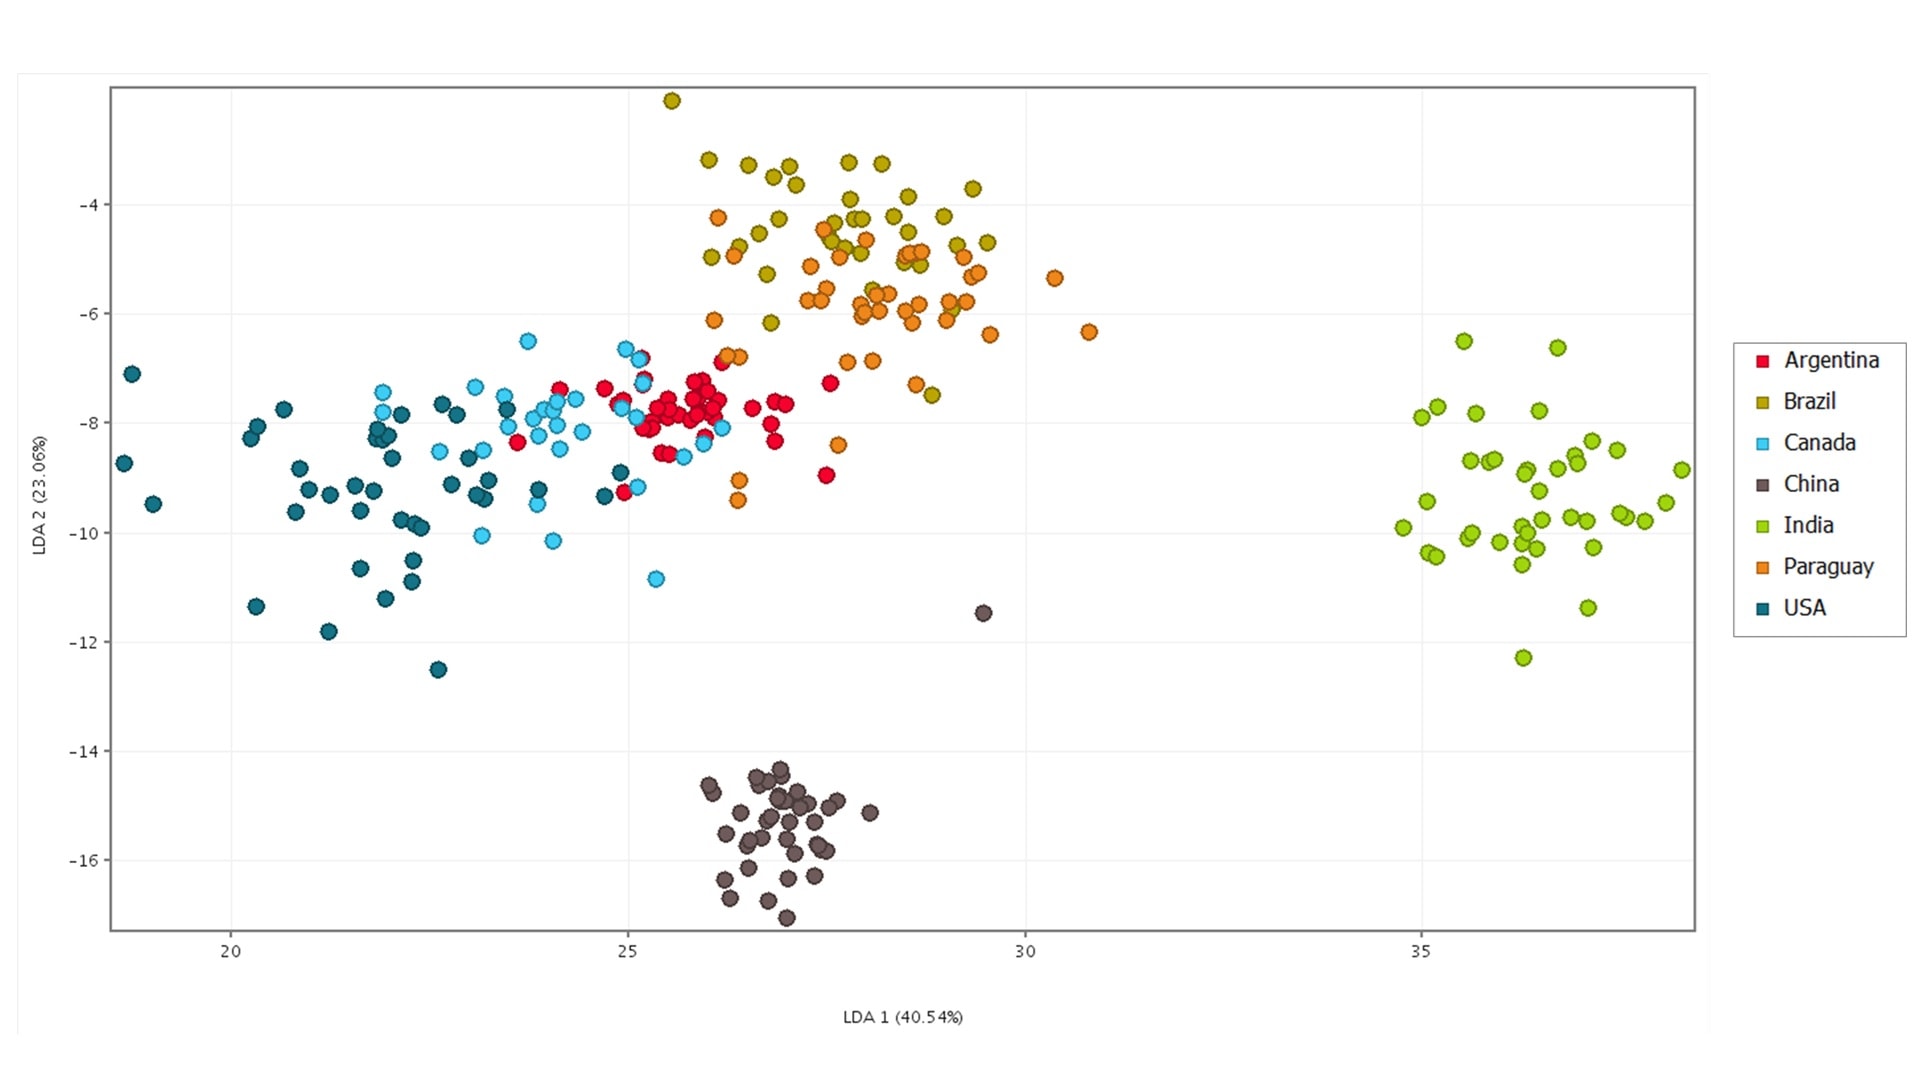
The test set, consisting of 66 unknown samples, was then used to evaluate the model’s classification accuracy. The origin of 64 of the 66 samples was correctly assigned using the LDA model, with confidence measures ranging from 0.226 to 0.947. This equates to a 98.5% correct prediction of the geographical location, indicating the model’s effectiveness and reliability.
These findings highlight the potential of ICP-MS and chemometric modeling as a scalable and reliable solution for verifying soybean origin, ensuring supply chain transparency, combating food fraud, and supporting sustainable agricultural practices.
References:
- Xu, F. et.al. Authenticating Rice by Elemental Profiling Using ICP-MS and Statistical Modeling, Agilent publication, 5994-4043EN
- Jain, V.; Dong, S.; Kanrar, B. Authenticating Geographical Origin of Tea Using ICP-MS and Agilent Mass Profiler Professional Software, Agilent publication, 5994-4583EN
- Jain, V; Dong, S; Sen, P.; Kar, Prasenjit. Using ICP-MS Trace Element Fingerprint and MPP to Confirm the Region of Origin of High-Value Indian Teas, Agilent ICP-MS Journal, 91, 2023, 5994-5585EN
Learn more
Aparicio-Muriana, M.M., Hong, Y., Chilaka, C.A. et al. Mapping the global origins of soybean: a study using ICP-MS and chemometrics. npj Sci Food 9, 2025, 263, https://doi.org/10.1038/s41538-025-00630-5
April 2021 Thought Leader Award Winner - University Relations at Agilent