Access Agilent eNewsletter September 2015
>> Update My Profile | Subscribe to Access Agilent | Article Directory

Improved analysis of complex samples using a reverse-inject differential flow modulator for GC×GC
By Chiara Cordero1, Patrizia Rubiolo1, Lugi Cobelli2, Gianluca Stani2, Armando Miliazza3, Roger Firor4, Matthew Giardina4, and Carlo Bicchi1
1 Dipartimento di Scienza e Tecnologia del Farmaco, Università di Torino, Turin, Italy
2 SRA Intruments SpA, Cernusco sul Naviglio, Milan, Italy
3 Agilent Technologies Italia SpA, Cernusco sul Naviglio, Milan, Italy
4 Agilent Technologies, Wilmington DE, USA
Samples found in the petrochemical, environmental, and fragrance industries often contain so many components that a single GC column is unable to separate all of them. Comprehensive two-dimensional gas chromatography (GC×GC) is recognized for its powerful separation capabilities in the analysis of these complex mixtures. While reliable setup of GC×GC hardware can be a cumbersome task for many labs, Agilent provides a GC×GC flow modulator that allows you to separate complex mixtures without complex hardware.
The Agilent GC×GC methodology uses two capillary columns in series coupled with a flow modulator. These columns are usually of very different polarities. Within the flow modulator, analyte bands from the primary column are collected in a fixed-volume channel. An auxiliary carrier gas supply then successively and quickly transfers them into the short secondary column in very narrow bands. Separation that occurs on the first column is preserved during transfer to the second column.
Advantages of the reversed-flush differential flow modulator
A second-generation differential flow modulator for GC×GC was recently prototyped using Agilent Capillary Flow Technology (CFT). This new configuration, based on the device described by Griffith et al. [1], adopts a reverse fill/flush (RFF) injection dynamic instead of the forward flush/fill implemented in first-generation devices.
Advantages of the RFF modulator include:
- Higher efficiency of band reinjection with improved second dimension peak widths and symmetry
- Adjustable collection channel volume
- Better handling of overloading without dramatic loss of peak-capacity/resolution
- Operation with both hydrogen and helium carrier gases
 Enlarge
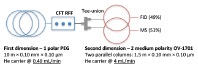
Figure 1. GC×GC configuration using two parallel second-dimension columns.
 Enlarge
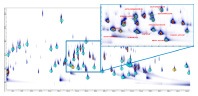
Figure 2. Complete separation of volatiles in the flavor and fragrance field (light blue circles) by GC×GC with the reverse fill/flush differential flow modulator. Data visualization by GC Image.
 Enlarge
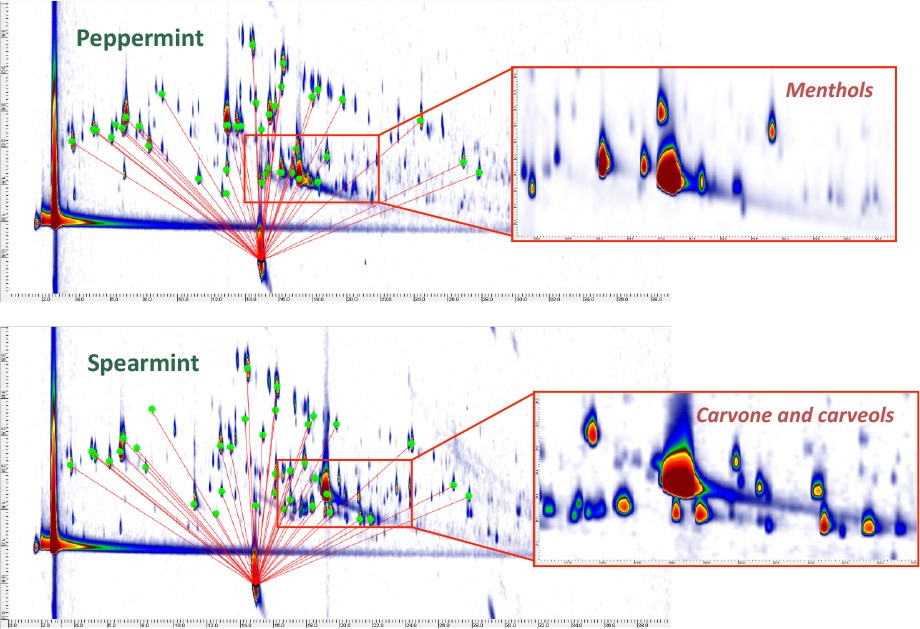
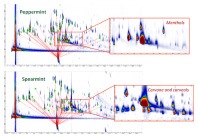
Figure 3. GC×GC separation pattern of peppermint and spearmint essential oils. Quality markers of EOs are indicated with green circles. Data visualization by GC Image.
 Enlarge
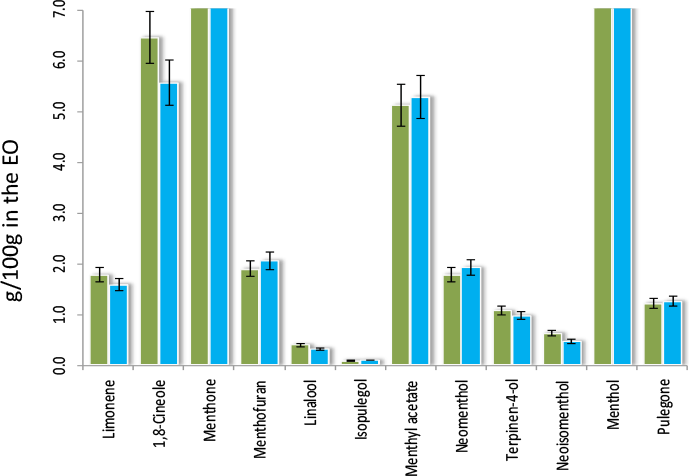
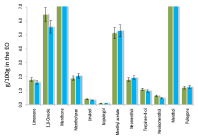
Figure 4. Comparison of external standard calibration (light blue bars) and FID predicted response factors (green bars) for quality markers of peppermint EOs show good agreement.
Optimized method for essential oils
A detailed investigation was conducted to determine optimal conditions for the analysis of essential oils (EOs) using the RFF prototype modulator. Five configurations were investigated to optimize column dimensions, stationary phase selection, flow rates, modulation period, and temperature program. The goal was full separation of a target mixture of volatiles of interest in the flavor and fragrance field in the shortest analysis time. The effectiveness of each configuration was compared based upon reinjection pulse width [2], net separation measure [3], modulation ratio [4], and use of separation space [5].
Figure 1 shows the setup of one of the tested configurations. It combined a polar PEG column in the first dimension with two medium polarity OV-1701 columns in the second dimension. A parallel dual-secondary-column dual-detection configuration provided MS identification and reliable FID quantitation.
Baseline resolution of complex mixture provides excellent quantitation
Figure 2 shows the separation pattern of the model mixture of volatiles. All components were fully separated within 44 minutes. The spreading of peaks over the chromatographic space was excellent, as were peak shapes and peak widths.
Quantitative accuracy was assessed by comparing predicted FID response factors (PRF) [6] to external standard calibration of authenticity markers for peppermint (Mentha x piperita), spearmint (Mentha spicata L.), and lavender (Lavandula angustifolia) essential oils (EOs) using the same configuration as shown in Figure 1. The resulting separations for Mentha spp. EOs are shown in Figure 3. All the markers are baseline resolved from the other components.
Excellent quantitative agreement between the data obtained from external calibration and FID-PRF was achieved (Figure 4). The use of two second-dimension columns provided a good balance between loadability and system efficiency and yielded reliable results for separation and quantitation in the elution region of the major components (menthols and carvones).
Novel device delivers excellent qualitative and quantitative results
This study demonstrates the outstanding performance of the Capillary Flow Technology reverse fill/flush modulator for GC×GC. The comprehensive investigation into an optimized configuration for essential oils resulted in excellent qualitative and quantitative results. For more information and experimental details presented at the 12th GC×GC Symposium, contact your local Agilent Representative or Authorized Distributor today.
References
- Griffith J.F., Winniford W.L., Sun K., Edam R., Luong J.C. J Chromatogr A. 2012, 1226, pp 116-123.
- Klee, M., Cochran, J., Merrick, M., Blumberg, L. M. J. Chromatogr A. 2015, 1383, pp 151-159.
- Blumberg, L. M. J. Chromatogr. A. 2003, 985, pp 29 – 38.
- Khummueng W., Harynuk, J., Marriott, P. J. Anal. Chem. 2006, 78, pp 4578 – 4587.
- Ryan, D., Morrison, P., Marriott, P. J. Chromatogr. A. 2005, 1071, pp 47 – 53.
- de Saint Laumer, Y., Cicchetti, E., Merle, P., Egger, J., Chaintreau, A. Anal. Chem. 2010 82, pp 6457-6462.
>> Update My Profile | Subscribe to Access Agilent | Article Directory
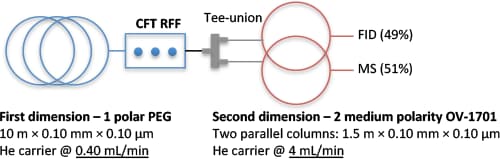
Figure 2.
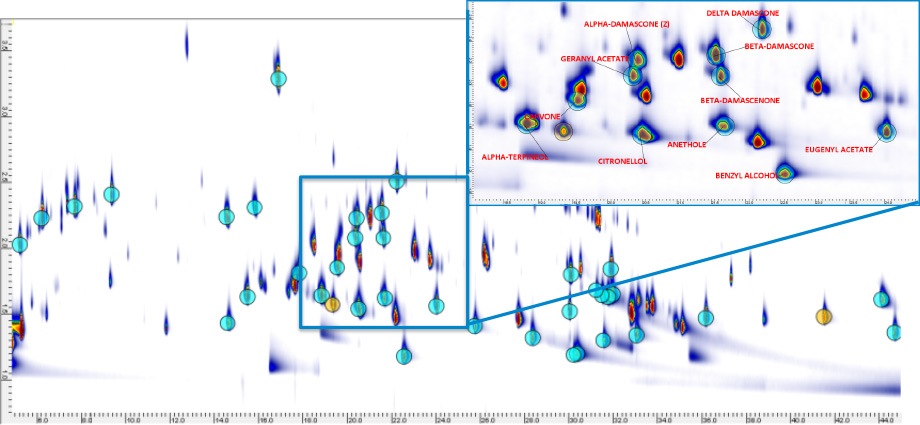
Complete separation of volatiles in the flavor and fragrance field (light blue circles) by GC×GC with the reverse fill/flush differential flow modulator. Data visualization by GC Image.