Access Agilent eNewsletter, March 2015
>> Update My Profile | Subscribe to Access Agilent | Article Directory

Fingerprinting polyethylene glycols from hydraulic fracturing
By E. Michael Thurman and Imma Ferrer
University of Colorado at Boulder, Colorado
and Craig Marvin
Agilent Global Environmental Industry Manager
Hydraulic fracturing, commonly known as fracking, removes oil and gas from shales using pressured fluid extraction. These fluids contain proppants (sand), surfactants, biocides, inorganic salts, and other compounds to help free the trapped gas and oil. However, the flowback water that first returns from the fracking process can contaminate aquifers or surface water, which has created a need for tracer compounds to detect contamination.
Finding polyethylene glycols (PEGs) in tracer compounds
To address this environmental challenge, we combined UHPLC with LC/Q-TOF/MS/MS to detect PEGs as a “fingerprint” of tracer compounds in water affected by the fracking flowback process.
In this application, an Agilent 1290 Infinity LC was fitted with an Agilent ZORBAX Eclipse XDB-C8 reversed-phase column and an Agilent 6540 AccurateMass Quadrupole Time-of-Flight LC/MS. We then used Agilent MassHunter software for data processing.
 Enlarge
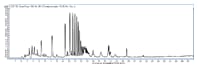
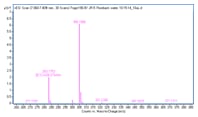
Figure 1. A flowback sample from a hydraulic fractured well showing a bimodal distribution of polymers that differ by 44.026 mass units.
Figure 1 shows the bimodal distribution of flowback water in positive ion electrospray. The first polar group has a retention time of 4 to 12 minutes, and the second, less polar group, 12 to 14 minutes. A nominal mass of 44 mass units separates the peaks in both zones, suggesting a glycol structure of CH2-CH2-O (Table 1). Furthermore, the differences for the first seven peaks are 44.0266 mass units, on average. The second group had similar results. These repeatable relationships make it possible to apply the Kendrick mass scale.
Using the Kendrick scaling factor to calculate mass defects
Using a scaling factor to better separate and understand hydrocarbons separated by a methylene group, CH2 – the Kendrick mass defect states that if two compounds have the same repeating chemical structure of CH2CH2-O)n-H, the exact mass of CH2-CH2-O is added to each new compound in a chromatogram. When the scaling factor is multiplied by the measured masses, all the ions that differ by the CH2-CH2-O group will have the same mass defect (within the error of accurate mass measurement, typically 0.001 mass units). For example, Table 1 shows that measured accurate masses for ions from 3.5 to 10.7 minutes had different mass defects of 0.0776 to 0.3333; however, after multiplying by the appropriate Kendrick scaling factor for the glycol unit (CH2CH2-O) of 0.999404559, only two mass defects were found, 0.975 and 0.023. The fact that all the Kendrick mass defects are identical means that each of the compounds increases by one ethylene glycol unit (an accurate mass of 44.0262). Therefore, we only need the correct formula and structure for one of the glycols to calculate the others as either one unit longer or shorter, depending on the gain or loss of the 44.0262 mass unit.
Retention time (min) |
Ion (m/z) measured accurate mass |
Kendrick mass |
Ion adduct |
|---|---|---|---|
3.5 |
173.0776 |
172.975 |
Na+ PEG-EO-3 |
4.2 |
217.1048 |
216.975 |
Na+ PEG-EO-4 |
5.4 |
261.1309 |
260.975 |
Na+ PEG-EO-5 |
7.3 |
305.1586 |
304.975 |
Na+ PEG-EO-6 |
9.5 |
349.1830 |
348.975 |
Na+ PEG-EO-7 |
10.2 |
393.2095 |
392.975 |
Na+ PEG-EO-8 |
10.7 |
437.2373 |
436.977 |
Na+ PEG-EO-9 |
10.7 |
432.2830 |
432.026 |
NH4+ PEG-EO-9 |
11.0 |
476.3067 |
476.023 |
NH4+ PEG-EO-10 |
11.3 |
520.3333 |
520.023 |
NH4+ PEG-EO-11 |
Table 1. Kendrick mass for PEGs in flowback water from Weld County, Colorado, based on a scaling factor of 0.999404559.
 Enlarge
Figure 2. The formula for the ion at 283.1753 and its sodium adduct at 305.1586.
 Enlarge
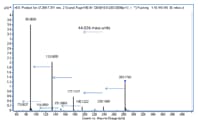
Figure 3. MS/MS of the m/z 283.1743+0.001 proton adduct.
By taking the measured mass of 305.1586 (a sodium and proton adduct shown in Table 1), we can determine a formula with the Agilent MassHunter software. We highlight the proton adduct at 283.1753, then use Generate Formula to determine the best formula. This is captured in Figure 2 as C12H26O7, which is a neutral molecular formula.
MS/MS of m/z 283.1753 then determines whether the spectrum matches a PEG formula (Figure 3). The mass spectrum consists of a series of 44.026 mass unit losses that translates into a simple PEG structure of HO-[CH2CH2O]n-H. This means that the chain length of the unit must be six, because when we use n = 6, the formula of C12H26O7 is correct. We continue from this point in Table 1 to calculate PEG-7 and PEG-8. Similarly, we go backward from PEG-6 to PEGs 3, 4, and 5, given that all of the compounds with the same Kendrick mass differ by one glycol unit.
Agilent MassHunter software finds PEGs in less than a minute
The Kendrick mass scale makes it possible to identify proton, sodium, and ammonium adducts of PEGs. In our example, we used these identifications to build an accurate mass database of the PEG ions and structures. The Agilent MassHunter software found 40 different PEGs and their ion adducts in less than 60 seconds.
By applying the mass scale, accurate masses of PEGs and other ethoxylated surfactants from flowback, samples can be used as unique tracers of hydraulic fracturing – especially when linked to PEG databases created by Agilent MassHunter software , and Agilent LC/MS/MS. This approach provides an increased ability to detect contaminants in aquifers or surface water. To learn more about detecting PEGs in fracking flowback water and environmental analysis – explore Agilent’s Environmental Solutions. Then, take a moment to read an article discussing how we expanded our investigations to include linear alkylethoxylates in Thurman et al. (2014).
>> Update My Profile | Subscribe to Access Agilent | Article Directory