Access Agilent eNewsletter, September 2014
>> Update My Profile | Subscribe to Access Agilent | Article Directory
Reduce injected sample amount by 75% for pesticides in foods with the Agilent 7010 Triple Quadrupole GC/MS
By Melissa Churley
Agilent Senior Applications Scientist
A major breakthrough in the analysis of pesticide residues in food has been achieved through the use of the Ultra-Efficient Ionization source of the Agilent 7010 Triple Quadrupole GC/MS. Our new hardware design provides a newly achievable, higher level of response, which opens up numerous possibilities to the analytical approach. In one scenario, the analyst would be able to scale down current methods, for example by diluting the sample prior to injection or by simply injecting less into the instrument. Less matrix injected translates into prolonged uptime and sustained performance – resulting in lower costs.
We tested this concept by injecting only 25% of the standard injection volume using our recommended pesticides analysis method for foods to evaluate whether we could analyze the most challenging pesticides at or below the default threshold EU MRL of 0.01 mg/kg, or 10 ng/g.
 Enlarge
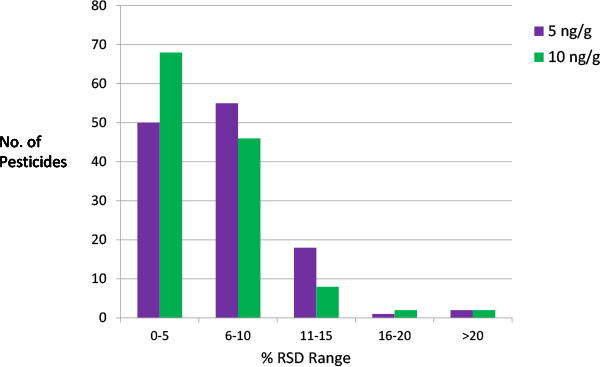
Figure 1. Distribution of %RSDs for 126 pesticides in plum using 0.5 µL injection.
Testing the most challenging pesticides
In our study, the following components were used for maximum sample path inertness: Agilent J&W Ultra Inert HP-5ms GC columns in dimensions of 5 m x 0.25 mm x 0.25 µm and 15 m x 0.25 mm x 0.25 µm (G3903-61005, 19091S-431UI), Agilent Ultra Inert 2mm dimpled liners (5190-2297) and Agilent UltiMetal Plus Flexible Metal ferrules (G3188-27501) at the Purged Ultimate Union were used for column backflushing.
We extracted homogenized plum matrix to prepare 1 g/mL using AOAC QuEChERS extraction and dispersive kits (5982-5755, 5982-5058). Calibration standards for a mixture of 126 individual pesticides and groups of pesticide isomers were prepared by spiking the extracted blank matrix at 0.02-100 ng/g (see Figure 1). Sets of ten standards were injected consecutively five times with calibration on the third, or middle, set. A linear curve fit with 1/x weighting was used and all other points were designated as QCs, which appear as blue diamonds in the linear regression plots in Figure 2. Percent RSD values were calculated for each concentration level and estimates for the LOQ were made using %RSD = 20 as the upper limit of acceptability.
Reduction in injected sample matrix prolongs instrument uptime and cuts costs
Correlation coefficients (R^2) were ≥0.992 for all pesticides studied. Figure 1 shows the number of pesticides with given %RSD values (n = 5) based on calculated concentration at 5 and 10 ng/g. Of 126 pesticides tested with a 0.5 µL injection volume, only two (captan and folpet) yielded %RSDs > 20 at 10 ng/g.
All 126 pesticides studied were analyzed at or below the MRL in plum
Table 1 contains values for R^2 and estimated LOQ for selected difficult-to-analyze pesticides. The default EU MRL of 10 ng/g was reached for all 126 residues included in the analysis except in the case of captan and folpet. However, the estimated LOQ values for captan and folpet, 20 ng/g in each case, are equal to or well below the listed MRL values in plum which are 7000 ng/g for captan and 20 ng/g for folpet. In order to consistently reach lower LOQs, the use of deuterated ISTD for captan and folpet could be evaluated. No weighting is used in regression analysis for these two compounds.
Pesticide |
CF R^2 (linear, 1/x) |
Estimated LOQ (ng/g) |
Pesticide |
CF R^2 (linear, 1/x) |
Estimated LOQ (ng/g) |
|---|---|---|---|---|---|
Dichlobenil |
0.9970 |
0.5 |
Folpet |
0.9987 |
20 |
Etridiazole |
0.9987 |
0.1 |
Dinobuton |
0.9961 |
5 |
THPI |
0.9962 |
1 |
Triflumizole |
0.9986 |
0.5 |
Dicloran |
0.9987 |
0.5 |
Chlordane-trans |
0.9998 |
0.5 |
Diazinon |
0.9975 |
0.05 |
Endosulfan I |
0.9980 |
5 |
Disulfoton |
0.9987 |
0.5 |
Tetrachlorvinphos, |
0.9994 |
0.5 |
Chlorothalonil |
0.9992 |
0.1 |
Endrin |
0.9998 |
0.5 |
Fuberidazole |
0.9922 |
1 |
Endosulfan II |
0.9993 |
1 |
Heptachlor |
0.9996 |
0.05 |
DDT-p,p' |
0.9998 |
0.5 |
Metalaxyl |
0.9991 |
0.1 |
Resmethrin I and II |
0.9949 |
5 |
Aldrin |
0.9980 |
0.1 |
Propargite |
0.9969 |
5 |
Metolachlor |
0.9988 |
0.05 |
Phenothrin I and II |
0.9995 |
5 |
Fenthion |
0.9989 |
0.05 |
Cypermethrin |
0.9995 |
1 |
Captan |
0.9962 |
20 |
Difenoconazole I |
0.9934 |
5 |
Allethrin |
0.9994 |
5 |
Deltamethrin |
0.9992 |
0.5 |
 Enlarge
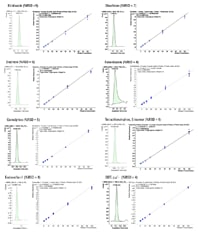
Figure 2. Chromatograms for the 5 ng/g spiked standard and calibration curves for challenging pesticides in plum.
 Enlarge
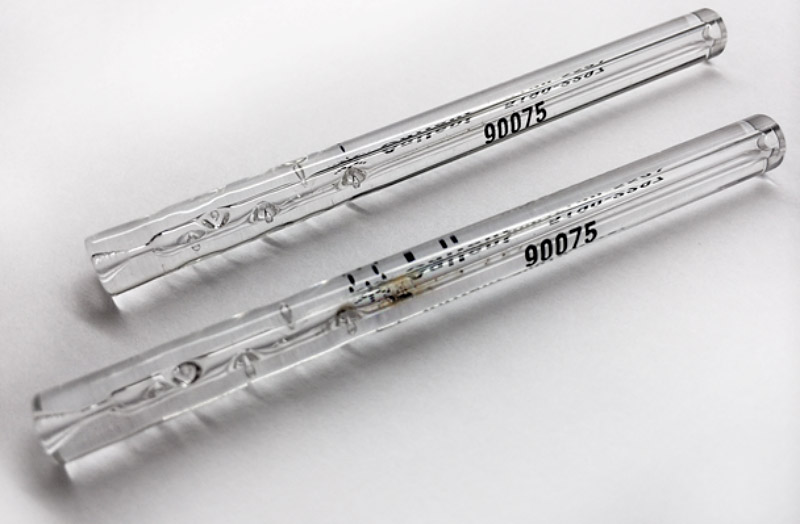
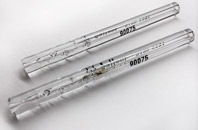
Figure 3. GC liners remain deposit-free after >50 injections of 0.5 µL of matrix. Liner appearance after 0.5 µL injections (upper liner) and 2 µL injections (lower liner).
Table 1. Linear regression analysis results and estimated LOQ values based on %RSD ≤ 20 (n = 5).
Figure 2 shows example chromatograms and calibration curves for some of the most challenging pesticides for GC/MS analysis. The amount injected in a 0.5 µL injection is 2.5 pg as opposed to 10 pg when using a 2 µL injection volume. Even with this reduction in injected sample, optimal chromatography for some of the most challenging pesticides was maintained at half the default MRL, or 5 ng/g.
Percent RSDs (n = 5) at 5 ng/g are provided for each pesticide shown.
Figure 3 shows two identical GC inlet liners that have had different sample volumes injected over the course of a sequence. The lower liner in the photo has had a greater amount of sample injected and clearly contains increased deposits, which shortens the usable lifetime of the liner. The upper liner that has had reduced sample injected is almost free of visible deposits, which prolongs the performance.
Agilent 7010 Triple Quadrupole GC/MS reduces injected food sample amounts by 75%
By using an existing analytical method with the new Agilent 7010 Triple Quadrupole GC/MS, and only 25% of the previously required sample volume, over 98% of the pesticide residues analyzed in plum were able to be quantitated below the default threshold of 10ng/g. The remaining two pesticides were analyzed at or below the listed EU MRL. This reduction in injected sample matrix is expected to prolong instrument uptime and cut analysis costs without any required changes to the present method.
Our recommended approach for pesticides testing is described in full detail in Agilent’s comprehensive GC/MS/MS Pesticide Analysis Reference Guide, which may be obtained by contacting your Agilent Sales Representative or product specialist. You can also refer to the appropriate Agilent Applications Note (5990-1054EN).
Agilent offers a full suite of GC/MS pesticide solutions. Learn more about Agilent GC/MS Analyzers and Application Kits for pesticides on the Agilent web site.
>> Update My Profile | Subscribe to Access Agilent | Article Directory