Access Agilent eNewsletter, November 2014
>> Update My Profile | Subscribe to Access Agilent | Article Directory
Quality by Design provides a path to robust dissolution methods
By Richard Verseput
S-Matrix President
and Bryan Crist
Agilent Scientific Affairs Manager
Quality by Design (QbD) is an ideal tool for analytical method development and offers some interesting results for dissolution methods. Traditional methods limit speed to 50, 75, and 100 revolutions per minute or volumes to 500, 900, and 1000 mL. This article presents QbD-aligned development of a dissolution method that is more discriminatory and robust at nontraditional settings of key instrument parameters.
Table 1 summarizes the analytical target profile (ATP) for our dissolution method. The table presents the four important dissolution parameters included in this study, their experimental ranges, and their expected total operating variations in routine use. The ATP also summarizes the mean (average) and robustness performance requirements for the method. Each method must exceed the lower acceptability limit given the combined variations in the method parameters that will occur in routine use.
Study parameters |
||
|---|---|---|
Study variable |
Study range |
Expected ±3σ variation |
pH |
4.10 ≤ pH ≤ 4.90 |
±0.10 |
Vessel volume (mL) |
500 ≤ Vessel volume ≤ 1,000 |
±10.0 |
Paddle speed (rpm) |
50 ≤ Paddle speed ≤ 100 |
±5.0 |
Surfactant (%) |
0.5 ≤ Surfactant ≤ 1.50 |
±0.05 |
Performance requirements |
||
|---|---|---|
Response |
Mean performance goal |
Lower acceptability limit |
f2 |
≥ 60% |
50% |
15 minute release |
80% |
70% |
30 minute release |
90% |
80% |
45 minute release |
100% |
90% |
Table 1. Critical quality attributes for the dissolution method developed in this study.
We used the Fusion QbD Software Platform from S-Matrix Corporation to generate experimental designs and to automate tests on the Agilent OpenLAB Chromatography Data System (CDS). We also used it to model data and to report QbD results. For the experiment, we used a dissolution apparatus configured with paddles and 1.0-liter vessels. We drew samples at 0, 15, 30, 45, and 60 minutes and used UHPLC to analyze for percent released of the active pharmaceutical ingredient (API).
Fusion QbD automatically constructs the required dissolution tests in Agilent OpenLAB CDS, including required blank and standards injections. The software can also import the processed chromatogram results and aggregate the data from the test replicates into average release profiles. It can derive curve fit metrics such as f1 and f2 from the profiles, and obtain responses at user-specified time points. For example, it can tell you percent released at 15, 30, and 45 minutes.
Easily find best method to meet performance goals
The Fusion QbD Software Platform uses automated data modeling to search for a best method – one that simultaneously meets all user-specified performance goals. You can also set not-to-exceed acceptability limits for each response (edges of failure in the QbD lexicon). Because individual results for a given response will normally vary about the mean, the software uses restricted acceptability limits rather than absolute acceptability limits. Table 2 presents the method obtained from this search, along with the restricted acceptability limits and the corresponding predicted result for each response.
Study variable |
Best setting predicted by search |
|---|---|
pH |
4.7 |
Vessel volume |
625 |
Paddle speed |
50 |
Surfactant |
1.1 |
Response |
Restricted acceptability limit |
Predicted result |
|---|---|---|
API - f2 |
≥ 60 |
65 |
API - Y-mean at X = 15 |
75 |
83 |
API - Y-mean at X = 30 |
85 |
90 |
API - Y-mean at X = 45 |
≥ 95 |
98 |
Table 2. Method (provided by automated data modeling) that met performance goals.
Robustness analysis reduces risk of method failure
Once you have one or more methods that meet all restricted mean performance requirements, you establish a preliminary design space for mean performance using the restricted acceptability limits. You must then determine if any methods within this design space could fail robustness. Failure means the method will sometimes provide unacceptable results due to expected variation in the study parameters during routine use. The software uses Monte Carlo simulation for this determination. It incorporates the expected operating variations of the study variables (the ±3σ variations presented in Table 1) to generate models that predict a method’s robustness for each response.
 Enlarge
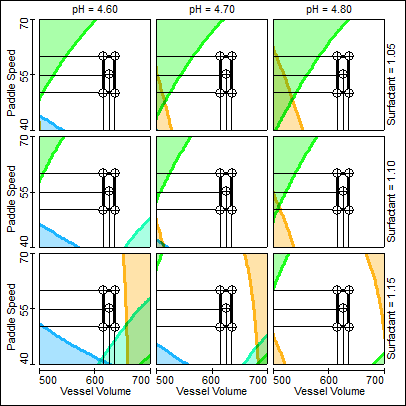
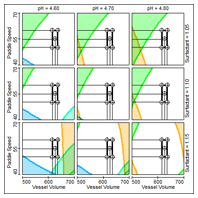
Figure 1. The Fusion QbD visualization feature saves method development time by showing in color the settings where methods will fail to meet the minimum performance requirements.
Figure 1 is a 4-variable (4D) trellis graph series that shows the final design space and proven acceptable ranges (PARs) for the study parameters determined using the Fusion QbD graphical analysis and visualization feature. Note that the software associates a color with each mean response and with each associated robustness response, and uses the colors to shade the regions of the graph where methods fail to meet the minimum performance requirements. The dark line of a given color that demarcates the unshaded and shaded region for a given response is the acceptability limit (the QbD edge of failure).
The PARs for paddle speed and vessel volume are represented in Figure 1 by the black rectangle common to all nine trellis graphs. Note that the trellis series also represents the PARs for pH (±0.1) and surfactant (±0.05). The graph series in Figure 1 therefore simultaneously visualizes the final design space and PARs for all four study parameters.
The use of a graphical visualization tool was critically important in this study, because it showed that a target pH of 4.50 could not support a robust design space across the required PARs for all variables. However, changing the target pH to 4.70 enabled us to achieve the robustness goal.
Readily develop no-fail methods
Design of experiments (DOE) allows you to efficiently investigate and model all the effects of multiple study parameters within their joint study ranges, including interaction effects. This modeling characterizes both the mean performance and the relative robustness of candidate methods. The QbD-aligned approach integrated within the Fusion QbD software, in combination with Agilent OpenLAB Chromatography Data System and UHPLC, enabled the rapid identification of a robust method that met all performance requirements. It also enabled us to establish and visualize the robust final design space and PARs for the four study variables.
If you want an easier, more reliable way to develop robust dissolution methods, learn more about Agilent dissolution offerings and the Fusion QbD Software Platform.
>> Update My Profile | Subscribe to Access Agilent | Article Directory