Access Agilent eNewsletter, January 2014
>> Update My Profile | Subscribe to Access Agilent | Article Directory
Gain better food science insight from better data using the new Agilent ProPulse NMR System
By Dave Russell
Agilent Applications, Nuclear Magnetic Resonance
Food science encompasses a diverse set of challenges that range from questions about food authenticity and origin… to research into variation in foodstuffs and supplements… to quality control and quality assurance. All of these demanding challenges are more easily met when high-quality data are easy to collect and analyze.
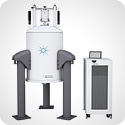
The new Agilent ProPulse NMR System ensures that you have the high-quality data you need by combining robust NMR hardware and elegant VnmrJ 4.1 software in a complete food science solution. The ProPulse system provides a range of new features that not only simplify and improve NMR experiments, but also help researchers better understand their findings.
Automated analysis starts with push-button data acquisition
An automated analysis approach is only as good as the data you start with. The high quality Agilent ProPulse NMR System is built on robust and reliable hardware allowing the evolution of true push-button data collection. ProPulse is fully capable of automatically verifying all aspects of system performance, and it takes care of all sample-to-sample parameter optimizations and adjustments to consistently provide reliable measurements for each and every sample.
 Enlarge
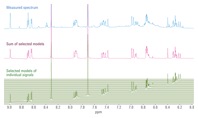
Figure 1. Agilent CRAFT analysis of coffee. The output of CRAFT is a report containing the amplitude and frequency of individual components.
 Enlarge
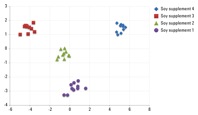
Figure 2. Mathematical analysis of large data sets has become a normal workflow to measure the variation and perturbation of samples. Shown here is the PCA analysis of the Agilent CRAFT report generated on NMR spectra of 40 soybean dietary supplement samples. (See the Agilent “Analysis of Soy Dietary Supplements Using NMR Spectroscopy” application note for complete details.)
Food data analysis – from spectrum to spreadsheet in just minutes
Collecting reliable high-quality spectra is only the first part of solving the problem. Most researchers spend the majority of their time reducing those spectra into a form that can be analyzed by statistical and data mining approaches (Figure 1).
By using the Agilent Complete Reduction to Amplitude and Frequency Table (CRAFT) utility – a feature of VnmrJ software – all signals in even the most complicated NMR spectra can be automatically quantified and tabulated into a simple spreadsheet format. It can take as long as 30 minutes for a user to analyze complicated spectra, while CRAFT analysis takes only minutes. The data are then easy to convert into components and concentrations, test mathematically for variation and similarity between groups of samples, and analyze for new components (Figure 2).
The new Agilent ProPulse NMR System – simply better
The Agilent ProPulse NMR System brings the power of NMR to researchers of all types and all skill levels. The ProPulse NMR System provides:
- Highest quality data: obtained from an ultra-compact footprint
- Confidence in results: VeriPulse keeps the system optimized and proves it
- Sample to spectrum: fully automated, from small molecule applications to BioNMR
- Spectrum to spreadsheet: automated by Complete Reduction to Amplitude and Frequency Table (CRAFT)
- Unrivaled ease-of-use and reliability: helps you focus on your science
See for yourself how the ProPulse NMR System provides large-scale productivity in an ultra-compact footprint
Agilent is committed to improving the entire NMR user experience. See how Agilent brings true ease-of-use to high-performance NMR in this video overview of the Agilent ProPulse NMR System. Then take a moment to discover a complete line of Agilent NMR solutions that can be used to analyze both small- and large-molecule compounds in research and industrial applications.
>> Update My Profile | Subscribe to Access Agilent | Article Directory
Figure 1.
Agilent CRAFT analysis of coffee. The output of CRAFT is a report containing the amplitude and frequency of individual components.
Figure 2.

Mathematical analysis of large data sets has become a normal workflow to measure the variation and perturbation of samples. Shown here is the PCA analysis of the Agilent CRAFT report generated on NMR spectra of 40 soybean dietary supplement samples. (See the Agilent “Analysis of Soy Dietary Supplements Using NMR Spectroscopy” application note for complete details.)