Access Agilent eNewsletter, March 2015
>> Update My Profile | Subscribe to Access Agilent | Article Directory

Cost-effective therapeutic protein characterization with novel fluorescence detector for capillary electrophoresis
By Audrey Boutonnet
Picometrics Laboratory Application Specialist
and Christian Wenz
Agilent R&D Scientist
Monoclonal antibodies are therapeutics that control cancer, allergy, inflammation, and infectious and autoimmune diseases. Capillary electrophoresis (CE) with laser induced fluorescence (LIF) detection is routinely used in quality control for the analysis of these therapeutic proteins. Recently, light emitting diodes (LEDs) have proven valuable as a light source in fluorescence detection. Compared with lasers, LEDs are less expensive, consume less energy, and are more stable.
This article describes capillary electrophoresis – light emitting diode induced fluorescence (CE-LEDIF) methods for two related analyses. One is purity assay of recombinant monoclonal antibodies (rMAbs) and the other is glycan characterization on therapeutic proteins.
Collaboration provides powerful tool
Agilent has an ongoing marketing agreement with Picometrics Technologies to provide biopharmaceutical customers with combined solutions for CE-LIF detection and mass spectrometry (MS). In addition to classic CE-LIF analysis technology, this collection of tools provides the only online CE-LIF-MS solution available today. The platform is ideally suited for the research and development of complex large-molecule biopharmaceutical compounds such as rMAbs.
For rMAb purity analysis and glycan characterization, we took advantage of the following Agilent/Picometrics instrumentation:
- Agilent 7100 Capillary Electrophoresis system
- Picometrics Zetalif LED 450 or 480 nm
- Agilent OpenLab software with LIF driver
The fluorescence detection cell can be integrated into the Agilent 7100 CE cassette, or used directly upfront of the MS-sprayer taking the signal outside of the CE instrument (as in this case of CE-LIF-MS detection with glycans). OpenLab software with LIF driver controls both the CE and the LEDIF detector.
Analysis 1: Quality control of therapeutic protein
For quality control, rMAbs are derivatized with 3-(2-furoyl)-quinoline-2-carboxaldehyde (FQ), which reacts with primary amines to produce a derivative that fluoresces. The derivatization procedure is rapid and no purification is necessary to remove unreacted reagents.
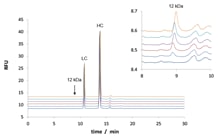
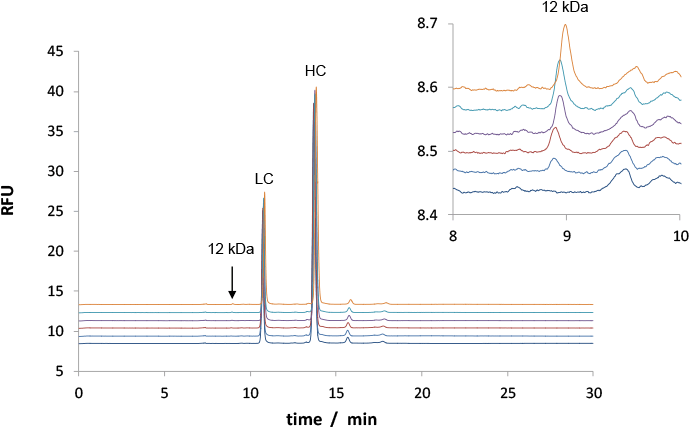
We spiked rMAb sample with a 12 kDa protein size standard (Cholera Toxin B, CTB) at these levels: 0.05%, 0.10%, 0.15%, 0.20%, 0.25%. The analyses with a 480 nm LED – shown in Figure 1 – demonstrate a limit of detection (LOD) < 0.05% CTB. This value is close to published LODs obtained with more expensive laser-based systems.
 Enlarge
Figure 1. CE-LEDIF purity analysis for rMAb with five levels of CTB contamination. Impurities were quantified with good accuracy and precision. The insert shows a 100-fold zoom.
 Enlarge
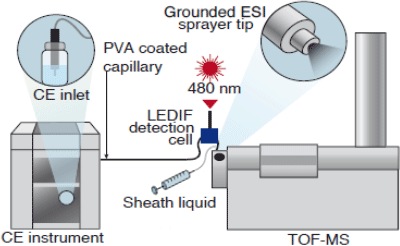
Figure 2. For accurate signal comparison, the online CE-LEDIF-MS system shows the very short distance (5 cm) between the LEDIF detector and the electrospray source.
 Enlarge
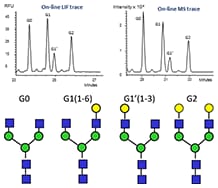
Figure 3. Online CE-LEDIF-MS analysis of rMAbs N-glycans labeled with APTS allowed us to combine results from both LIF and MS detectors.
Analysis 2: Characterization of glycans of monoclonal antibodies by online CE-LEDIF-MS
It is important to characterize the structure of carbohydrates on therapeutic proteins because they affect protein stability and mechanism of action. CE-MS technology with online LEDIF detection is a method of choice to detect major and minor peaks of glycans. Figure 2 shows a schematic of the instrumentation we used in recent studies. In this approach, the capillary inlet is placed in the inlet buffer, while the capillary outlet exits the instrument and is placed within an electrospray MS source. For online LEDIF, the detection cell is placed upstream of the electrospray tip, and is held in place by an adjustable arm.
For our analyses, we used PNGaseF for the enzymatic cleavage of glycans and then labelled the glycans with APTS (1-aminopyrene-3,6,8-trisulfonate). The APTS-glycans were purified and analyzed by CE-LEDIF-MS. Figure 3 shows that the major species G0, G1, G1′, and G2 were readily identified. In this arrangement, we obtained both LIF and ion intensity signals within the same analysis, which enabled accurate comparisons of the two traces.
Powerful results using Agilent 7100 CE system with Picometrics LEDIF
In this two-analysis study, CE-LEDIF technology provided accurate information about the purity of the rMAb samples and online CE-LEDIF-MS technology enabled successful direct identification of carbohydrate species. For more details about this powerful combination, explore Application Note 5991-4043EN.
>> Update My Profile | Subscribe to Access Agilent | Article Directory
Figure 1.
CE-LEDIF purity analysis for rMAb with five levels of CTB contamination. Impurities were quantified with good accuracy and precision. The insert shows a 100-fold zoom.