Access Agilent eNewsletter, March 2015
>> Update My Profile | Subscribe to Access Agilent | Article Directory
Effective methods for biotherapeutic analysis
By Sonja Schneider, Xiaomi Xu, and Phu Duong
Agilent Application Scientists
During production and purification, biotherapeutic antibodies can exhibit changes in charge heterogeneity caused by amino acid substitutions, glycosylation, phosphorylation, and other post-translational or chemical modifications. In protein analysis, charge variations at a given pH indicate a change in the primary molecular structure – resulting in additional forms of the protein. These changes can affect stability and activity – or cause immunologically adverse reactions. The analysis of charge variants is a critical factor in biopharmaceutical development. In this article, our experts share some testing approaches to increase your understanding of biotherapeutic analysis.
Why is glycosylation analysis important?
The glycosylation profile of recombinant therapeutic glycoproteins is an important parameter that affects their safety, efficacy, and consistency. In addition to the glycosylation pattern analyzed using HILIC, the glycan charge profile can be assessed using anion-exchange chromatography. The charge profile of N-glycans shows the distribution of N-glycans containing different numbers of anionic sugars, which can include neutral, mono-, di-, tri-, tetra-, and higher-charged glycan structures. Glycan charges are usually due to sialic acids, or more rarely can result from phosphorylation or sulfation of monosaccharide units within the glycan structure.
Two types of sialic acid residues occur within the N-glycans attached to proteins expressed in mammalian cells, namely N-acetyl-neuraminic acid (NeuAc) and N-glycolylneuraminic acid (NeuGc). These structures usually attach to galactose residues at the non-reducing termini of N- and O-linked glycans. NeuAc is the normal sialylation that occurs in human proteins, whereas NeuGc occurs in non-human mammalian proteins and is undesirable in therapeutic glycoproteins. The glycan charge profile is an important parameter for biotherapeutic protein monitoring that supplements the HILIC profile, to increase understanding of sialylation and identify the presence of potentially undesirable sialic acid residues.
 Enlarge
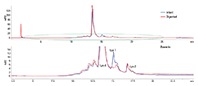
Figure 1. Charge profile of bovine fetuin. The structures are examples of differently charged/sialylated N-glycans, typically occurring in fetuin.
 Enlarge
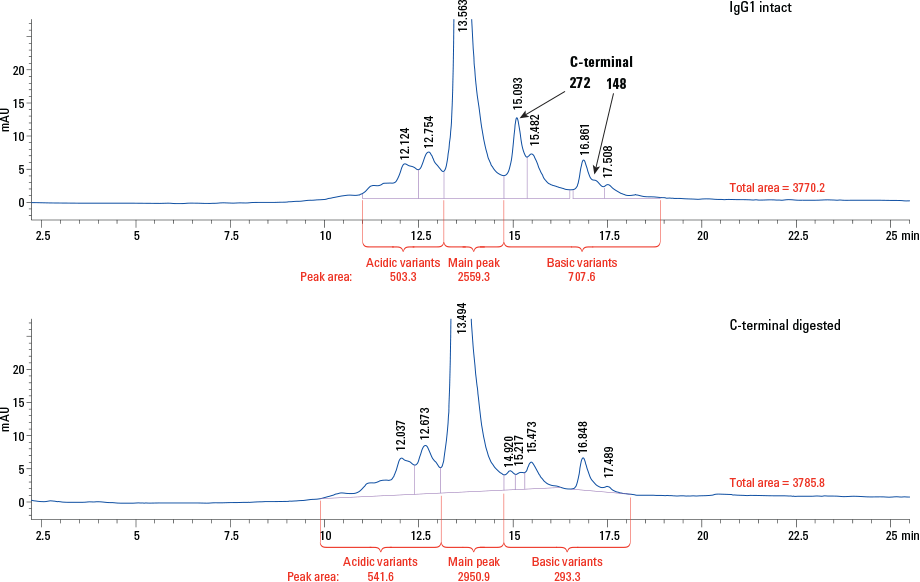
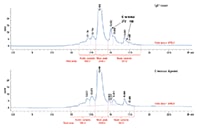
Figure 2. Separation of intact and C-terminal digested IgG1 using an Agilent Bio MAb 5 µm column in an Agilent 1260 Infinity Bio-inert Quaternary LC.
 Enlarge
Figure 3. Composition of C-terminal digested IgG1.
In our first example, N-glycans from fetuin were enzymatically cleaved and subsequently labeled with 2-aminobenzamide, following cleanup using HILIC cartridges. The glycan charge profile was determined using an Agilent Bio SAX column in an Agilent 1260 Infinity Bio-inert Quaternary LC. Figure 1 shows the charge profile from bovine fetuin, separating neutral (peak 1), mono- (peak 2), di- (peak 3), tri- (peak 4), tetra- (peak 5), and penta-sialylated (peak 6) N-glycans. The structures next to the peaks represent differently charged glycans with zero to five sialic acids that typically occur in bovine fetuin. The peaks were very well resolved and the precision of the analysis was excellent, with relative standard deviations of < 0.002% for retention time and < 10% for area precision. Learn more from this analysis in the free Agilent publication 5991-5221EN.
High-resolution IgG1 analysis with Agilent column
Monoclonal antibody/IgG1 (mAb) is a biotherapeutic that has gained popularity during the past decade. Due to its structural complexity, IgG1 usually demonstrates a high degree of heterogeneity, which includes various post-translational modifications. Among these, variable levels of C-terminal lysine on the heavy chain are commonly present. The degree of heterogeneity of C-terminal lysine variants indicates manufacturing consistency and, therefore, should be assessed. The cation exchange Agilent Bio MAb 5 µm column offers the selectivity required to achieve high-resolution IgG1 analysis, particularly when used with the Agilent 1260 Infinity Bio-inert Quaternary LC.
For this application, we used carboxypeptidase B to cleave basic amino acids, such as lysine and arginine, from the C-terminus of IgG1. By comparing the chromatograms of intact and C-terminal digested IgG1, C-terminal lysine on IgG1 can be identified. Figure 2 shows the overlay of intact and C-digested IgG1 chromatograms. The top panel is the entire chromatogram and the bottom panel is an enlarged area. The early eluting peak at approximately 2 minutes corresponds to carboxypeptidase B. There are four basic variant peaks on IgG1 from the original and two peaks from lys-1 and lys-2 lysine variants. The peak areas of the variants represented about 8.64% and 1.34% of the total peak area (Figure 3). The reproducibility of the analysis was tested with 10 injections of IgG1. It was evident that retention time, peak shape, and peak area were highly consistent. Check out Agilent Application Note 5991-0895EN for a complete description of this work.
Agilent offers a wide range of solutions for biotherapeutic analysis
As shown in the examples discussed, Agilent 1260 Infinity Bio-inert Quaternary LC System delivers good peak shapes, handles challenging solvent conditions with ease, such asditions with ease, such as extreme pH values of pH 1 to pH 13, and buffers wit. Corrosion-resistant titanium in the solvent delivery system and metal-free materials in the sample flow path create an extremely robust system that delivers accurate test results.
Agilent builds reliable instruments that provide accurate, reproducible results. Why not take a few moments now to explore our wide range of solutions for biologics and biosimilars. Then contact your Agilent Sales Representative for your free copy of our new wall chart A Complete Set of Tools to Accurately Characterize Your Protein.
>> Update My Profile | Subscribe to Access Agilent | Article Directory