Access Agilent eNewsletter, August 2014
>> Update My Profile | Subscribe to Access Agilent | Article Directory
Easy, effective, reproducible NMR solvent suppression with fully-integrated Agilent solution
By Péter Sándor
Agilent Applications, NMR Applications Scientist
Nuclear Magnetic Resonance (NMR) spectroscopy is a powerful way to analyze complex mixtures like biofluids, biological extracts, and food products. These samples are typically analyzed in their natural form, allowing only 5-10 % deuterated water (D2O) to be added for magnetic field stabilization. The huge difference in solvent and solute concentrations presents a challenge in proton detection experiments. To maximize the information of the NMR spectrum, the intensity of the solvent signal must be dramatically reduced in an easy, effective, and reproducible way.
Effective water suppression in 1D and 2D experiments
Water suppression is effective when the solvent does not limit the dynamic range of the receiver, and the signal attenuation in the rest of the spectrum is at an absolute minimum. Many solvent suppression schemes are published, but none are universally applicable. Agilent’s VnmrJ software provides a set of the most efficient and frequently used methods, letting users select the ideal one for any sample.
Satisfactory solvent suppression cannot be achieved without optimum line shape and resolution. VnmrJ’s new VeriPulse feature automatically shims the magnet to optimal field homogeneity using 3D shimming algorithms, and maintains resolution and line shape performance.
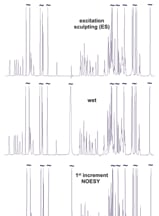
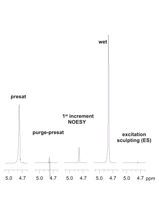
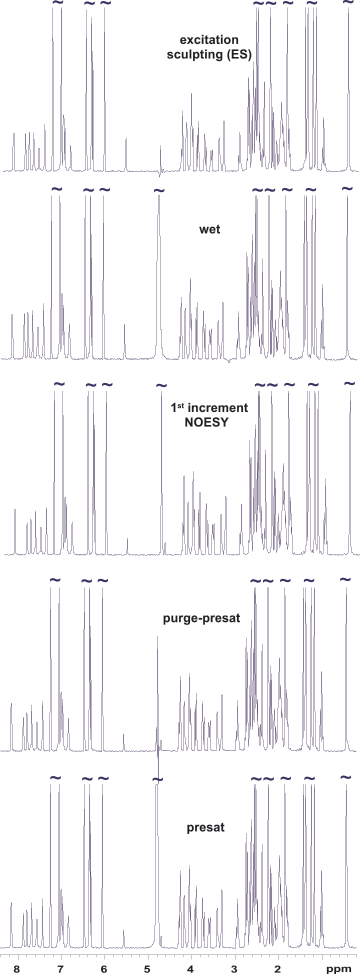
Figure 1 compares solvent suppression efficiency of different methods supported in VnmrJ software using an Agilent ProPulse spectrometer and OneNMR probe. Vitamin B12 has a signal at 4.71 ppm (0.07 ppm from the water resonance), making it an ideal test sample. It also has NH and OH groups covering a wide range of exchange rates from slow to fast. The bottom three spectra were run with variants of solvent presaturation, the oldest and gentlest approach relying on a system’s lineshape performance. Note that the signal at 4.71 ppm is retained at the right tail of the residual water signal. WET (Water suppression Enhanced through T1 effects) solvent suppression is useful when signals in fast exchange with the solvent (like the OH proton at 5.57 ppm) need to be monitored. Excitation sculpting (ES) is probably the most efficient and user-friendly suppression scheme when signal attenuation in an 〜0.5 ppm range around the solvent signal can be tolerated. The residual water amplitude is the smallest with ES (Figure 2).
 Enlarge
Figure 1. Water suppression efficiency using different schemes on a 7.5 m molar vitamin B12 sample dissolved in a H2O/D2O mixture of 9:1.
 Enlarge
Figure 2. Residual water amplitudes from the Figure 1 spectra.
 Enlarge
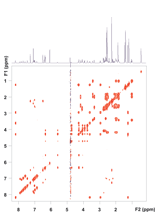
Figure 3. zTOCSY spectrum of vitamin B12 using the purge-presat solvent suppression scheme. Note that all correlation peaks of the proton at 4.6 ppm are visible both in the F1 and F2 dimensions. (Raw data are shown.)
 Enlarge
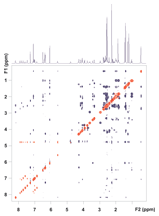
Figure 4. ROESY spectrum of vitamin B12 using the ES solvent suppression scheme. No digital solvent suppression filter was applied. Correlation peaks from the proton at 4.6 ppm are retained in the F1 dimension.
After solvent suppression parameters were optimized on a 1D setup spectrum, Agilent VnmrJ software automatically passed them to all subsequent 1D or 2D experiments requested on the same sample. The zTOCSY spectrum (Figure 3) was run with purge-presaturation using a RF amplitude of 45 Hz. The 2D TOCSY spectrum, like all spectra shown here, reflects the raw experimental data and was not subjected to a post-acquisition solvent suppression filter. The presaturation schemes and WET are typically used prior to the NMR pulse sequence and their efficiency is retained if water cannot recover during the pulse sequence through radiation damping. The strong RF field used in TOCSY-type 2D correlation experiments locks the solvent magnetization, rendering radiation damping ineffective. However, in rotating frame homonuclear Overhauser experiments (ROESY), the spin-lock field is too weak to achieve that. No matter how successful solvent suppression is at the beginning of the experiment, by the time of signal detection, the solvent magnetization recovers. This is when ES is particularly useful, as the ES block is sandwiched by the pulse sequence and signal detection, and the solvent resonance has no time to recover.
The ROESY spectrum in Figure 4 validates this. The solvent suppression is very efficient in the detected dimension (F2) but, simultaneously, all ROE and exchange correlation peaks with the solvent and with signals in the direct vicinity of water are fully retained in F1.
When a mixture of protonated solvents is used, solvent suppression schemes can easily be tailored to suppress multiple solvent signals.
Effective solvent suppression is often critical for NMR analysis of biological samples. Agilent VnmrJ software enables rapid and reliable application of a range of suppression techniques to maximize spectral dynamic range.
Agilent ProPulse: Bringing the power of NMR to researchers of all skill levels
The ProPulse NMR System brings the power of NMR to researchers of all types. Agilent’s superior VnmrJ software makes it easy to get results by providing each user with just the right tools to support their goals and level of expertise.
Agilent ProPulse delivers the highest quality data and unrivaled simplicity for highly-productive experimental setup, optimization, and data collection. For further information, view our video, Agilent ProPulse NMR System – the Heart of Simplicity.
Agilent is committed to improving the entire NMR user experience. Discover the complete line of Agilent NMR solutions for analyzing both small- and large-molecule compounds in research and industrial applications.
>> Update My Profile | Subscribe to Access Agilent | Article Directory
Figure 1.
Water suppression efficiency using different schemes on a 7.5 m molar vitamin B12 sample dissolved in a H2O/D2O mixture of 9:1.