Live Cell Imaging
April 2019
Microscopy is a useful tool for cell biologists to better understand the diverse, complex and dynamic processes cells use to function. Often it is difficult to ascertain these processes using a single time point by fixing cells to enable easy imaging. Hence the desire for many cell biologists is to visualize and quantify cell behavior in real time by live cell imaging. This desire brings many complexities to the experiment including the need to maintain cell health over long experiment times or rapid imaging for fast kinetic responses.
In this issue of TekTalk, we will illustrate how the Lionheart Automated Microscope can perform both fast kinetics to quantify small molecule activation of GPCR induced calcium flux as well as assess the compound's detrimental effect on cellular stress on a longer time frame. In addition, we can demonstrate the utility of both imaging and PMT-based microplate reading in the BioSpa Live Cell Analysis System for performing cell proliferation experiments, while at the same time monitoring the pH of the environment the cells are experiencing. The pH measurement indicates when media exchange should be performed for long term kinetic experiments.
Finally, we provide a number of cell culture tips suitable for live cell imaging.
Featured Applications
Thapsigargin-induced Cellular Stress Response and Inhibition of Gq-dependent Calcium Signaling
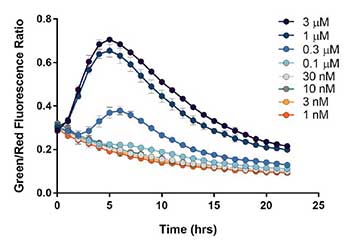
Here we use a novel endoplasmic reticulum stress sensor and an automated imaging-based approach to evaluate chemically-induced cell stress by thapsigargin, a potent SERCA pump inhibitor, while simultaneously measuring its effects on Gq-mediated cell signaling. These results reveal that cell stress induced by thapsigargin is detected an order of magnitude prior to any changes in cellular proliferation. Kinetic monitoring of cell stress levels demonstrates the reversible nature of the stress sensor.
Monitoring pH in Long-term Proliferation Assays
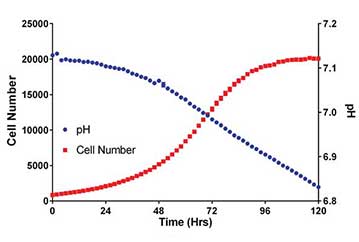
Media formulations for the propagation of in vitro tissue culture often contain the pH Indicator dye phenol red. We have previously shown that phenol red absorbance can be used to determine pH in cell cultures. Here we describe the use of the Cytation 5 Cell Imaging Multi-Mode Reader to monitor culture media pH via absorbance measurements, during multi-day imaged-based cell proliferation assays.
Product Spotlight
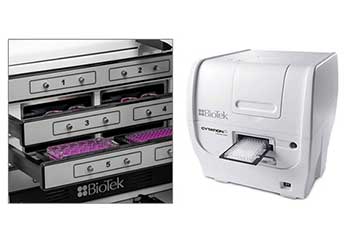
BioSpa Live Cell Analysis System
The BioSpa Live Cell Analysis System offers unique benefits for a wide variety of live cell imaging applications. You can easily capture detailed cellular images and get in-depth cell-level analyses for migration and wound healing assays, 3D spheroid formation and many other kinetic applications in up to 8 microplates or other labware. Built-in scheduling, temperature control, CO2/O2 control and humidity monitoring provide the ideal environment for live cells, allowing you to walk away with confidence, and enables multiple users to run processes without disruption. With up to 60x magnification, patented laser autofocus and advanced cell-level analysis including nuclear and cytoplasm masking define critical, information-rich regions of interest, the BioSpa Live Cell Analysis System offers efficient, powerful automation for your live cell workflows. Add a BioTek washer or dispenser to the system for convenient sample prep and maintenance.
Tek Tips
Why use live cells?
Using live cells allows researchers to define and control experimental parameters that are in many cases, more physiologically relevant than using a snapshot from endpoint, fixed cells. This method can also circumvent many artifacts seen in endpoint studies. When studying live cells, many cellular events happen that endpoint imaging may not capture. Yet when using live cells there are many conditions and parameters to consider.
What cell types to use? What are the best environmental conditions? Will those conditions affect my live-cell imaging?
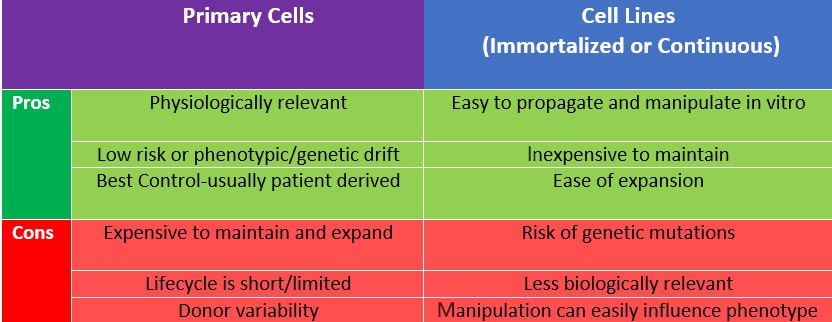
Cell Type Selection There are two broad categories of cells used in culture: either immortalized cell lines or primary cells, and there are pros and cons to both cell types. Whichever cell type you choose, using cell lines to standardize and confirm your experiments, while further validating with primary cells and using them as controls for those experiments, is key. Starting with a trusted cell line source is also crucial to success. You can obtain validated cell lines from clear lineages from a variety of repositories including ATCC, Riken Biomedical Institute and Coriell Institute for Medical Research. These also now include some fantastic tools including CRISPR/Cas9 and fluorescently labeled cell lines.
Optimization of environmental conditions-
Adherent Cells vs Suspension cells-
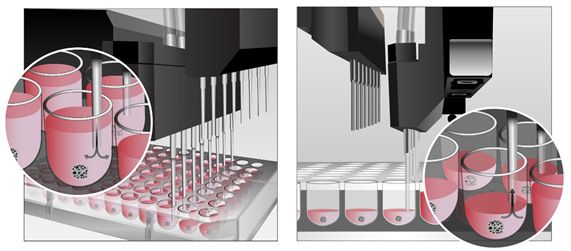
Depending on your live-cell model, you will choose adherent or suspension cells and there are several conditions to consider when plating your cells. The vast majority of cell types, both primary and cell lines, are anchorage-dependent and require adhesion cues as well as instructive cues to mimic their natural environment in vitro. Testing several published vessel-coating substrate combinations with your cell line will ensure you are using the most optimal scaffold conditions during your live-cell experiments. Many microplate vendors offer pre-coated or tissue culture (TC) treated plate types to start your experiments. Although adherent cells require periodic passaging, they are easily observable under a microscope. Although there are fewer suspension cell types, they are easily passaged, scalable, and are used for batch harvesting and bulk protein production. Keep in mind what conditions are required for your cells to remain in suspension such as low and ultra-low attachment vessel coatings and agitation. Many researchers hesitate to work with live, suspension cells due to their potential for loss of cells when exchanging media. The new AMX module for the MultiFlo FX, designed to exchange media with suspension cell types as well as spheroids, is another great tool that helps prevent loss or disturbance of floating cells or spheroids.
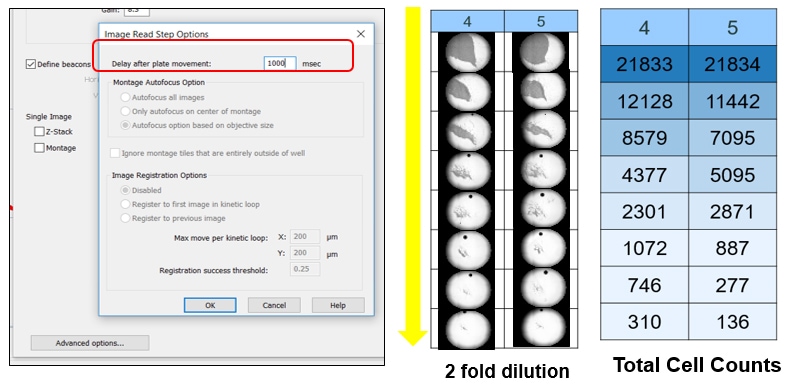
In addition, many instruments have trouble imaging suspension cells in an automated way, making them cumbersome to work with. In the Gen5 software, using either the Lionheart FX or the Cytation, the user can also modify image capture for both adherent and suspension cell types. For any suspension cells or suspended spheroids, increasing the delay in the plate movement ensures the cells are not moving while imaging.
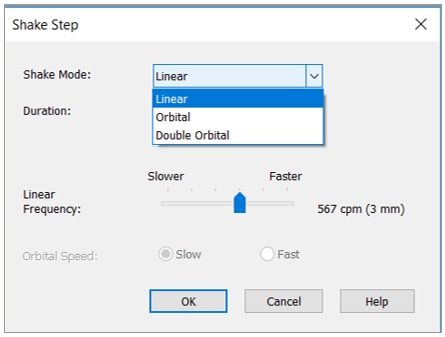
If you have suspension cells that tend to aggregate and you need to agitate before imaging, Gen5 also offers three shaking modes.
Growth, Environmental Control and autofluorescence-
Working with live cells often requires temperature and gas (CO2/O2) control. Mammalian cells in a bicarbonate-based media require 5% CO2 in order to maintain proper physiological pH. Cells are negatively affected without proper pH and CO2 within five minutes. Likewise, you can mitigate some of these effects by adding 25 mM HEPES buffer to your media at a pH of 7.4, but this will only stave off adverse effects for about 10 hours, depending on your cell line. Having a reliable CO2 source and temperature of 37°C is best when imaging live-cell cultures. It is also important to know how long your live-cell experiment should run for in order to achieve the best possible results. Performing an initial assay development run and working out your live-cell conditions first, will allow you to better understand aspects of your live cell culture such as seeding density, cytotoxicity, doubling time, transfection incubation periods, and total kinetic time. This will allow you to troubleshoot experimental testing issues downstream much more easily. You will also need to work out what your media should contain. Media often contains compounds that result in autofluorescence while imaging on a microscope such as riboflavin, phenol red, and tryptophan. When exploring options for your media reagents, find out which channels are affected by your reagents by imaging in your media alone. Usually you can supplement with other compounds or use phenol red-free media during the imaging session you need and then replace with your normal media after imaging.
Check cell health during your imaging session-
Running a live-cell cytoxicity assay during your imaging session will allow you to determine if any of the experimental conditions are effecting your cell health. You can also monitor cell morphology to check cell health. Looking for cellular changes such as blebbing and observing vacuole and mitochondrial function and morphology changes will help you determine if you cells are healthy.
Optimization for better live cell microscopy results-
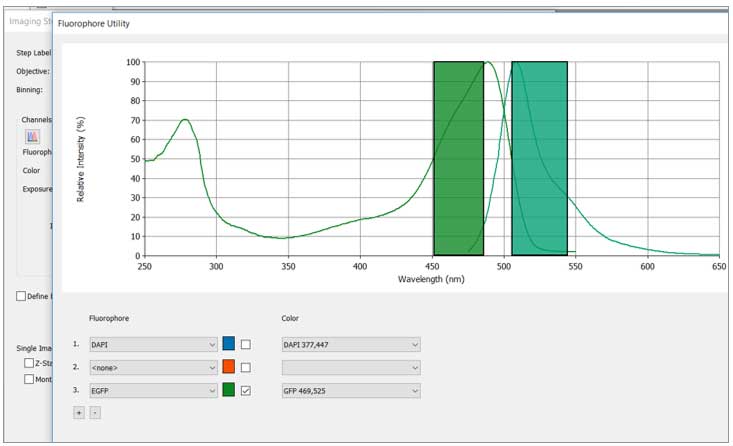
Improving your signal to background ratio (S/B) before imaging is the most important step in setting up your live-cell experiments if you are using fluorophores. Choosing the correct fluorescence channels is key when planning your experiments. Checking your excitation and emission of the fluorophores you are working with, and which filter set they correspond to in your instrument, is key. Some multi-channel combinations also result in crosstalk and it is critical to your S/B and experimental success to check these combinations. Imaging first with single colors and then checking your multi-channel imaging can determine how much bleed through and crosstalk you actually have. There are also many spectral viewer sites to choose from like BDspectraviewer and FPbase.
You can also check whether you will have crosstalk between channel combinations using Gen5's fluorophore utility guide by clicking on the spectra viewer icon (right) and entering in your specific fluorophores.
Phototoxicity often occurs when the cells are bombarded by UV-light. If using certain probes, such as Hoechst, for longer than a few hours, you could be inducing cytotoxic effects and DNA damage on your cells. There are many new red-shifted, Cy5 channel options for live-cell nuclei and cytoplasmic markers such as Sir-DNA which can be used for longer, live-cell experiments. These options are typically gentle on your cells and have no cytotoxic effects. However, thorough testing should be done with your dye or probe in your cell line before moving on to any extended experimentation.
Use BioTek's Cytation Cell Imaging Multi-Mode Readers for Seahorse XF Data Normalization
Agilent's Seahorse XF Analyzers are now integrated with BioTek's Cytation Cell Imaging Multi-Mode Readers, providing an easy-to-use, cell count based normalization solution for XF data comparison. The Agilent Seahorse XF Imaging and Normalization System combines cellular metabolic analysis and digital microscopy imaging into an intuitive workflow for normalizing XF data. Rapid cell count based normalization enables reliable, validated, meaningful well to well, plate to plate, and experiment to experiment XF data comparison.
Cell culture conditions are monitored before and after XF assays, facilitating easy identification of sample errors and outliers. Better quality control results in improved XF data integrity and live cell assay reproducibility. The unified XF Controller controls both BioTek and Seahorse instruments, simpifying the workflow. Users capture and export brightfield and fluorescence images, along with cell count data, to Wave software for rapid, accurate cell count normalization.
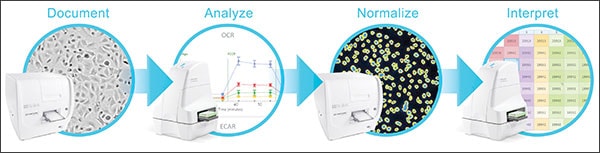
It's a simple four step process:
- First, brightfield scans in the Cytation document sample quality.
- Next, the plate is placed in the XF Analyzer and the metabolic analysis assay is run.
- The plate is then placed back in the Cytation where a fluorescence scan counts cells, then passes the scan and cell count information to Wave software for normalization.
- Finally, XF metabolic analysis data, normalized cell counts and brightfield and fluorescence images are linked together in an XF result file, ready for analysis and interpretation in Wave.
Normalizing your XF data to account for cell number or sample variation makes it easier to compare data across wells, plates and experiments enabling you to confidently draw meaningful conclusions.
View the related application note: XF Data Normalization by the Agilent Seahorse XF Imaging and Normalization System Application Note
Accurate quantitation of cell culture density
Cell culture density is an important variable to consider during routine maintenance of cell lines, as well as for optimizing downstream applications. Frequently, cell culture density is approximated by visually inspecting a small area of the culture vessel and subjectively assigning an overall confluence. Automated image analysis provides a much more accurate and consistent method for determining cell density (Figure 1).
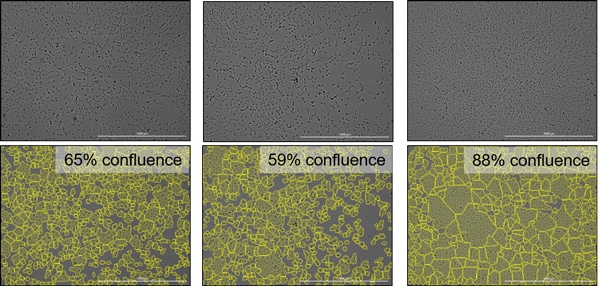
Figure 1. Automated image analysis provides accurate and objective confluence measurements.
Large cell culture areas, such as T75 flasks or multiwell dishes, can be quickly imaged and analyzed to determine the average cell density and variance across the culture area (Figure 2).
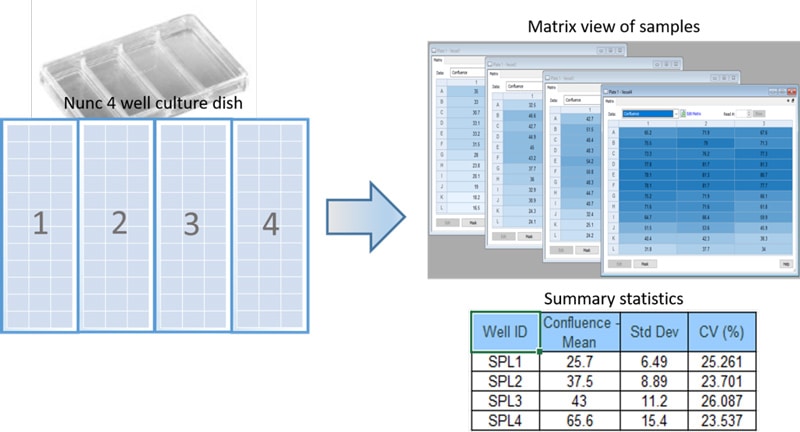
Figure 2. Average cell density and variance statistics are automatically calculated and reported by Gen5.
This automated method allows researchers to quickly and accurately determine cell densities within diverse culture vessels, providing valuable information for cell culture quality control applications and optimizing cell-based assays.
Live Cell Imaging Resources
Application Notes
- Live Cell Imaging of Apoptosis and Necrosis(BioSpa 8, Cytation 5)
- Characterizing Calcium Mobilization Using Kinetic Live Cell Imaging(Lionheart FX)
- 3D Spheroid-based Tumor Invasion Assay(BioSpa 8, Cytation 5, MultiFlo FX)
Visit our Live Cell Imaging application page to see more Live Cell Imaging applications from BioTek instruments.
Webinar
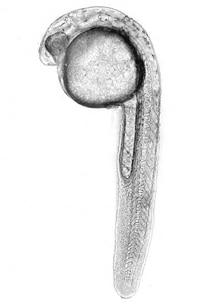
Zebrafish Imaging with Quantitative Analysis
Speaker: Sarah Beckman, PhD., Principal Scientist
Zebrafish are a powerful vertebrate model for many avenues of biological research, including developmental biology and pathology. Due to their small size and optical clarity, they are uniquely amenable to imaging studies. In this webinar we will describe how automated digital microscopy and quantitative image analysis can be applied to zebrafish research focusing on three common areas of study including angiogenesis, toxicology and cell death.
For Research Use Only. Not for use in diagnostic procedures.