Live Cell Imaging
May 2022
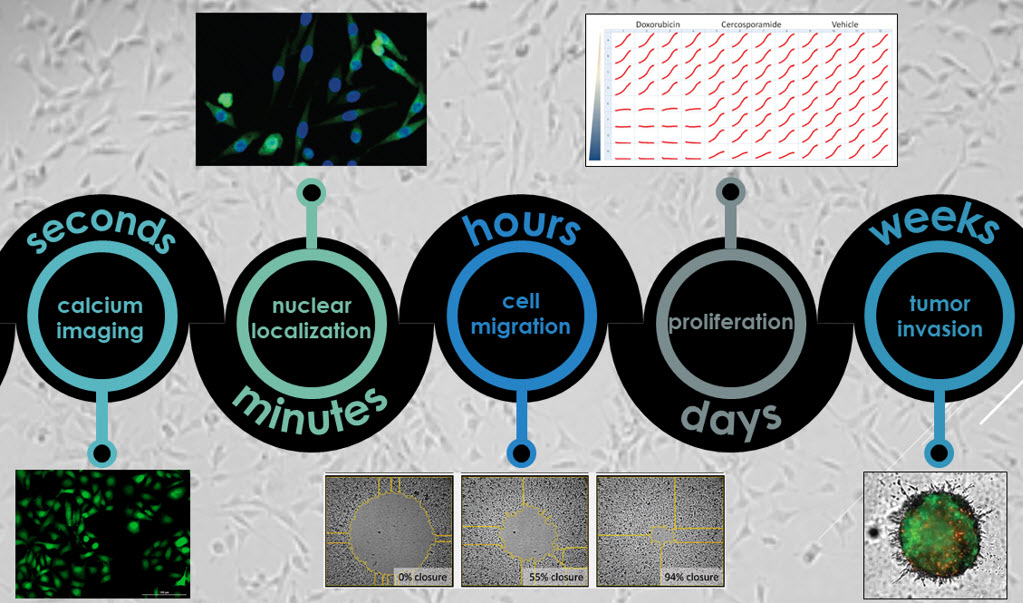
Live cell microscopy is an essential tool in the life sciences toolbox. Kinetic microscopy provides invaluable insights into cellular behavior that are elusive or impossible to evaluate through endpoint measures. Furthermore, many cellular processes fluctuate on timescales that are simply too short for reasonable accommodation in endpoint assays. In this edition of TekTalk, we are covering both conceptual and practical considerations for successful live cell imaging investigations that leverage the combination of Agilent BioTek’s imaging instruments and software.
Short-term live cell kinetic microscopy considerations
One of the key practical considerations for live cell analysis involves ensuring that the samples and processes under investigation remains as physiologically relevant as possible. For live cell kinetic imaging sessions, this relevance is preserved by the instrument’s environmental controls, such as through temperature, gas and humidity control. Agilent BioTek imaging instruments automatically control environmental needs to support both short-term (minutes to hours) and long-term (days to weeks) live cell kinetic microscopy workflows. For many short-term kinetic evaluations, triggering the biological events to be investigated is an essential part of the workflow. Reagent additions can be automatically integrated into kinetic imaging sessions using the Agilent BioTek injector system and streamline the investigation of rapid live events, increasing reproducibility across investigations. Tips on how to leverage this capability using Agilent BioTek Gen5 software features are highlighted for short-term imaging applications.
Long-term live cell kinetic microscopy considerations
For long-term imaging sessions, maintaining physiological relevance and the proper interpretation of results involves additional conceptual design considerations. Long-term mammalian cell culture imaging often involves monitoring changes in one or more fluorescence signals that provide a readout of a cellular process of interest. Over time, different treatment conditions often show varying effects on cellular proliferation, and changes in cell numbers may complicate the interpretation of the fluorescence signals of interest that are quantified and compared. Monitoring cell proliferation can be accomplished using fluorescent labels, such as live cell nuclear stains, throughout long-term kinetic studies. Alternatively, label-free cell counting methods to monitor cell proliferation can avoid the confounding effects of cellular toxicity observed when using label-based cell counting methods. Normalization of cellular signals using Agilent BioTek’s high-contrast cell counting method allows for consistent quantification and comparison of signal changes between experimental conditions. Tips on long-term live cell imaging experiments and examples of how to use normalization to achieve proper quantification are highlighted.
Featured Applications
Characterizing Gs- and Gi-Dependent Regulation of cAMP Levels in Real Time with cADDis Biosensor and Automated Live Cell Imaging
The second messenger cAMP is involved in diverse cellular processes. The Gs and Gi family of proteins regulate the cAMP-dependent signaling pathway in response to associated G protein coupled receptor (GPCR) activation. In this study, kinetic live cell imaging was used to monitor cAMP levels in HEK293 cells expressing a cAMP biosensor while stimulating D2, M2R, and β2 receptors. Furthermore, automated image analysis was used to characterize Gs- and Gi-dependent changes in cAMP levels over time and determine pharmacological dose-responses.
Automated Kinetic Imaging Assay of Cell Proliferation in 384-Well Format
Evasion of cell death is a hallmark of cancer cells that allows them to overcome endogenous barriers to cancer development, as well as to resist treatment. Understanding how cancer cells are able to evade cell death promises to unlock new avenues to treat human cancer. This application note presents a fully automated image-based assay to monitor both the proliferation and cell death of a fibrosarcoma cancer cell line in response to multiple antineoplastic drugs in a high-throughput format.
Product Spotlight
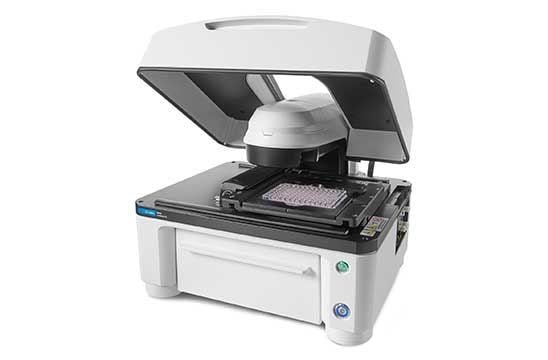
BioTek Lionheart FX Automated Microscope
The Agilent BioTek Lionheart FX automated microscope offers up to 60x air, 60x and 100x oil immersion magnification, with fluorescence, brightfield, color brightfield, and phase contrast channels. Incubation to 40 °C, CO2/O2 control, and a humidity chamber optimize conditions for long-term live cell imaging applications. An available dual reagent injector facilitates rapid kinetic assays.
Tek Tips
Gen5 Well Mode Imaging combined with Reagent Injector Module allows for Visualization and Quantification of Rapid Kinetic Changes
Kinetic imaging requiring a fast frame rate, such as Ion Channel Assays, should be performed using Gen5 Well Mode kinetic imaging and the reagent injector module. This set-up allows for images to be rapidly captured in a single well after reagent addition before moving to the next well to perform reagent injection and imaging. Figure 1 below shows a well-mode kinetic imaging protocol set up with injection (dispense) in the Gen5 software. The kinetic imaging and injection steps are defined inside the ‘Well Mode’ brackets.
- Be mindful of the integration time (exposure time) set for the imaging channel when looking to image rapid kinetic changes. Decreasing the integration time and turning on ‘capture binning’ allows for faster frame rate imaging.
- When assessing a rapid change after reagent injection, it is important to acquire images before reagent injection to establish a baseline (see Figure 1).
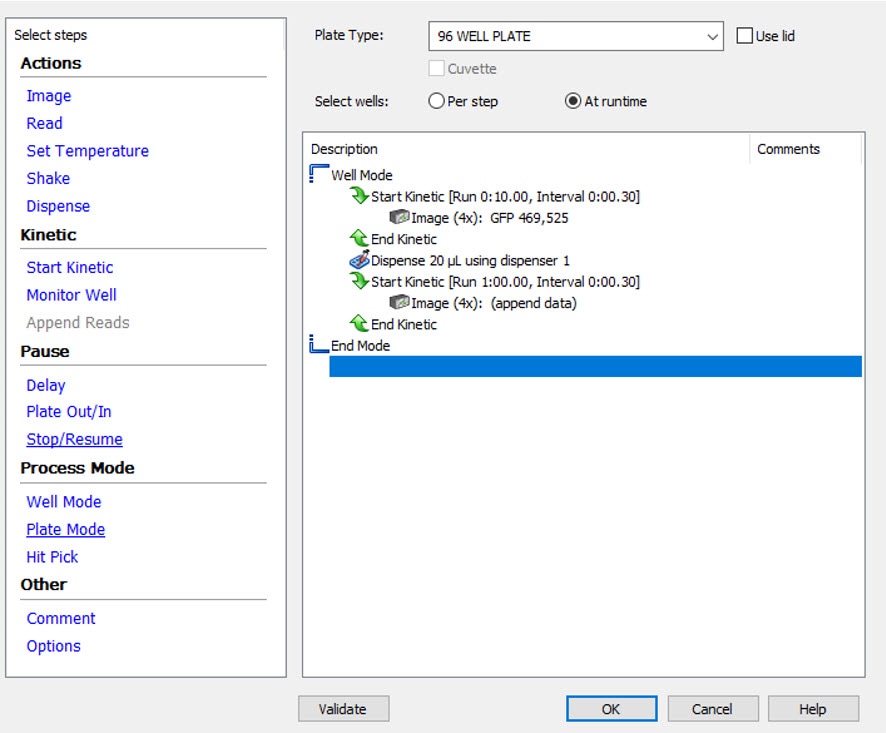
Figure 1. Well Mode Kinetic Imaging in Gen5
To set up well mode kinetic imaging, ‘Well Mode’ is selected under the ‘Process Mode’ in the Gen5 procedure window. Then, ‘Start Kinetic’ is used to define two kinetic imaging reads, one shorter one before the reagent dispense step, to establish a baseline, and one after the dispense step to monitor changes. The data from the second imaging step is automatically appended to the first imaging step.
- When analyzing kinetic data in Gen5, data can be automatically normalized to the baseline acquired before reagent injection. After deciding how all images are to be analyzed, using either cellular analysis or image statistics, a kinetic analysis step can be defined in the Gen5 data reduction window (see Figure 2A). This allows for the average signal from baseline images to be easily calculated. Once this step is added, a ‘Ratio Transformation’ step can be performed (see Figure 2B) for automated normalization of all data points to the baseline calculated in the kinetic analysis step.
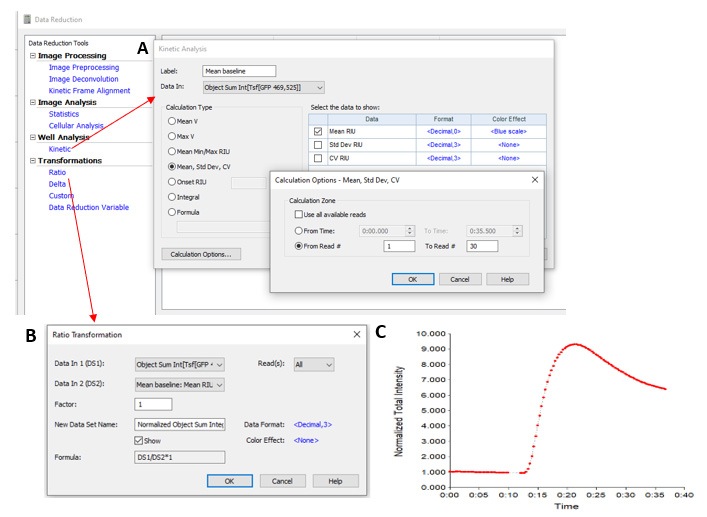
Figure 2. Gen5 Kinetic Analysis for Baseline Normalization
To normalize data, such as fluorescence after reagent injection, to the baseline signal before reagent injection, a kinetic analysis step should be performed inside Gen5 (A). Using a kinetic analysis step, the software can automatically calculate the average signal from all images captured during the baseline imaging (before reagent injection). This software calculated data output (mean baseline) is then used in a ‘Ratio Transformation’ step to normalize all data (B), and curves of this normalized data are automatically displayed in the software (C).
Long-term live cell imaging
Fluorescent nuclear markers
When performing live cell imaging assays, it is crucial to consider the overall viability of your biological sample. Hoechst is a commonly used nuclear marker that binds into the minor groove of A-T rich regions of DNA. Because it readily passes through both the plasma membrane and nuclear envelope, it is an ideal fluorescent dye for live-cell imaging. However, it is important to keep in mind the following:
- At high concentrations, Hoechst 33342 inhibits proliferation rates (Figure 4A), which correlates with increased necrotic cell death, as assessed using propidium iodide (not shown).
- Recommendation: when supplemented in the culture medium during a kinetic read, we recommend using it at or below 100 nM (~60 ng/mL).
- Caution: using Hoechst at low concentrations ensures cell viability, however attaining sufficient signal requires an extended incubation time (3-4 hours), and the Signal-to-Noise Ratio (SNR) might not be as robust as ideal. Sustained exposure to high-energy UV light via increased LED intensity or integration time can have phototoxic effects. Therefore, adjusting Digital Gain first may be a suitable alternative before adjusting these other capture settings.
- Use of a far red-shifted nuclear marker, such as DRAQ5, which is imaged using the CY5 imaging channel, can also help overcome the negative effects of Hoechst 33342, as probes imaged in the red spectral range have far less phototoxic effects over time.
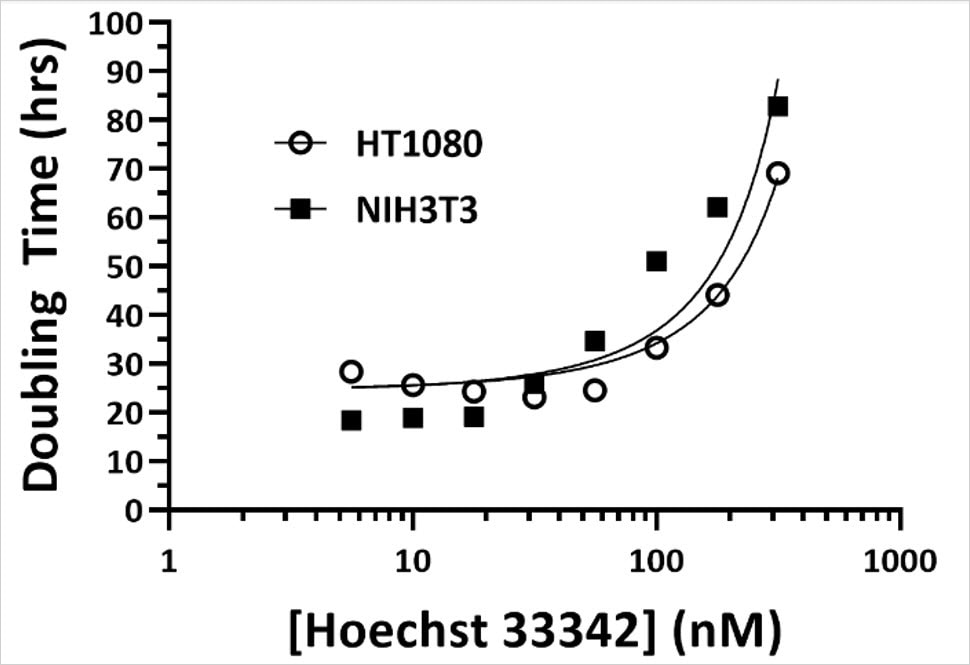
Figure 3. Effect of increasing Hoechst 33342 concentrations on doubling time of HT1080 and NIH3T3 cell lines, as measured using High Contrast Brightfield (HCBF).
Normalizing cell signals to account for cell proliferation during long-term imaging
The High Contrast Brightfield (HCBF) cell counting method uses transmitted light and specialized optics to achieve accurate cell counts as an alternative to fluorescent live-cell stains. This method is available for both the Lionheart and Cytation imager instruments and can readily be employed to monitor cell proliferation during long-term live-imaging assays.
- Recommendation: Some cell types are less amenable to the HCBF cell counting method due to their morphological phenotype, such as highly clustered cell types. It is necessary to establish HCBF parameters for your cell type of interest.
- Caution: Accurate cell counts are essential for the correct representation of long-term imaging assay results. However, cell counts based solely on the fluorescent signal representing a treatment effect can be vulnerable to misinterpretation.
As an example, Figure 4 represents an application where fluorescent dyes were used to evaluate apoptosis in response to varying concentrations of anti-neoplastic drugs over three days. Apoptotic cell counts were determined by quantifying fluorescently labeled cells stained by the pSIVA apoptosis marker, and total cell counts were determined independently in Gen5 using the HCBF cell counting method. Evaluating the drug effect using only the absolute counts from the fluorescent channel resulted in EC50 values that varied depending on the time point investigated (Figure 4A, lower panel). This erroneous conclusion is corrected using HCBF to account for differences in total cell populations across the different treatments. After normalization, EC50 values remain consistent over time (Figure 4B, lower panel).
Note: Normalization is accomplished automatically in Gen5 by dividing the apoptotic cell counts by the HCBF cell counts and expressing the result as the percentage of apoptotic cells.
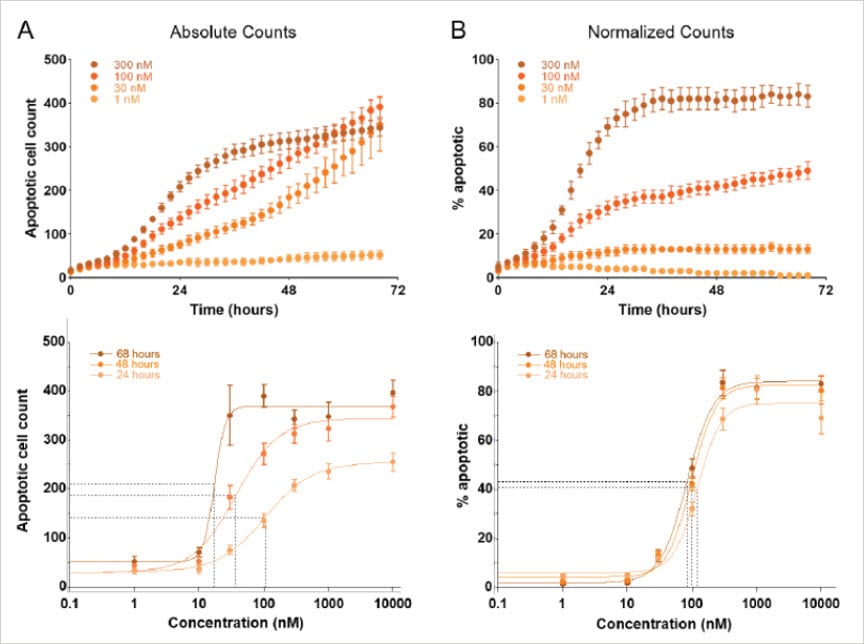
Figure 4. Comparison of anti-neoplastic drug effects on apoptosis before (A) and after (B) normalization to total cell counts. Normalization of the fluorescence signal (apoptotic cell counts) to the total number of cells is essential to determine the accurate and consistent EC50 value over time.
Live Cell Imaging Resources
Webinars OnDemand
- A Practical Guide for 3D Cell Culture Systems and Optimizing Spheroid Imaging Assay - Part 1
- A Practical Guide for 3D Cell Culture Systems and Optimizing Spheroid Imaging Assay - Part 2
- Cytation C10 Confocal Imaging Reader: A Overview of the Unique Combination of Imaging and Detection Modes that Support a Broad Range of Cell Analysis Applications
- Techniques for Improving Cell Culture Quality Control and Assay Optimization
Application Compendiums
Webinars
Overcoming Pitfalls in Live Cell Imaging
Presenters: Jamie Stern, PhD. and Allison Cross, PhD., Field Applications Scientists
Wednesday, June 1, 2022, 12 PM EDT
The study of complex and dynamic cellular behaviors requires monitoring of cells in real time. Depending on the cellular behavior of interest, these studies may involve monitoring rapid changes occurring over seconds or long-term events over hours or days. For both short duration and longer-term live cell imaging assays, there are many factors that need to be considered for optimal experiment design and execution. In this webinar, we will discuss some of the common pitfalls that scientists encounter when setting up their live cell imaging assays and how to overcome them.
Key Learning Objectives:
- Optimizing sample preparation (from plate choice to seeding density)
- Reagent selection (including media and fluorescent labels)
- Overcoming bleaching and photo-toxicity
- Avoiding unnecessary oversampling
For Research Use Only. Not for use in diagnostic procedures.