
Access Agilent eNewsletter November 2016
High-throughput N-linked glycan profiling of monoclonal antibodies using Agilent integrated solution
Arunkumar Padmanaban and Sreelakshmy Menon, Agilent Application Scientists
Glycosylation patterns of therapeutic monoclonal antibodies (mAbs) play an important role in efficacy and safety. N-linked glycans, such as terminal galactose (Gal) residues, are known to impact antibody effector functions [1]. In addition, the presence of high levels of mannose species can have a significant impact on the pharmacokinetics of the antibody [2].
Characterization of glycosylation patterns
For manufacturers, characterization of glycosylation patterns is a key attribute of regulatory compliance. With the development of biosimilars [3], these characterization studies have become even more important, as glycosylation patterns can alter with different expression hosts, manufacturing process, scale, and culture conditions. A high-throughput approach to extract and analyze N-linked glycans is necessary during mAb development, for example during clone selection and quality control.
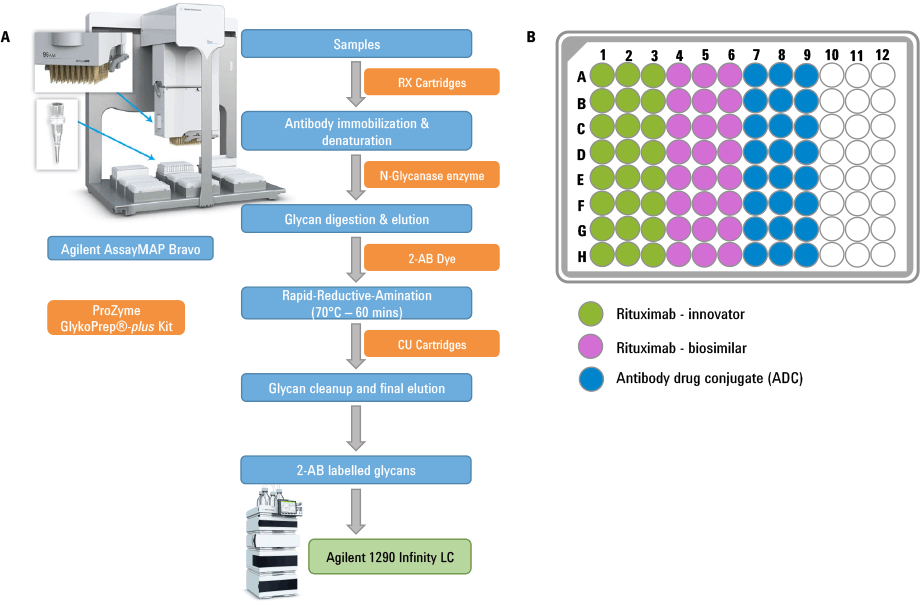
Figure 1. (A) Schematic workflow for the glycan isolation, labeling, purification followed by LC analysis using Agilent platforms. Components of the Agilent AssayMAP steps are shown in blue and the ProZyme kits are shown in orange. (B) 96-well plate layout showing the sample loading.
High-throughput sample preparation of N-glycans from mAbs
In this article we demonstrate how the Agilent AssayMAP Bravo platform was used for sample preparation in N-glycan analysis of three therapeutic antibodies. To simulate a high-throughput customer scenario, sample preparation was performed in a 96-well plate with replicates of 24 for each sample. The antibodies included rituximab-innovator, rituximab-biosimilar, and a lysine conjugated antibody drug conjugate (ADC). High-throughput capabilities were achieved through the combination of AssayMAP’s miniature (5 µL) packed micro chromatography column and Bravo’s 96 channel pipetting head with precise liquid flow controls.
First, N-glycan sample preparation was performed using the ProZyme GlykoPrep plus Rapid N-Glycan Sample Preparation with 2-AB kit and AssayMAP N-Glycan Sample Preparation module. The overall workflow is presented as a schematic diagram in Figure 1.
Then the automation protocol was set up using the N-Glycan Sample Prep: RX digestion and 2-AB labeling module from VWorks software suite.
For complete details of this application read Agilent publications 5991-6904EN and 5991-7024EN.
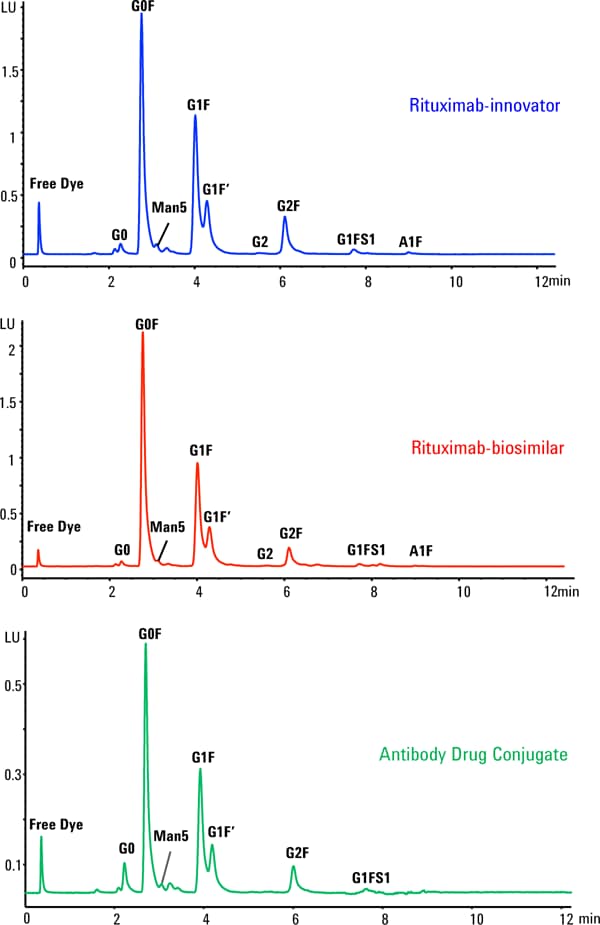
Figure 2. Glycosylation profile of rituximab-innovator, rituximab-biosimilar and antibody drug conjugate.
Integrated solution: Agilent 1290 Infinity LC and AdvanceBio Glycan Mapping columns
In this analysis, an Agilent AdvanceBio Glycan Mapping 300 Å, 2.1 x 150 mm, 1.8 µm column was used for the separation of the purified glycans. Agilent AdvanceBio Glycan Mapping columns offer fast, high resolution, reproducible separation of the glycans species. These columns use HILIC amide interaction and deliver better resolution and narrower bands with higher peak capacity.
Glycans were separated using 100 mM ammonium formate, pH 4.5, as the aqueous phase and acetonitrile as the organic phase in a gradient elution. Using this method all glycan species were separated within 6 minutes, saving analysis time per sample and increasing sample throughput (Figure 2). Released glycans from each sample well were HPLC analyzed in replicates of four. Agilent Glycan Mapping columns showed excellent reproducibility standard deviation (RSD) of less than 6% for peak height and peak area. Thus confirming the reproducible sample preparation capabilities of the Agilent AssayMAP Bravo platform. More details about the reproducibility of the AssayMAP platform can be found in the application note 5991-6904EN.
N-glycan profiling of mAbs
Next the peak area percentage of each glycan species was calculated for all three samples. Results are presented in Table 1. All three samples showed a similar trend in the distribution of the N-glycans with G0F as the major glycoform, followed by G1F, G1F’ isomer, and G2F. A correlation graph was plotted for the glycan percentage of the innovator and biosimilar mAb and showed a high similarity with an R2 of 0.973.
| N-Glycans | N-glycan percentage | |
|---|---|---|
| Rituximab – innovator | Rituximab – biosimilar | |
| GO | 1.5 | 0.8 |
| GOF | 42.2 | 50.5 |
| Man5 | 1.7 | 1.2 |
| G1F | 28.6 | 26.7 |
| G1F’ | 13.0 | 11.6 |
| G2 | 0.3 | 0.2 |
| G2F | 8.7 | 5.5 |
| G1FS1 | 0.9 | 0.6 |
| A1F | 0.2 | 0.5 |
| N-Glycans | ADC – N-glycan percentage |
|---|---|
| GO | 4.9 |
| GOF | 43.8 |
| Man5 | 1.3 |
| G1F | 26.8 |
| G1F’ | 13.0 |
| G2F | 6.5 |
| G1FS1 | 0.6 |
Table 1. N- Glycan area percentages of rituximab-innovator, rituximab-biosimilar, and antibody drug conjugate.
Choosing the right solution for N-glycan analysis
The results from these studies demonstrated a high-throughput workflow for N-linked glycan analysis from monoclonal antibodies. The workflow streamlined sample preparation with Agilent AssayMAP Bravo automation, which reduced manual handling steps and increased reproducibility with excellent precision. The Agilent AdvanceBio Glycan Mapping column enabled high resolution and fast glycan analysis.
To find out more about the Agilent AssayMAP Bravo platform watch this webinar. Then read our brochure to learn how Agilent automation solutions can increase throughputs and efficiencies in your busy laboratory.
References
- Hamm M, Wang Y, Rustandi R. “Characterization of N-Linked Glycosylation in a Monoclonal Antibody Produced in NS0 Cells Using Capillary Electrophoresis with Laser-Induced Fluorescence Detection” Pharmaceuticals, 6, 393–406 (2013).
- Primack J, Flynn G, Pan H. “A high-throughput microchip-based glycan screening assay for antibody cell culture samples”’ Electrophoresis, 32, 1129–32 (2011).
- Yoo DH. “The rise of biosimilars: potential benefits and drawbacks in rheumatoid arthritis”’ Expert Review of Clinical Immunology, 10:8, 981-3, (2014).
For Research Use Only. Not for use in diagnostic procedures.
Stay informed about the applications that are important to you
Subscribe to Access Agilent
Our free customized
monthly eNewsletter
Article Directory – November 2016
All articles in this issue
 Agilent 7010B and 7000D QQQ GC/MS systems expand your lab in multiple dimensions
 Fast, accurate analysis of SVOCs with Agilent 9000 Intuvo GC
 Integrated workflow simplifies automated calculation of antibody-drug conjugate (ADC) drug-to-antibody ratio (DAR)
 Tips & tricks:
How to simplify troubleshooting in your GC lab using Agilent ADM Flow Meter Agilent collaborates with BioPharma thought leaders in India to advance biosimilar characterization
 Achieve fast, high throughput size exclusion chromatography of mAbs and ADCs using Agilent AdvanceBio SEC columns
 Ask the Expert: How can I analyze virtually any polymer, from paints to polyolefins?
 Agilent LC/MS/MS solutions provide effective identification and quantitation of contaminants in botanical drug supplements
 Agilent JetClean self-cleaning ion source means you clean less, analyze more
 High-throughput N-linked glycan profiling of monoclonal antibodies using Agilent integrated solution
Figure 1
(A) Schematic workflow for the glycan isolation, labeling, purification followed by LC analysis using Agilent platforms. Components of the Agilent AssayMAP steps are shown in blue and the ProZyme kits are shown in orange. (B) 96-well plate layout showing the sample loading.
Figure 2
Glycosylation profile of rituximab-innovator, rituximab-biosimilar and antibody drug conjugate.