Access Agilent eNewsletter, October 2014
>> Update My Profile | Subscribe to Access Agilent | Article Directory
Do you need a new GPC column? Warning signs can help you decide
By Stephen Luke
Agilent GPC Columns Product Manager
Agilent columns for gel permeation chromatography are very robust, but not everything lasts forever. The time will come when you begin to see subtle changes in your chromatography. Things to look out for include changes in peak shape with loss of resolution, changes in Mw distribution data or backpressure, and shifts in retention time or calibration.
 Enlarge
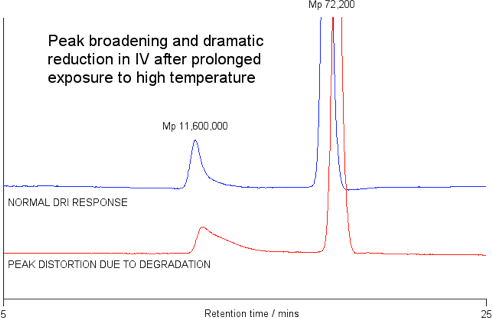
Figure 1. GPC chromatograms comparing good peak shape from a good column (blue) with a degraded peak shape from a column in need of replacement (red).
Column particle size (µm) |
Expected back pressure (bar) |
|---|---|
3 |
50 |
5 |
30 |
10 |
10 |
20 |
3 |
Table 1. GPC column particle sizes and expected backpressures for 7.5 x 300 mm columns at 1mL/min and 20 °C.
Changes in peak shape can be an early warning sign
Peak shape change appears most often as tailing, but is also evident with high molecular weight shouldering. However, the appearance of changes in peak shape can be subtle. Many factors lead to peak shape change, including deterioration of pore structure due to pressure, deterioration of pore volume due to interaction with analytes, surface modification of the stationary phase through peroxide formation, and dead volume or flow obstructions in the system. In Figure 1 we see an example of poor peak shape.
Look for shifts in MW distribution data
Molecular weight data in GPC is an average and can change based on loading, solvent choice, and other factors. Shifts in the molecular weight distribution data can be evident well before you see peak shape change with the naked eye. As a rule of thumb in an optimized GPC system, Mw (weight average molecular weight) can vary by about 3%, Mn (number average molecular weight) by about 5%, and polydispersity (Mw/Mn) by about 5%. Discovery of larger changes in these values require investigation and possible column replacement.
Do you notice fluctuations in back pressure?
Particle size, solvent choice, and temperature all affect backpressure. The system pressure should remain constant once equilibrated. As columns age, pressure can rise and fall because of precipitation of analytes that leads to blocked frits, column conditioning, and the use of immiscible solvents. Table 1 provides some guidelines on pore sizes and pressures.
Columns continually exposed to pressure fluctuation or excess can suffer from channeling, as shown in Figure 2.
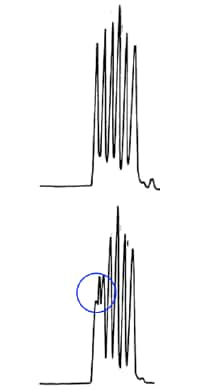
Figure 2. Peak splitting (circled below) in a GPC column caused by channeling from pressure issues.
Other changes to watch for
As well as changes in peak shape, retention time can also shift. Changes in RT suggest interaction from column contamination or column degradation. In addition, calibration curves can shift. Shifts in the calibration curves are often apparent in the polynomial fit.
Keep track of column performance
The first line of defense is to keep an archive of calibrations. You will then be able to overlay calibration curves to identify any shifts over time. You should also calibrate the column before and after every GPC sequence. With respect to calibration standards, it is advisable to purchase a broad standard that you run periodically. It is also important to spike all sample runs with a flow-rate marker and measure plate count. We recommend measuring performance when a column set is first used and at regular intervals after that. When efficiency falls below 70% of the starting value, consider replacing your columns. A helpful resource is the Agilent GPC/SEC Column User Guide for instructions on calculating plate counts.
Agilent offers a full range of GPC/SEC solutions
You can use method development to cure many of the symptoms of poor performance in GPC. However, if you need to change the column, check out the comprehensive range of Agilent GPC/SEC column resources for the analysis of synthetic and natural polymers, in organic and water-based solvents.
Explore Agilent GPC/SEC columns, standards, and instruments and see how they offer a clear advantage for the analysis of your polymers. There’s also a new, informative GPC wall chart – Achieve more with the polymer analysis people. Why not order your free copy today?
>> Update My Profile | Subscribe to Access Agilent | Article Directory