Access Agilent eNewsletter, June 2014
>> Update My Profile | Subscribe to Access Agilent | Article Directory

Quality-by-Design process delivers robust LC method in less time
By Syed Salman Lateef
Agilent Application Scientist
A traditional approach to analytical method development involves optimization of one variable at a time. The method developed by this approach could fail due to unrevealed interactions between important method variables. Because of its emphasis on risk management, a quality‑by‑design (QbD) approach to method development can lead to a more robust and rugged method. This article summarizes our recent success with QbD.
Use QbD to develop a method with consistent performance
The QbD approach begins with predefined objectives and uses science and risk management. The initial risk assessment is followed by multivariate experiments. Multivariate experiments are designed with the help of Design of Experiments (DoE), and the results are modeled. The multivariate analysis reveals the robust region of the design space, where deliberate changes in method variables do not affect method performance. This systematic approach eliminates the risk of method failures and improves method robustness/ruggedness. Additionally, with a QbD approach, you gain knowledge about the existing method so you can effectively implement control strategies on critical method parameters.
We recently demonstrated development of a stability indicating method for a linagliptin drug product utilizing QbD approaches on an Agilent 1290 Infinity Series Method Development Solution equipped with Fusion AE automated method development software (S-Matrix). The goal of this work was to develop a robust method where the active pharmaceutical ingredient (API) in a degraded sample showed resolution greater than 1.5.
 Enlarge
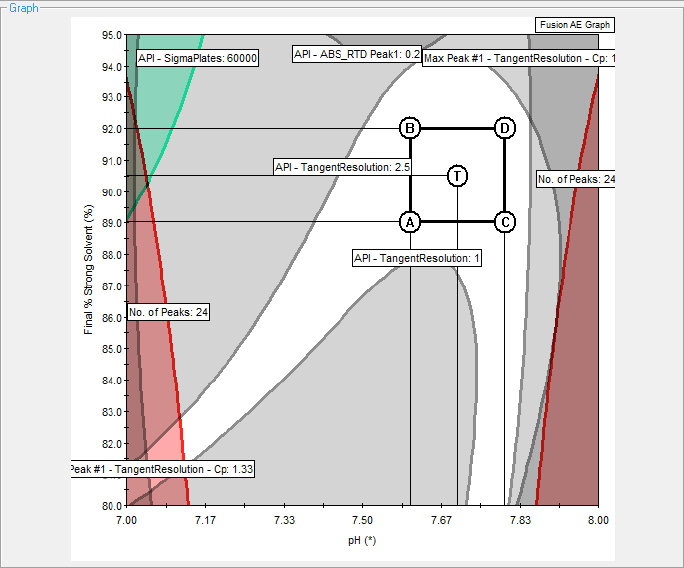
Figure 1. Contour plot for the mobile phase shows the final percentage organic versus pH. The square delineates the region of optimal performance.
 Enlarge
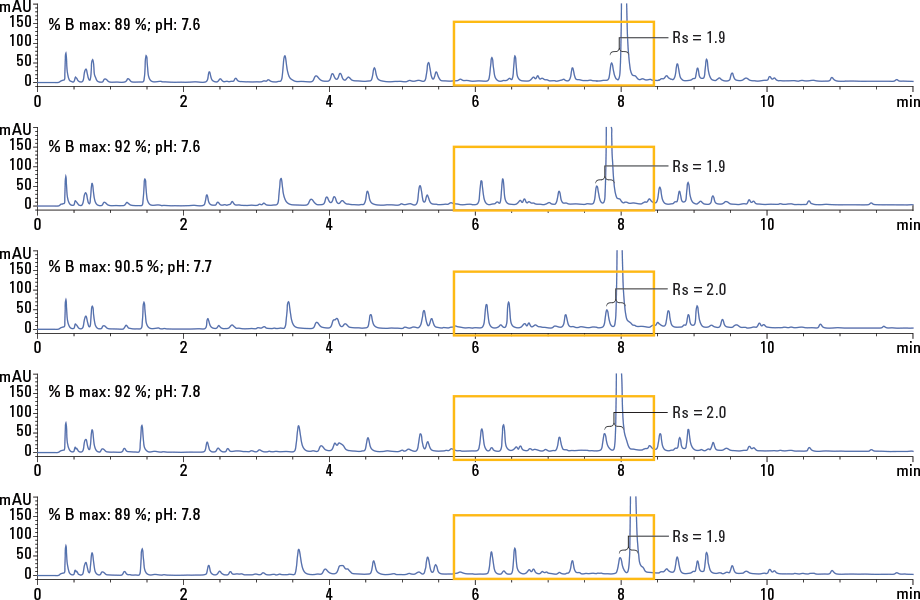
Figure 2. Overlay of the method design center and four robustness points. A change within the design space did not affect the method resolution.
To accomplish this goal, we connected an Agilent 1290 Infinity Binary Pump to an Agilent 1290 Infinity Valve Drive equipped with a 12-position/13-port valve. We could screen as many as 12 different solvents with one valve drive. The two Agilent 1290 Infinity Thermostatted Column Compartments (TCCs) were configured as clustered; the two 8-position/9‑port valves allowed us to connect up to eight 50-mm columns. The details of this work are described in Agilent Application Note 5991-3834EN.
Optimize your method while minimizing experimentation
We used multivariate analysis of several critical method parameters – including column and solvent type, percent organic mobile phase, pH, and column temperature – to determine the best performance and the final design space (Figure 1). The nonshaded region in the figure is the design space for percent strong solvent and mobile phase pH at the fixed oven temperature of 45 °C. The square shows the allowed variable regions for optimal method performance.
We achieved a robust final method with a column temperature of 45 °C, percent strong solvent of 90.5 % ± 1.5, and pH 7.7 ± 0.1. Small deliberate variations within the allowed deviations did not alter the targeted method resolution of greater than 1.5 (Figure 2).
Reduce failures in method development and transfer
The QbD approach to method development helped to better understand the method variables and reduced the chance of failure during method validation and transfer. Compared with manual method development, this automated method development approach provided a potentially better-performing and more robust method in less time.
If you are ready to develop methods more quickly and deliver robust, reliable separation conditions, explore more about QbD in Agilent Application Note 5991-3834EN.
Additional reading
- Gain Greater Confidence. Agilent Solutions for Quality-by-Design Implementation in Pharmaceutical Development, Agilent Primer, 5991-2166EN.
- International Conference on Harmonization (ICH) Q8(R2): Pharmaceutical Development. (August 2009).
>> Update My Profile | Subscribe to Access Agilent | Article Directory