RTCA Cardio Software

Real-Time Insights into Cardiomyocyte Function and Cardiac Safety
- The user-friendly RTCA Cardio Software provides outstanding instrument control for flexible experiment setups, data acquisition, and data analysis.
- The software works under two modes: Real-Time mode and Offline data analysis mode. The Basic license enables the data analysis function for data generated by Cardio system. The Advance License enables the data analysis function for data generated by Cardio and ePacer system.
- For Research Use Only. Not for use in diagnostic procedures.
- Real-time monitoring of the cardiomyoycte contractile activities and general health
- Analyzing cardiomyoycte beating rate, beating amplitude and beating irregularity
- Providing quantitative data to assess compound cardio liabilty
Overview
How it works
Step 1: Record plate layout
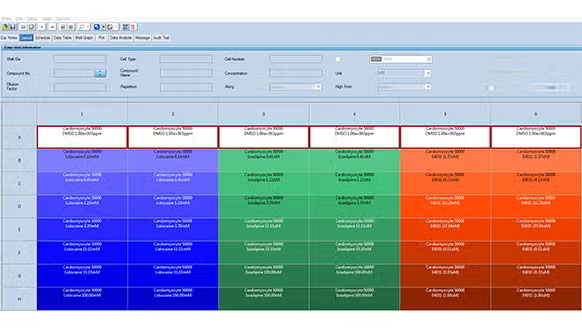
Using an intuitive graphical interface, the contents and conditions of each well in the electronic microplate (E-Plate) are recorded (Figure 1). Information fields for the wells include cell type, cell number, drug identity, drug concentration, etc. Table autofilling functions, like excel or other spreadsheet programs, are available. These functions enable rapid data entry and automatic establishment of drug concentration gradients, cell number titrations, etc. Even when multiple cell types and assay conditions are being examined, it takes just minutes to record the information for every well in a plate.
Figure 1. Zoomed in screenshot of table for recording the contents and /conditions of each well in an E-Plate.
Step 2: Define data acquisition parameters and run experiment
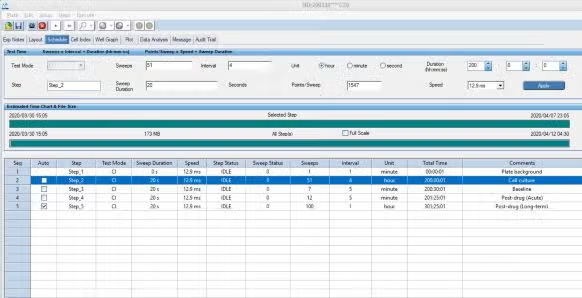
Using a second table, the details of data acquisition are defined.
Figure 2. Steps are preprogrammed on the schedule page to control how the data will be measured and collected from the cells. The data includes the recording interval and the time duration of continuous data recording.
Press run and watch as impedance data is acquired in real time for every well in the plate. Even as data is being acquired, it can be viewed and graphically manipulated.
Step 3: Data plotting and analysis
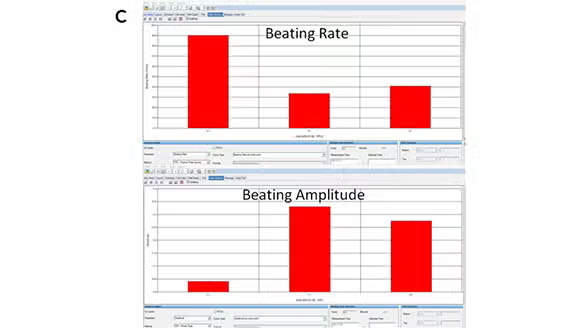
Using an intuitive graphical interface, the real-time impedance data for all the wells, or a subset of wells, from the E-Plate can be plotted (Figure A). Data from multiple wells can be averaged, and the coefficient of variation automatically calculated and plotted. The viewing window for the X- and Y-axis can be readily adjusted, and data traces can be normalized to a specific time point (for example, immediately before drug addition. By zooming in on a short time range, it is possible to view the rhythmic fluctuation in impedance resulting from cardiomyocyte beating (Figure B). Built-in data analysis tools enable the real-time impedance traces to be interrogated for drug-induced effects on cardiomyocyte beating activity. A total of 13 different parameters, including beating rate and amplitude, can be evaluated (Figure C).
Tools

Agilent Cell Analysis Publication Database
Search scientific publications by research area, cell type and more.

Agilent Cell Analysis Webinars
Featured webinars help you stay informed about timely cell analysis research topics.
Training & events
Agilent Cell Analysis Webinar Series
View informative Agilent Cell Analysis Technology webinars on a variety of research subjects.
News
Agilent xCELLigence RTCA Instrumentation Supports Potency Assay Development in Recent FDA Approval
Agilent xCELLigence Real-Time Cell Analysis (RTCA) technology supports the testing of accuracy and reliability in AUCATZYL, a recently approved CAR T therapy by Autolus Therapeutics. The xCELLigence RTCA technology supported the development and implementation of the potency assay. By providing precise and reliable cell analysis capabilities, Agilent supported Autolus's efforts in establishing robust analytical methods.
15 Jul 2025


